
記住我
Sarcomas are rare, heterogeneous malignant tumors originating from mesenchymal tissue, comprising less than 1% of all solid malignancies (1). Current treatments primarily include surgery, (neo)adjuvant chemotherapy, and/or radiotherapy (2). Despite standard therapies, clinical outcomes for metastatic or locally advanced sarcomas remain limited, with conventional treatments leading to non-durable responses and a survival rate of approximately 12 to 18 months (3). Immunotherapy has shown significant success in various solid tumors, providing promising treatment options (4–6). However, most sarcomas are “cold” tumors with minimal immune cell infiltration, potentially leading to poor immunotherapy responses (7). Combined immunotherapy has demonstrated efficacy in certain sarcoma subtypes, including alveolar soft part sarcoma, angiosarcoma, and undifferentiated pleomorphic sarcoma (8–10). Therefore, exploring the mechanisms of immune infiltration in sarcomas and combining immune checkpoint inhibitors (ICIs) with targeted therapies or chemoradiotherapy may offer new strategies for treating sarcomas.
Ubiquitin (Ub) is a small protein composed of 76 amino acids, widely present in most eukaryotic cells. It plays a crucial role in various cellular processes, including cell cycle progression, signal transduction, transcription regulation, receptor down-regulation, and endocytosis (11). Ubiquitination, an essential post-translational modification, involves an ATP-dependent cascade reaction, attaching Ub to substrate proteins (12, 13). While the ubiquitin-proteasome system primarily degrades intracellular target proteins, some ubiquitinated proteins perform non-degradative functions, such as gene transcription, expression, and DNA damage repair. Abnormal ubiquitination can contribute to tumor development and progression (14, 15). Tumor metastasis remains a leading cause of death in sarcomas and other malignancies. The extensive role of ubiquitination in tumor invasion and metastasis warrants further investigation. This study aims to explore the role of abnormal ubiquitination in SARC development, providing new insights for diagnosis and treatment.
In this study, we conducted a comprehensive bioinformatics analysis of URGs in SARC, examining their expression and prognostic implications, as well as their relationship with the tumor microenvironment. We developed a novel prognostic signature based on five URGs and constructed a ceRNA regulatory network. Our findings aim to enhance treatment strategies and prognostic evaluations for SARC.
2 Materials and methods2.1 Data sources and preprocessingWe obtained transcriptomic data of SARC samples from the GSE17674 dataset in the GEO database (https://www.ncbi.nlm.nih.gov/geo/) (16). Differential expression analysis between 44 SARC samples and 18 normal samples was performed using the “limma” package in R (v3.40.2) (17) (Supplementary Table 1). Adjusted P-values were used to correct for false positives, with DEGs selected based on |fold change (FC)| = 1.5 and adj.P-value < 0.05. Volcano plots were generated using the “ggplot2” R package (v4.2.1). Principal Component Analysis (PCA) plots were created with the “ggord” package to assess group differences. Using the GeneCards database (https://www.genecards.org/) (18), we searched for ubiquitination-related genes (URGs) with the keyword “Ubiquitination Related Genes.” In the GeneCards database, each gene is assigned a relevance score to evaluate its correlation with various elements, including chemical substances and diseases. A higher score indicates a stronger statistical correlation between the gene and the relevant components. Genes with a relevance score greater than 5 were included in the analysis (19), resulting in a total of 1,055 ubiquitination-related genes identified. (Supplementary Table 2). Additionally, 1794 immune-related genes (IRGs) were obtained from the Immunology Database and Analysis Portal (ImmPort) (https://www.immport.org/home) (20) (Supplementary Table 3). We used the “VennDiagram” package in R(v4.2.1) (21) to visualize the overlap of DEGs, IRGs, and URGs, identifying differentially expressed URGs (DEURGs). RNAseq data and clinical information for SARC, including 260 SARC samples and 2 normal samples, were integrated from the Cancer Genome Atlas (TCGA, https://portal.gdc.cancer.gov/) (22). Protein-protein interaction (PPI) network analysis of URGs was conducted using STRING (https://string-db.org/, version 11.5) (23). Data, normalized as Transcripts Per Million (TPM), were analyzed using the “ggplot2” R package (v4.2.1), and gene expression data were extracted to construct a data matrix, analyzed via Wilcoxon test.
2.2 Subtype establishmentWe extracted immune-related DEURGs from the TCGA expression matrix and performed consensus clustering analysis using the R package ConsensusClusterPlus (v1.54.0) (24). The maximum number of clusters was set to 6, with 100 repetitions and 80% resampling of the total samples (clusterAlg = “hc”, innerLinkage = ‘ward.D2’). Clustering heatmaps were generated using the R package pheatmap (v1.0.12), retaining genes with variance above 0.1. Based on URG expression profiles, TCGA cases were classified into two clusters (K=2), labeled as C1 and C2.
2.3 Identification and enrichment analysis of differentially expressed genesDifferential expression analysis between C1 and C2 subtypes was conducted using the Limma package (v3.40.2) in R. DEGs were identified with the criteria of “Adjusted P < 0.05 and log2(fold change) > 1.5 or log2(fold change) < -1.5.” Heatmaps were drawn using the “heatmap” package in R (v4.2.1). Functional enrichment of DEGs was performed using the “clusterProfiler” R package (v3.18.0) (25), analyzing Gene Ontology (GO) and Kyoto Encyclopedia of Genes and Genomes (KEGG) pathways. GO enrichment analysis encompassed Biological Process (BP), Cellular Component (CC), and Molecular Function (MF). Gene set enrichment analysis (GSEA) (http://software.broadinstitute.org/gsea/index.jsp) (26) identified potential biological pathways, with significant pathways defined by p.adjust < 0.05 and FDR < 0.25.
2.4 Genetic alteration analysisGene Set Cancer Analysis (GSCA) (http://bioinfo.life.hust.edu.cn/GSCA/#/) integrated expression, mutation, drug sensitivity, and clinical data from four public sources for 33 cancer types. Somatic mutations in SARC patients were downloaded and visualized using the maftools package in R, covering seven mutation types: Missense_Mutation, Multi_Hit, Frame_Shift_Del. We analyzed the correlation between URG mRNA expression and CNV/methylation, and their impact on survival outcomes, including Disease Free Interval (DFI), Disease Specific Survival (DSS), Overall Survival (OS), and Progression Free Survival (PFS). The cBioPortal (http://www.cbioportal.org/index) (27) was used to visualize genetic alterations and their effects on survival outcomes.
2.5 Construction of the URG prognostic modelKaplan-Meier curves, P-values, and hazard ratios (HR) with 95% Confidence Intervals (CI) were obtained via logrank test and univariate Cox regression. Significant URGs affecting SARC prognosis (CALR, CASP3, BCL10, PSMD7, PSMD10) were identified. Expression and diagnostic efficiency of URGs were validated in SARC using GSE21122, GSE17674, and GSE36001 datasets. A prognostic model was developed using LASSO-Cox regression analysis, with risk scores calculated as: Riskscore=∑iCoefficient(mRNAi)×Expression (mRNAi). Patients were categorized into low- and high-risk subtypes based on average risk scores. Kaplan-Meier analysis and timeROC analysis assessed survival differences and model accuracy. Subsequently, we validated the accuracy of the URG risk model using the aforementioned formula by randomly dividing SARC patients from the TCGA-SARC dataset into two validation sets: Validation Set 1 (n = 130) and Validation Set 2 (n = 130). The external validation cohort included GSE21257, GSE17674, GSE16091, and clinical SARC tissue samples (28, 29), further confirming the previous results. Univariate and multivariate Cox regression analyses, visualized with forest plots, showed each variable’s impact (including P-value, HR, and 95% CI). A nomogram predicting 1, 3, and 5-year survival rates was established using the “rms” R package (v4.2.1).
2.6 Immune cell infiltration and immunotherapy response analysisThe “ggstatsplot” R package (v4.2.1) analyzed the abundance of immune cells infiltrating tumors for five prognostic URGs, including B cells, CD4+ T cells, CD8+ T cells, Neutrophils, Macrophages, and Myeloid dendritic cells. Reliable immune scoring was performed using the”immunedeconv” R package (v4.0.3) (30) and six algorithms: TIMER (31), xCell (32), MCP-counter (33), CIBERSORT (34), EPIC (35), and quantTIseq (36). The ssGSEA method in the “GSVA” R package (v4.2.1) (37) quantified the infiltration levels of 24 common immune cell types. Differences in immune cell infiltration levels between high- and low-expression groups were analyzed using the Wilcoxon rank sum test, and correlations between URG expression and immune cell infiltration were assessed with Spearman analysis. The ESTIMATE algorithm estimated immune and stromal cell abundance and tumor purity. Expression of immune checkpoint genes and HLA members was analyzed and visualized using the “ggplot2” and “pheatmap” R packages (v4.2.1). Spearman correlation analysis, visualized with the “circlize” package (v0.4.1), examined relationships between URG expression, immune checkpoints, and HLA members. TIDE algorithm predicted potential responses to immune checkpoint blockade (38), validated using GSE91061, IMvigor210 datasets, and clinical samples.
2.7 TMB, MSI, mRNAsi, and drug sensitivity analysisClinical application of our signature was explored by comparing TMB and MSI scores between high- and low-risk groups using the Wilcoxon rank sum test, visualized with “ggplot2” R package (v4.2.1). Optimal TMB cutoff values were calculated using the “surv_cutpoint” function in the “survminer” R package (v4.2.1), dividing patients into low- and high-TMB/MSI groups. Kaplan-Meier survival curves compared OS between these groups. Drug response prediction utilized GDSC (https://www.cancerrxgene.org/) and CTRP (https://portals.broadinstitute.org/ctrp/) databases. Chemotherapy drug IC50 values were estimated with the “pRRophetic” R package (v4.0.3) (39), integrating drug sensitivity and gene expression profiles from GDSC and CTRP databases.
2.8 Single cell analysisThe Tumor Immune Single Cell Center (TISCH, http://tisch.comp-genomics.org/) (40) was utilized to investigate the expression of prognostic URGs in different single-cell subpopulations within the tumor microenvironment (TME) of SARC patients. TISCH focuses on single-cell RNA sequencing (scRNA-seq) data specific to the TME, offering detailed cell type annotations across various cancer types. In this study, the dataset SARC_GSE119352_aPD1aCTLA4 from TISCH was analyzed, providing t-SNE plots and heatmaps to illustrate the impact of URGs on the SARC tumor microenvironment. The dataset encompasses three primary cell types: immune cells, stromal cells, and malignant cells.
2.9 Pan-RNA epitranscriptomic gene selectionThe expression differences of m6A, m5C, m1A, and m7G related genes between high and low-risk groups in 260 SARC samples were analyzed using the Wilcoxon test and visualized with the “ggplot2” package in R (v4.2.1). The correlation between prognostic URGs and these RNA modifications was also examined. The expression matrices included:
- m6A genes: RBM15B, VIRMA, HNRNPA2B1, YTHDF3, IGF2BP3, HNRNPC, RBM15, RBMX, METTL14, YTHDC2, METTL3, ZC3H13, WTAP, YTHDF1, YTHDC1, FTO, YTHDF2, ALKBH5.
- m5C genes: DNMT1, DNMT3A, DNMT3B, MBD1, MBD2, MBD4, MECP2, TDG, UHRF1, UHRF2, UNG, ZBTB33, ZBTB38, ZBTB4, TET1, TET2, TET3.
- m1A genes: TRMT10C, TRMT61B, TRMT6, TRMT61A, ALKBH3, ALKBH1, YTHDC1, YTHDF1, YTHDF2, YTHDF3.
- m7G genes: AGO2, CYFIP1, DCP2, DCPS, EIF4A1, EIF4E, EIF4E3, EIF4G3, GEMIN5, IFIT5, LARP1, LSM1, NCBP1, NCBP2, NCBP3, NSUN2, NUDT11, SNUPN, WDR4.
2.10 Prediction of potential microRNA and long non-coding RNA target genesCandidate miRNAs were identified and their potential targets were predicted using ENCORI (http://starbase.sysu.edu.cn/) (41), RNAInter (http://www.rnainter.org/) (42), miRDB (http://mirdb.org) (43), and RNA22 (https://cm.jefferson.edu/rna22/interactive) (44). These selected miRNAs were termed potential miRNA target genes. Additionally, potential lncRNAs were predicted using ENCORI and miRNet (http://www.mirnet.ca/) (45). A regulatory network comprising mRNA-miRNA and miRNA-lncRNA interactions was constructed using Cytoscape (version 3.7.1; http://www.cytoscape.org/) (46). The correlations and prognostic values of these candidate miRNAs and lncRNAs in SARC were further validated through ENCORI, TCGA-SARC, and the Kaplan-Meier plotter database.
2.11 Human specimensThe study included tissue samples from 32 pairs of sarcoma and corresponding normal tissues, specifically comprising osteosarcoma (n=6), liposarcoma (n=4), leiomyosarcoma (n=6), and undifferentiated pleomorphic sarcoma (n=16). Additionally, patient follow-up information was provided by the Chaohu Hospital of Anhui Medical University. The tissue specimens were formalin-fixed and pathologically examined for definitive diagnosis. The study was approved by the Ethics Committee of Chaohu Hospital of Anhui Medical University (Approval No: KYXM-202403-014), and informed consent was obtained from all patients. All experiments complied with relevant guidelines and regulations.
2.12 RT-qPCRTotal RNA was extracted from cultured cells using high-purity RNA separation kits (Roche Diagnostics, Mannheim, Germany) and DNase I (Roche Diagnostics, Sigma-Aldrich), following the manufacturer’s instructions. RNA was reverse transcribed using the HiScript® II 1st Strand cDNA Synthesis Kit (MR101-01, Vazyme, Nanjing, China). Quantitative RT-PCR was performed using AceTaq® qPCR SYBR Green Master Mix (Q121-03, Vazyme, China). The amplification conditions were: pre-denaturation at 95°C for 30 seconds, denaturation at 95°C for 5 seconds, annealing at 60°C for 30 seconds, for a total of 40 cycles. Primer sequences (Gene Pharma, China) are listed in Supplementary Table 8. The mean cycle threshold (Ct) value of each target gene was normalized to the housekeeping gene GAPDH, and results were shown as fold change using the ΔΔCt method.
2.13 Cell lines and culture conditionsThe cell lines used in this study were 143B, SW982, SW872, osteoblast cell line (hFOB1.19, Punosai, Wuhan, China), synovial fibroblast (HFLS, Jennio Biotech, Guangzhou, China), and human preadipocyte line (HPA-v, Sciencell). All cell lines were cultured in Dulbecco’s Modified Eagle Medium (DMEM; Gibco, Grand Island, NY, United States) supplemented with 10% fetal bovine serum (Gibco, Grand Island, NY, United States), 100 U/ml penicillin, and 100 U/ml streptomycin (Invitrogen, Carlsbad, CA, United States). The hFOB1.19 cell line was cultured at 34°C in an incubator with 5% CO2, while the other cell lines were cultured at 37°C with 5% CO2.
3 Results3.1 Identification of immune-related differentially expressed URGs in SARCThe flowchart of the study is illustrated in Figure 1. Initially, 3117 differentially expressed genes (DEGs) were identified from the GSE17674 dataset, comprising 2313 upregulated and 804 downregulated genes (Figure 2A). Principal component analysis (PCA) indicated distinct transcriptomic profiles between the two groups (Figure 2B). From the GeneCards database, 1055 URGs were identified, while the ImmPort database provided 1793 IRGs. A total of 24 overlapping immune-related differentially expressed URGs were selected for further analysis (Figure 2C). Additionally, the correlation of expression profiles of these 24 URGs was explored using the TCGA database, revealing a significant positive correlation among most URGs in SARC samples (Figure 2D). Protein-protein interaction (PPI) network analysis using STRING demonstrated close interactions among m7G-related proteins, essential for the molecular mechanisms and metabolism of malignancies (Figure 2E).
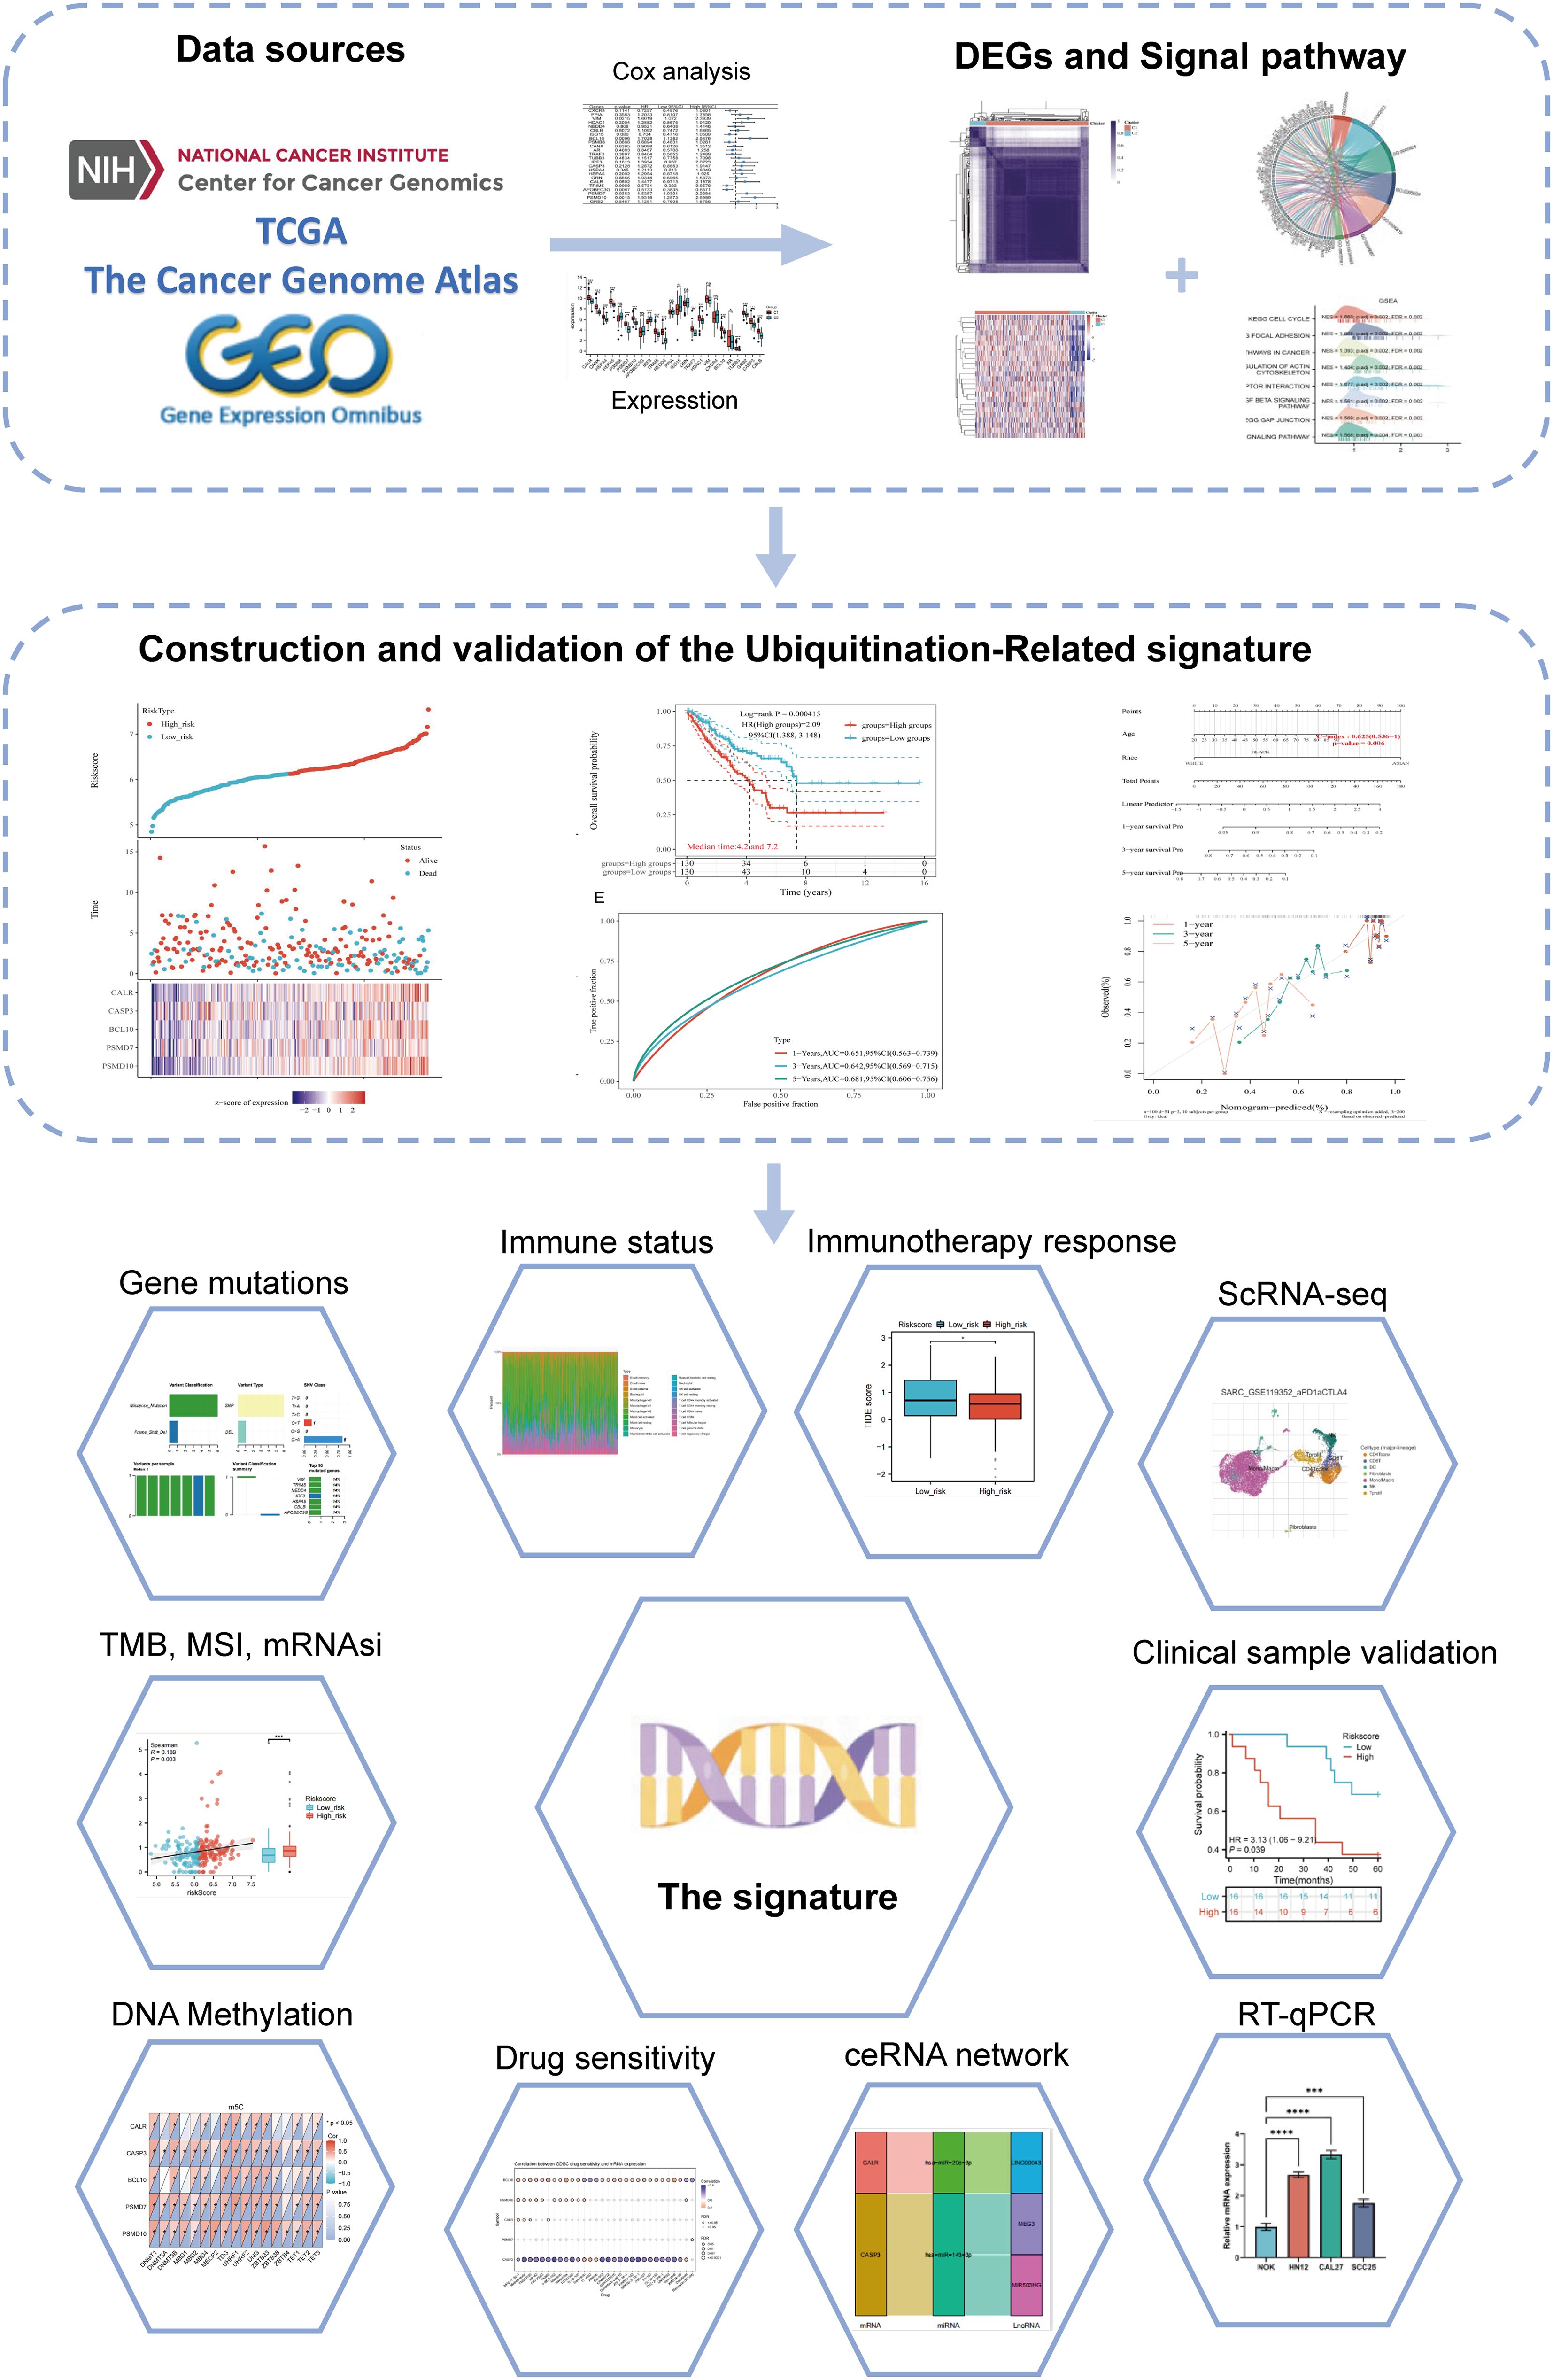
Figure 1. Flowchart of the present study.
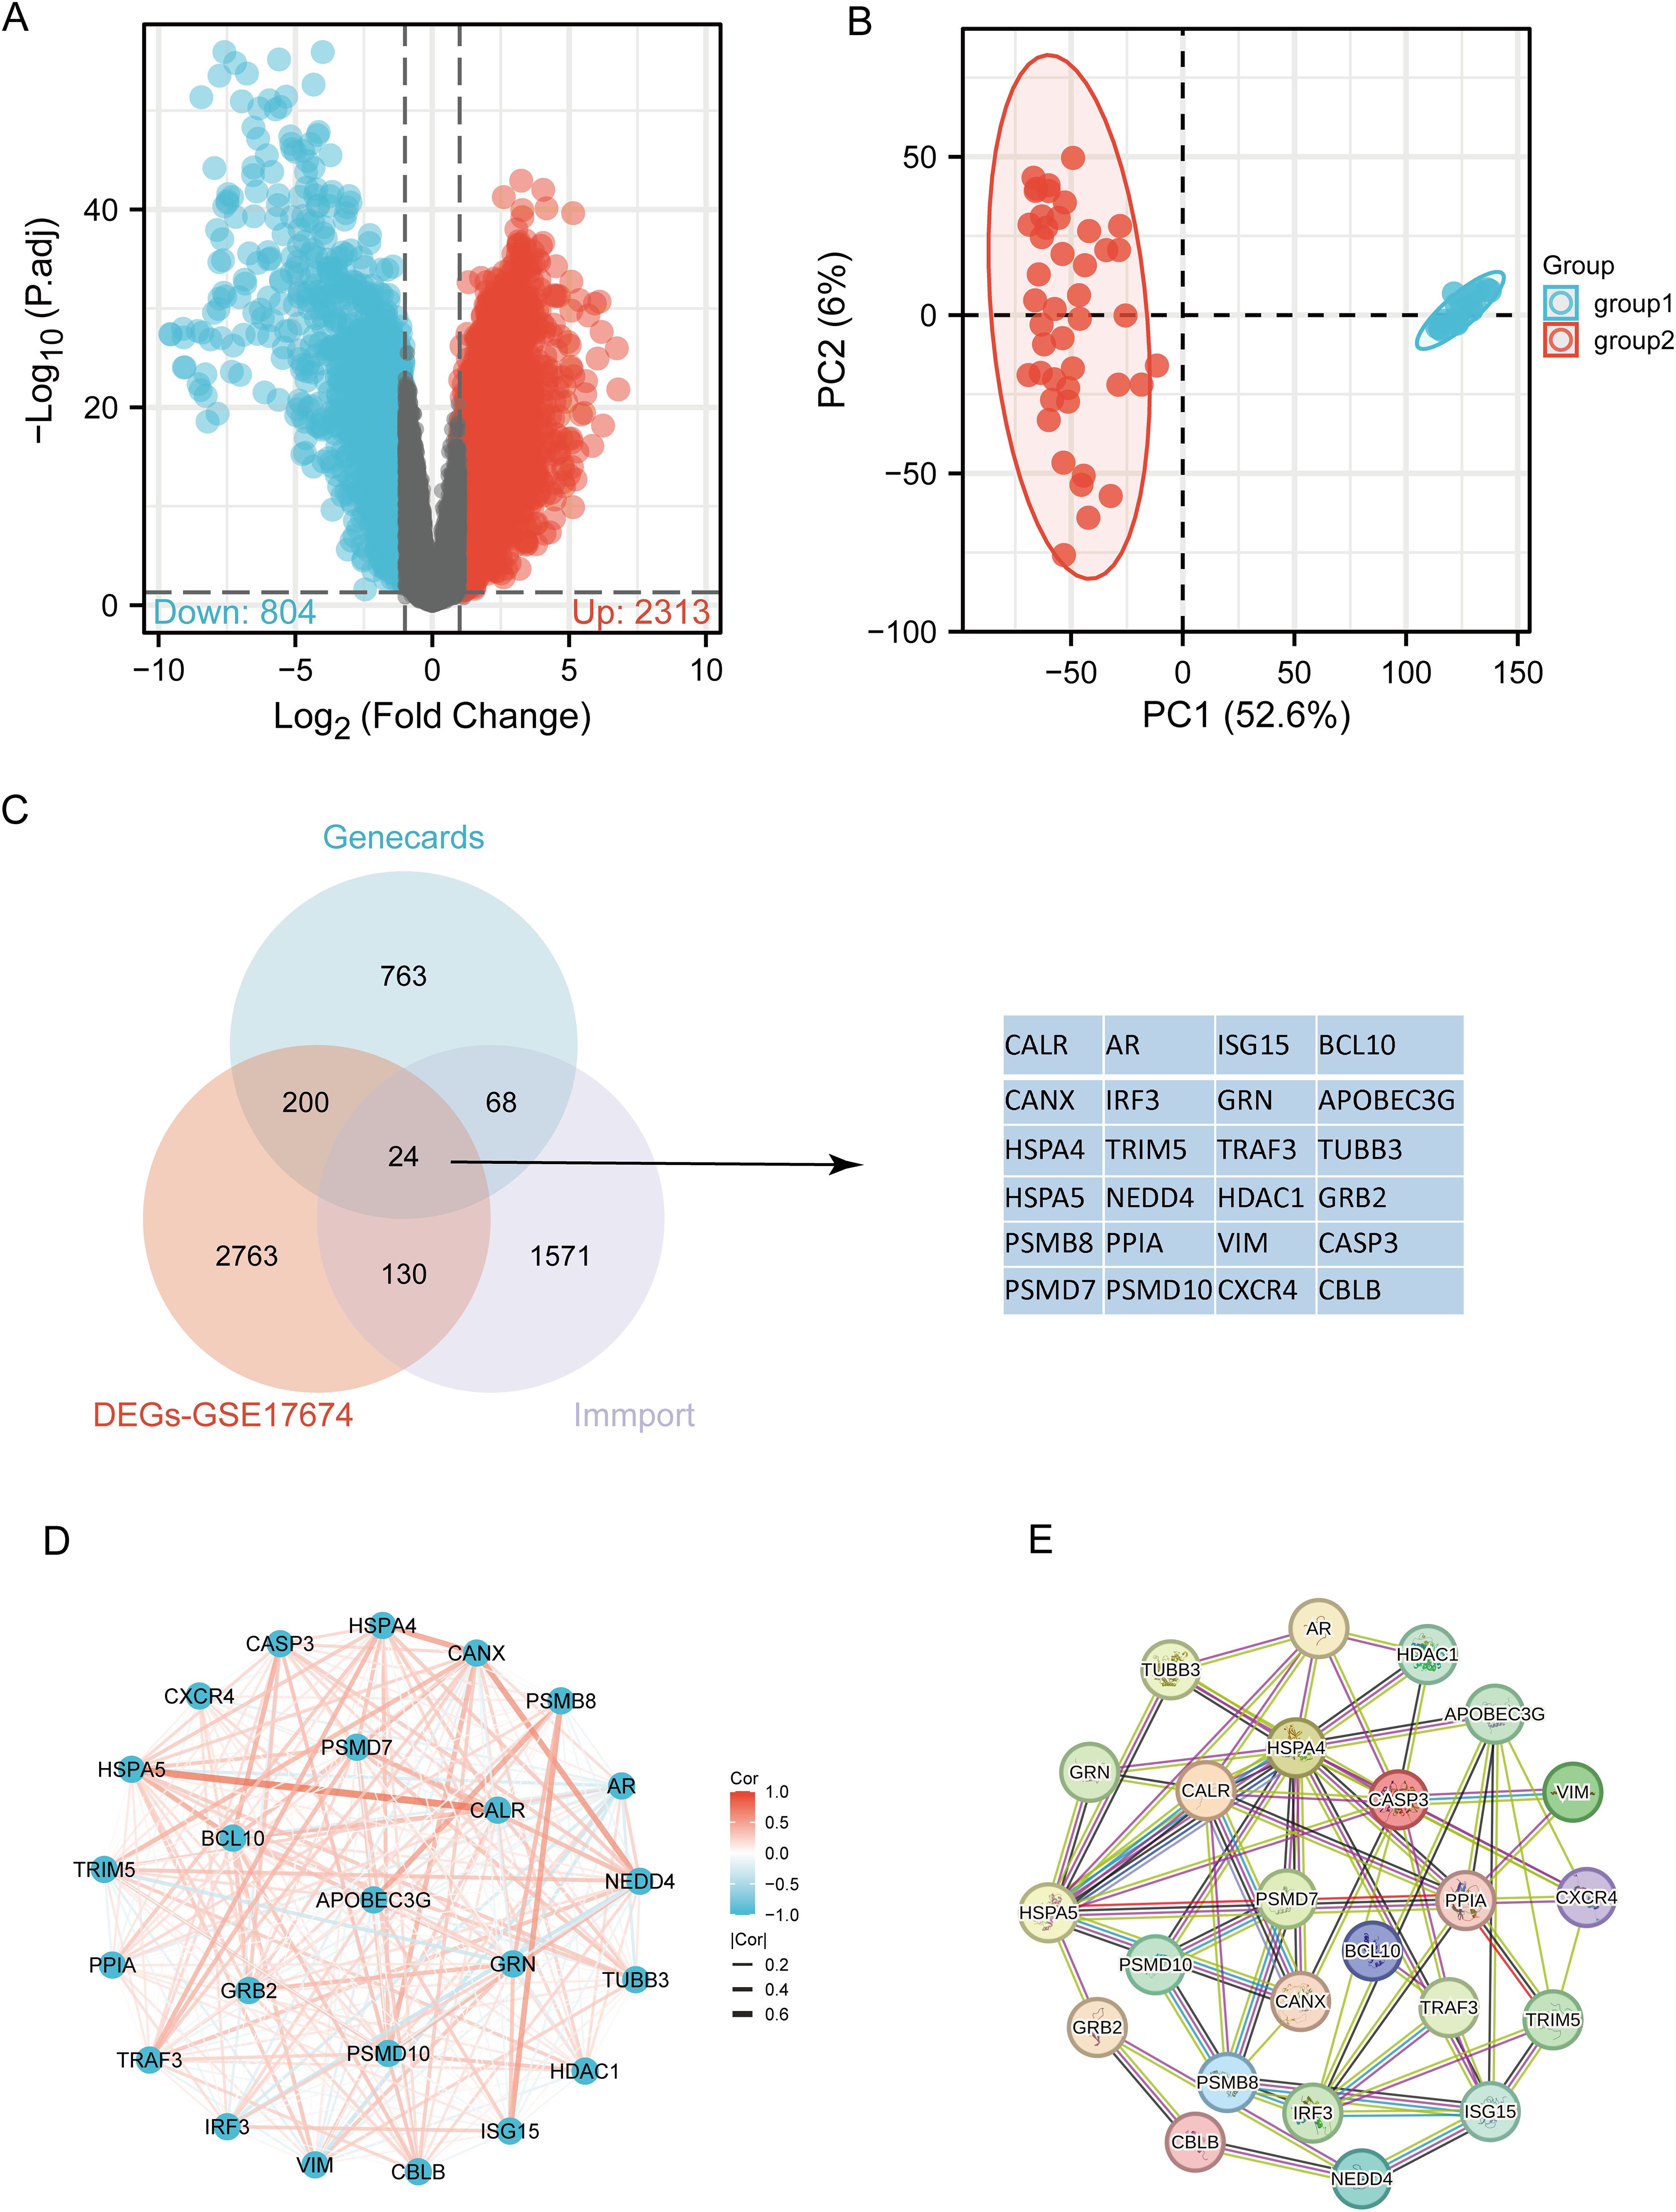
Figure 2. Identification of differentially expressed URGs related to immunity. (A) Volcano plot of DEGs between SARC and normal samples in the GSE17674 dataset; (B) Principal component analysis of transcriptome profiles of differentially expressed genes between two groups; (C) Spearson correlation analysis of 24 URGs expression in SARC; (D) Venn diagram showing the overlap between DEGs, URGs, and IRGs; (E) Protein-protein interaction (PPI) network of URGs.
3.2 Identification and analysis of clusters of URGs in SARCBased on the expression levels of 24 URGs in SARC, consensus clustering was performed on 260 SARC samples from the TCGA database. The optimal number of clusters was determined to be 2 (k=2), classifying SARC patients into two clusters: C1 (N=224) and C2 (N=36) (Figures 3A–D). Expression differences of the 24 URGs between the two subgroups were validated using the TCGA dataset. Compared to the C2 group, the C1 group showed upregulation of CALR, CANX, HSPA4, HSPA5, PSMD7, PSMD10, TRIM5, NEDD4, TRAF3, HDAC1, BCL10, AR, TUBB3, GRB2, CASP3, and CBLB, while IRF3 and ISG15 were downregulated (Figure 3E). Kaplan-Meier survival analysis indicated worse overall survival (OS) for C1 patients compared to C2, although the difference was not statistically significant (Figure 3F).
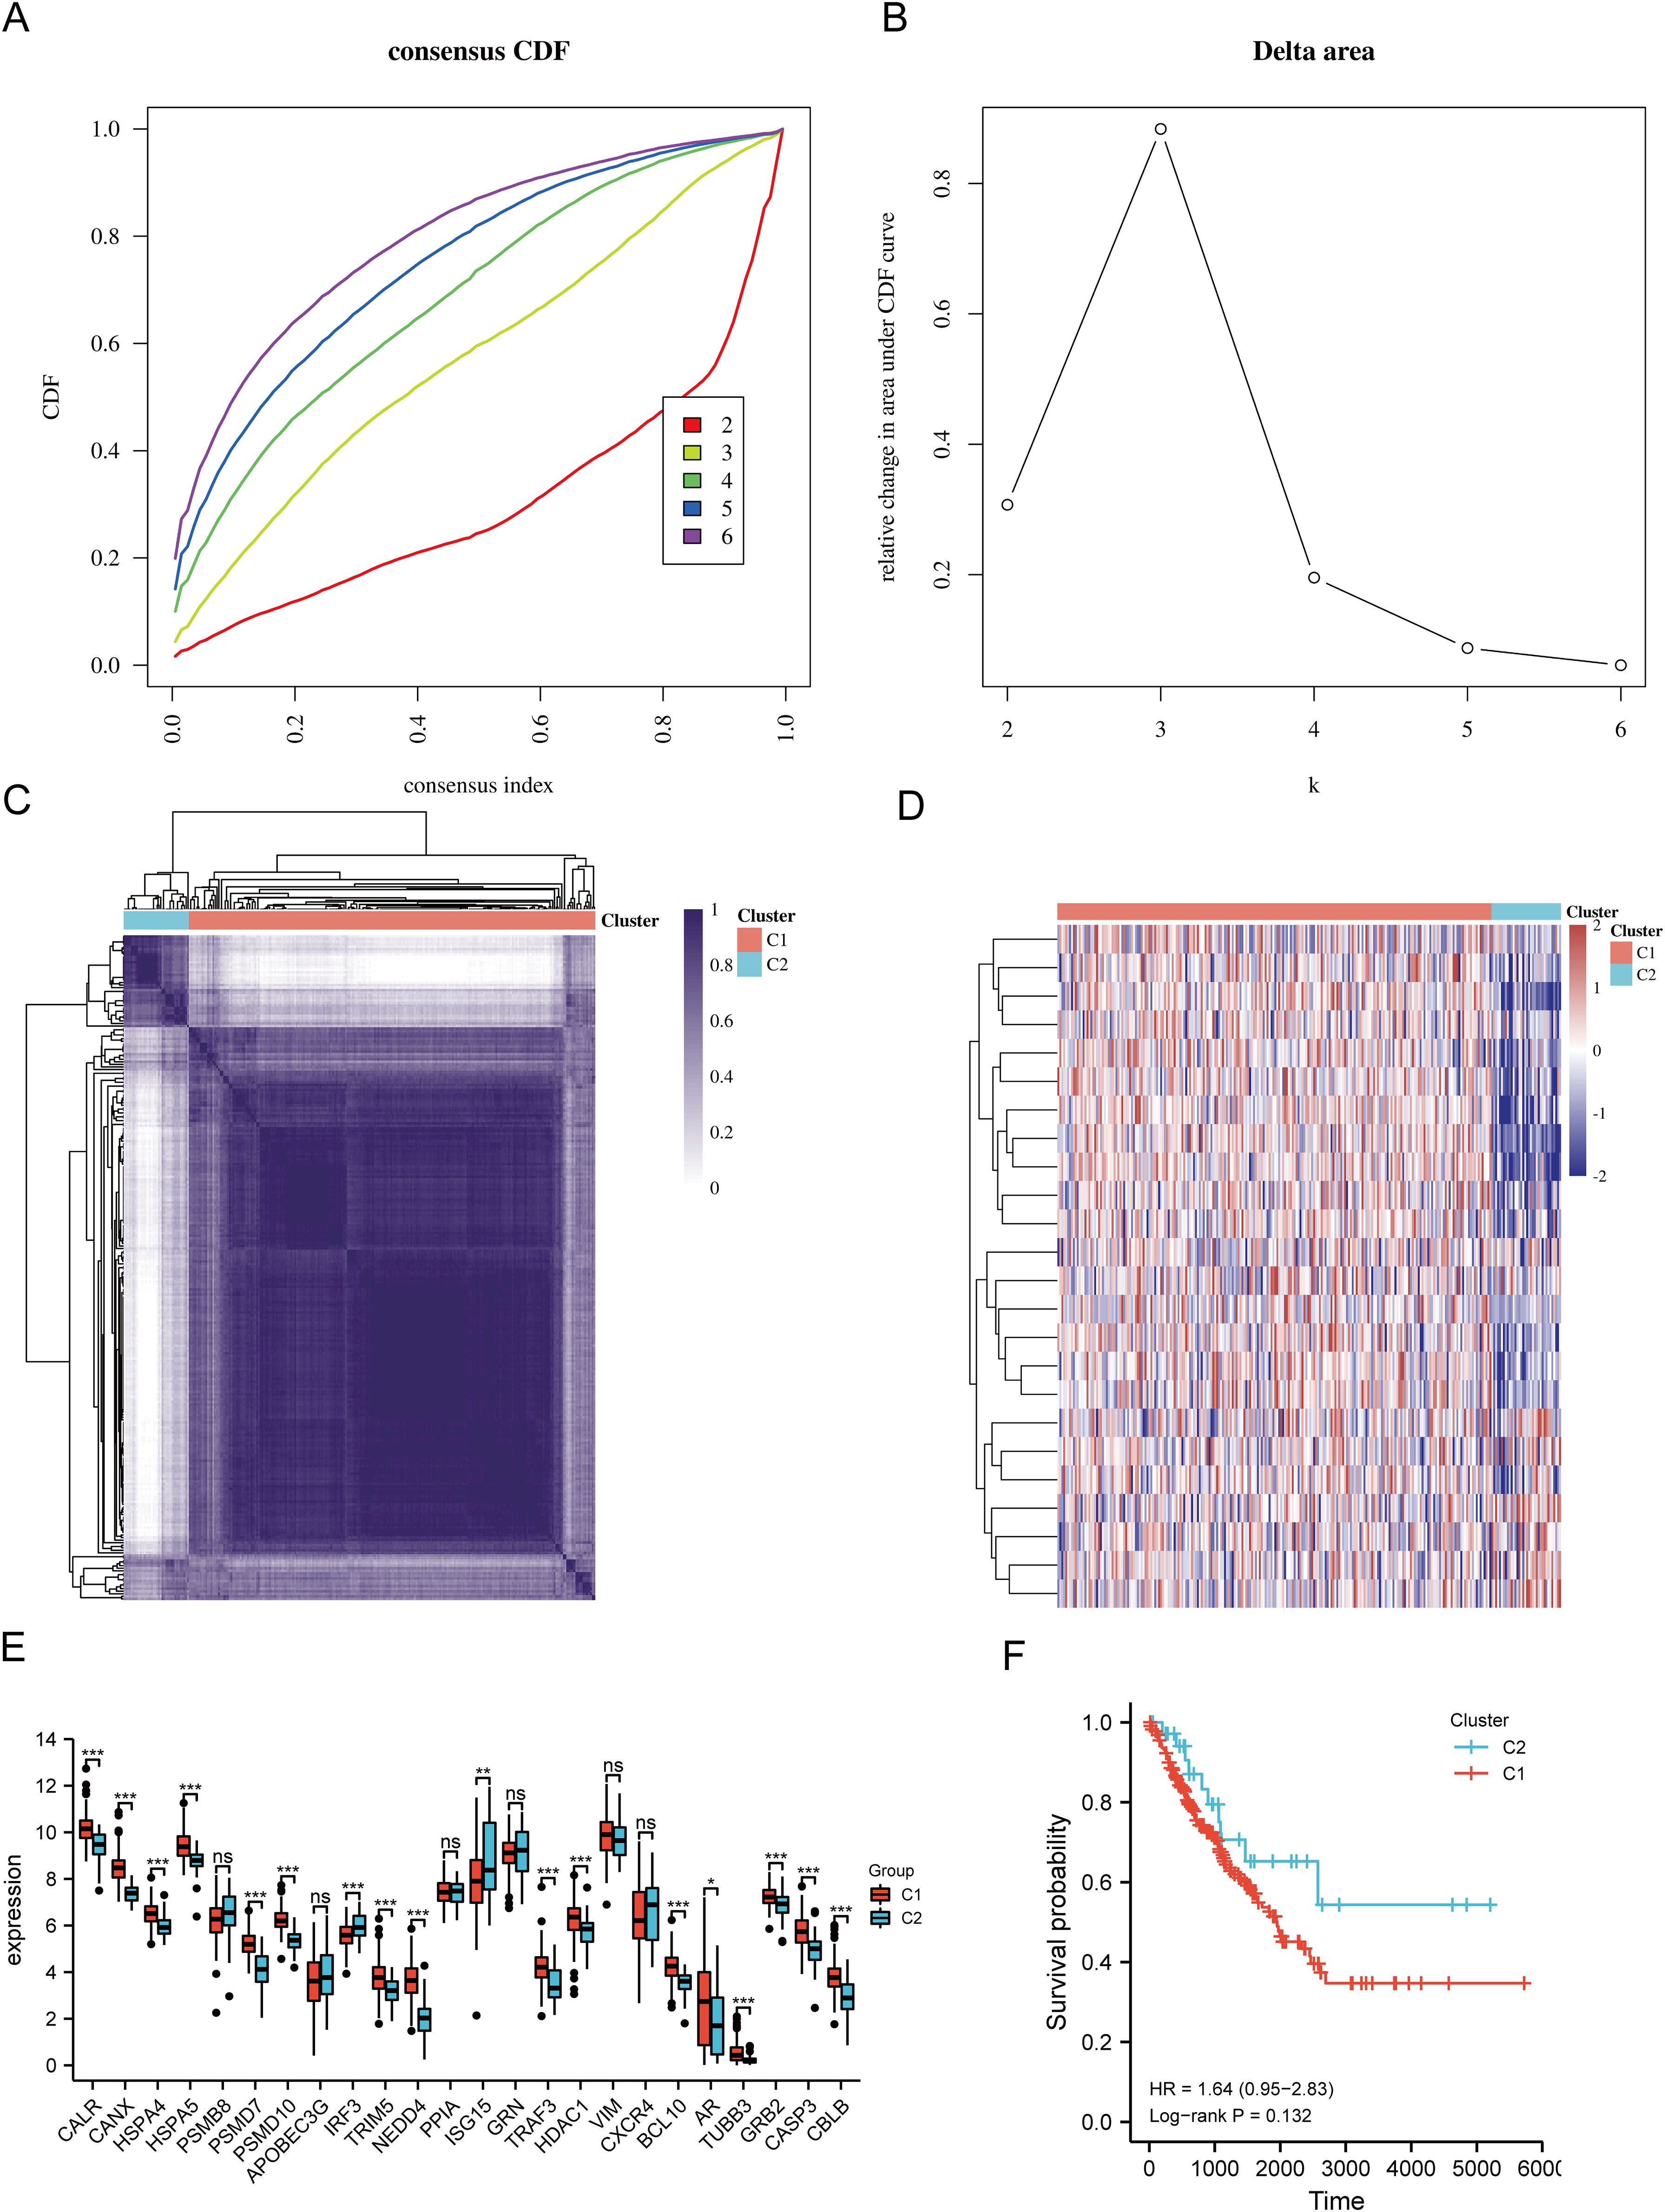
Figure 3. Identification of shared clusters based on the expression similarity of URGs. (A) Cumulative distribution function (CDF) (k = 2-6); (B) Relative change in area under the CDF curve (k = 2-6); (C) Consensus clustering matrix (k = 2); (D) Heatmap of URGs expression in different subtypes; (E) Expression of 24 URGs between C1 and C2 subgroups; (F) Kaplan-Meier survival analysis based on two clusters. *p < 0.05, **p < 0.01, ***p < 0.001. n.s., no significance.
3.3 Differential gene expression and functional enrichment in SARC subtypesThe DEGs between the two SARC subtypes (C1 and C2) included 6152 upregulated and 423 downregulated genes. These differences were visualized through a volcano plot (Figure 4A) and a heatmap (Figure 4B). GO and KEGG enrichment analyses of the identified DEGs were performed (Supplementary Table 4). GO enrichment analysis revealed that biological processes (BP) were mainly associated with cell-substrate adhesion, extracellular matrix organization, mitotic nuclear division, stem cell population maintenance, cell cycle G1/S phase transition, epithelial cell morphogenesis, and collagen fibril organization. Cellular components (CC) included collagen-containing extracellular matrix, focal adhesion, spindle, chromosomal region, endoplasmic reticulum chaperone complex, and collagen trimer. Molecular functions (MF) focused on extracellular matrix structural constituent, cell adhesion molecule binding, collagen binding, growth factor binding, and small GTPase binding (Figure 4C). KEGG pathway enrichment indicated involvement in pathways such as focal adhesion, ECM-receptor interaction, PI3K-Akt signaling pathway, phagosome, dilated cardiomyopathy, and vascular smooth muscle contraction (Figure 4D). GSEA pathway enrichment suggested associations of URG expression with cell cycle, focal adhesion, pathways in cancer, ECM receptor interaction, TGF-beta signaling pathway, GAP junction, ERBB signaling pathway, and regulation of actin cytoskeleton (Figure 4E, Supplementary Table 5).
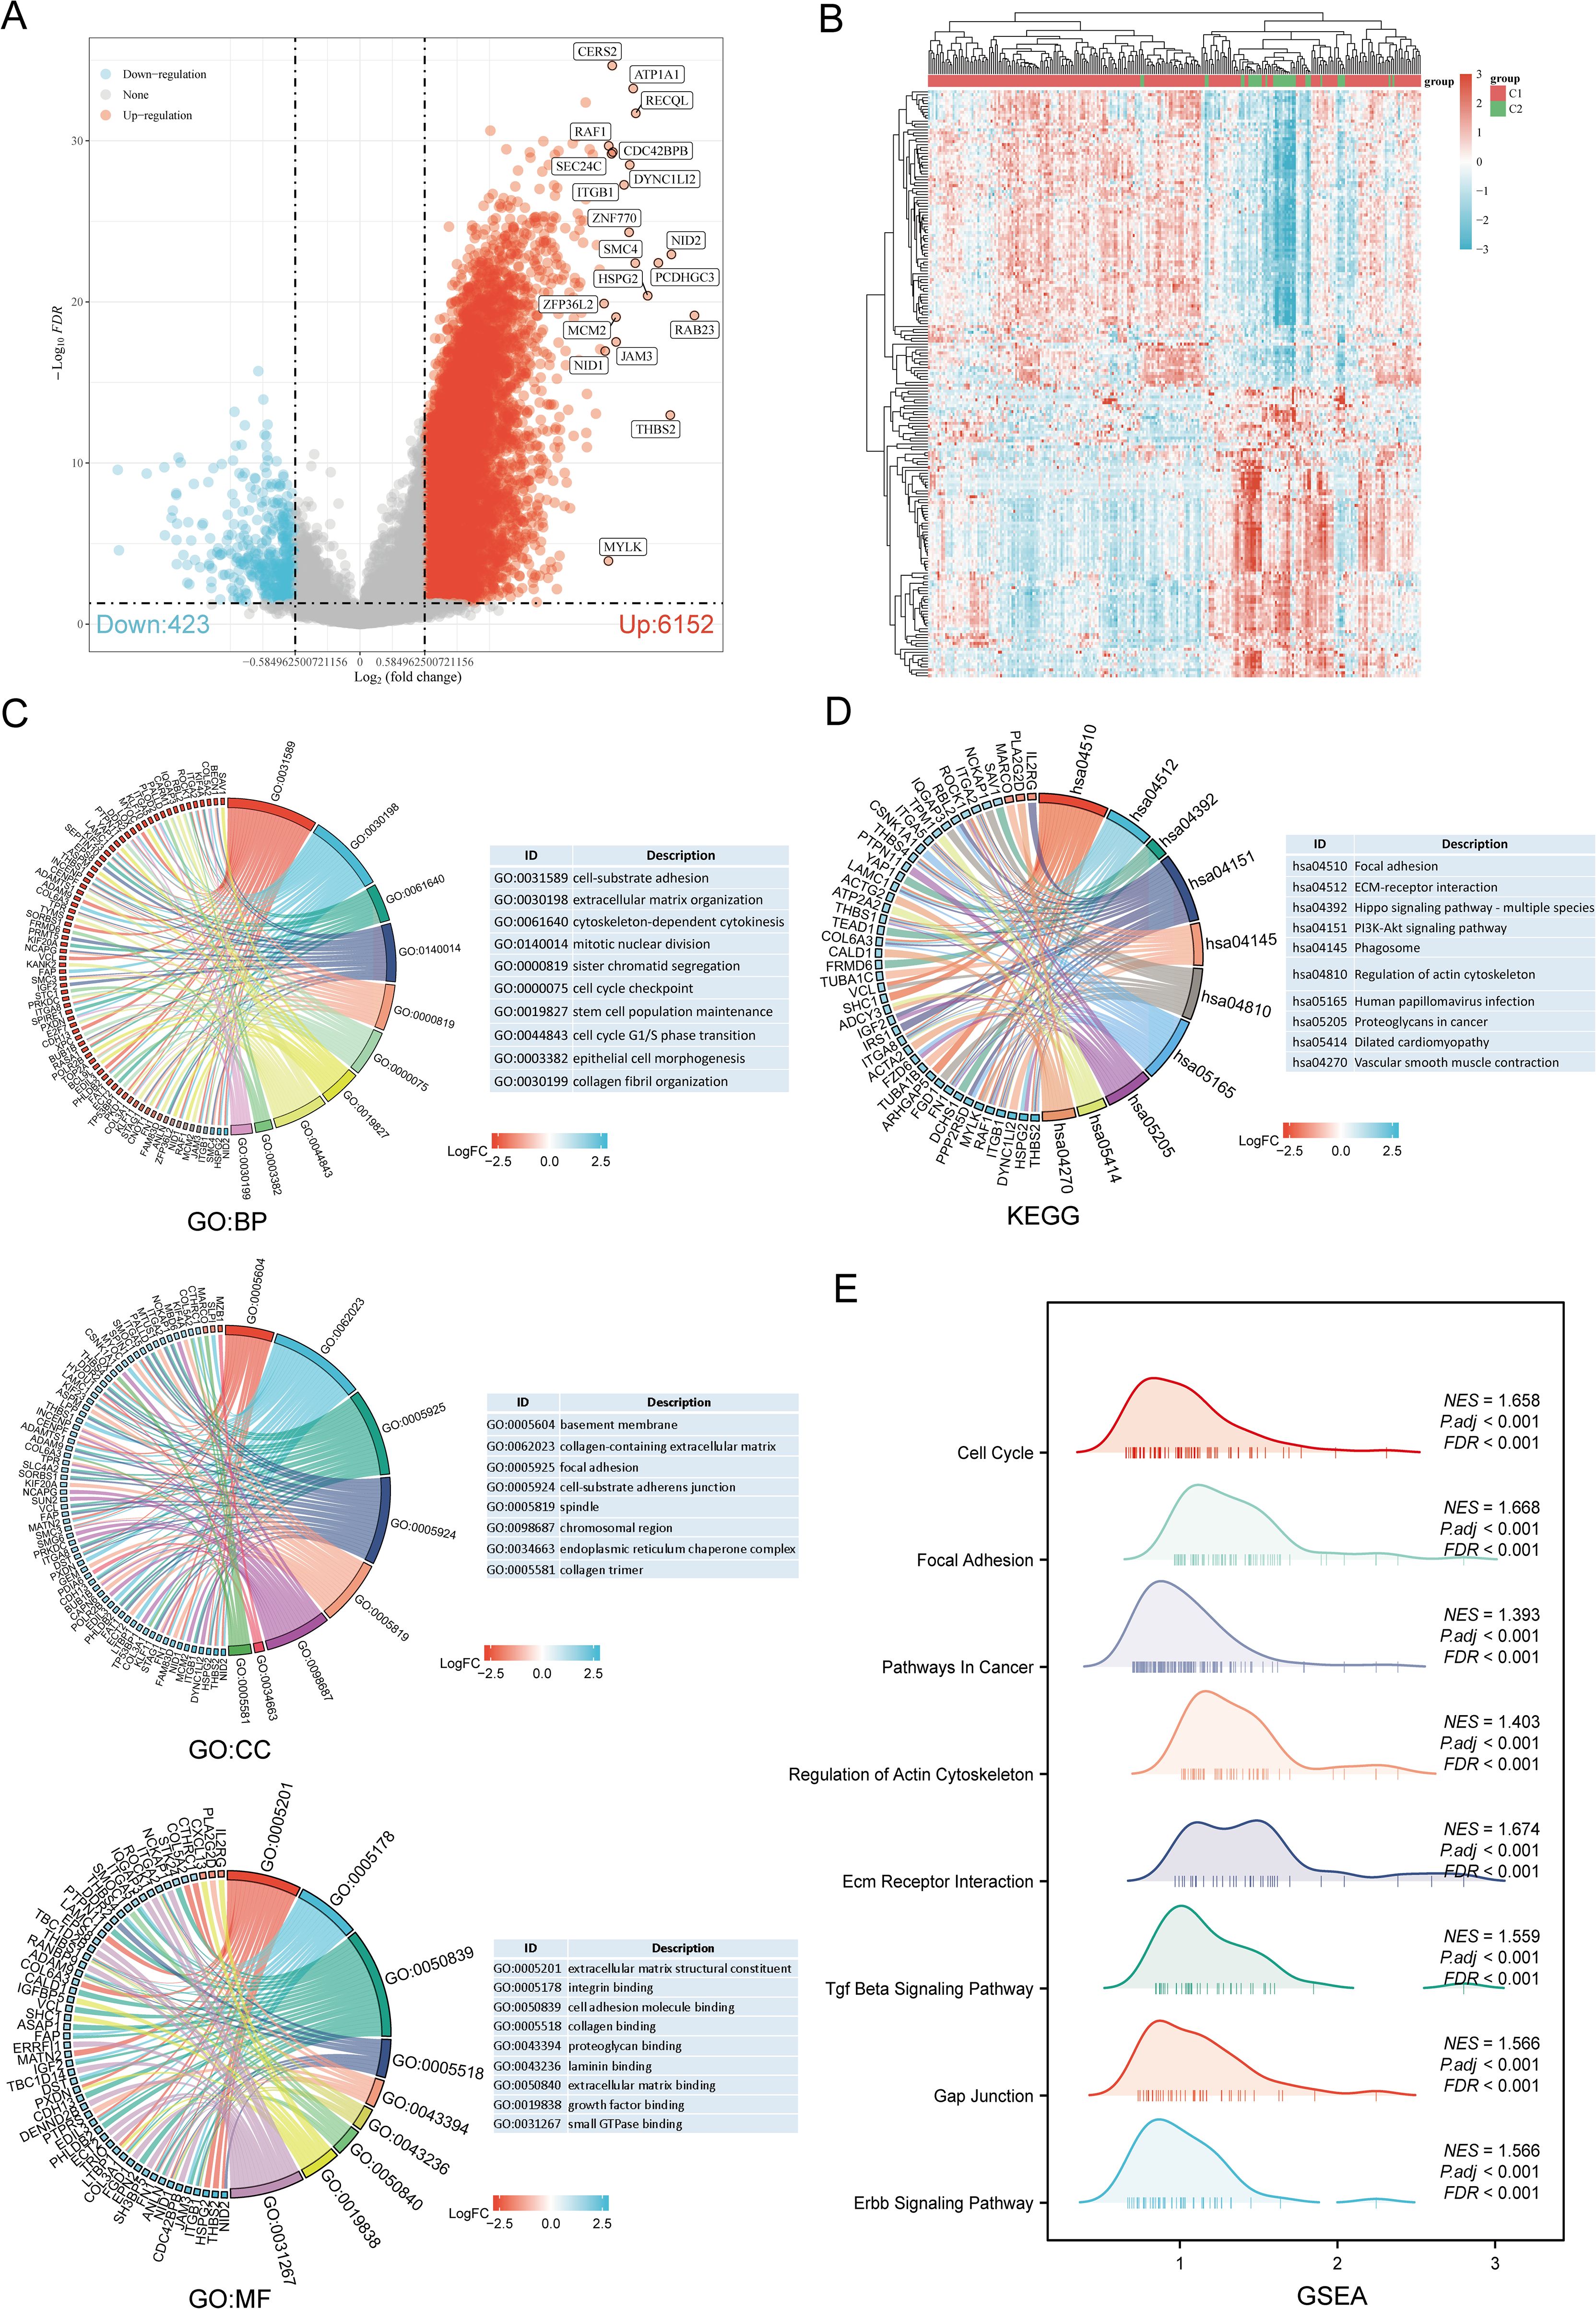
Figure 4. Identification and functional enrichment analysis of DEGs between URGs subtypes. (A) Volcano plot of DEGs between C1 and C2 subtypes; (B) Heatmap of DEGs between C1 and C2 subtypes; (C, D) GO and KEGG enrichment analysis of DEGs; (E) GSEA enrichment plot.
3.4 Genetic alteration analysisUsing the GSCA database, the percentage map of single nucleotide variants (SNVs) was analyzed, revealing a high mutation frequency for FLNA. Oncoplot displayed SNVs for the top 7 genes among URGs, with APOBEC3G, CBLB, HSPA5, IRF3, NEDD4, TRIM5, and VIM each showing a 14% mutation frequency (Figure 5A). Missense mutations were the most common type (Figure 5B). Single nucleotide polymorphisms (SNPs) were more frequent than deletions (Figure 5C), with C>T being the most common SNV type (Figure 5D). The median number of mutations per patient was found to be 1 (Figure 5E). A box plot showed the number of occurrences for each variant classification (Figure 5F). By recalculating the number of mutations and considering multiple hits, the top 7 mutated genes were identified (Figure 5G). Correlation analysis of URGs CNV and mRNA expression from the GSCA database indicated a significant positive correlation, while gene methylation levels showed a negative correlation with mRNA expression (Figure 5H). Figure 5I showed that for some URGs, CNV and methylation levels were significantly associated with poor prognosis in SARC patients. Survival analysis from the cBioPortal database indicated that genetic alterations in URGs were significantly associated with shorter OS (p=0.010), PFS (p=0.0448), DFS (p=0.0275), and DSS (p=7.565e-4) (Figure 5J).
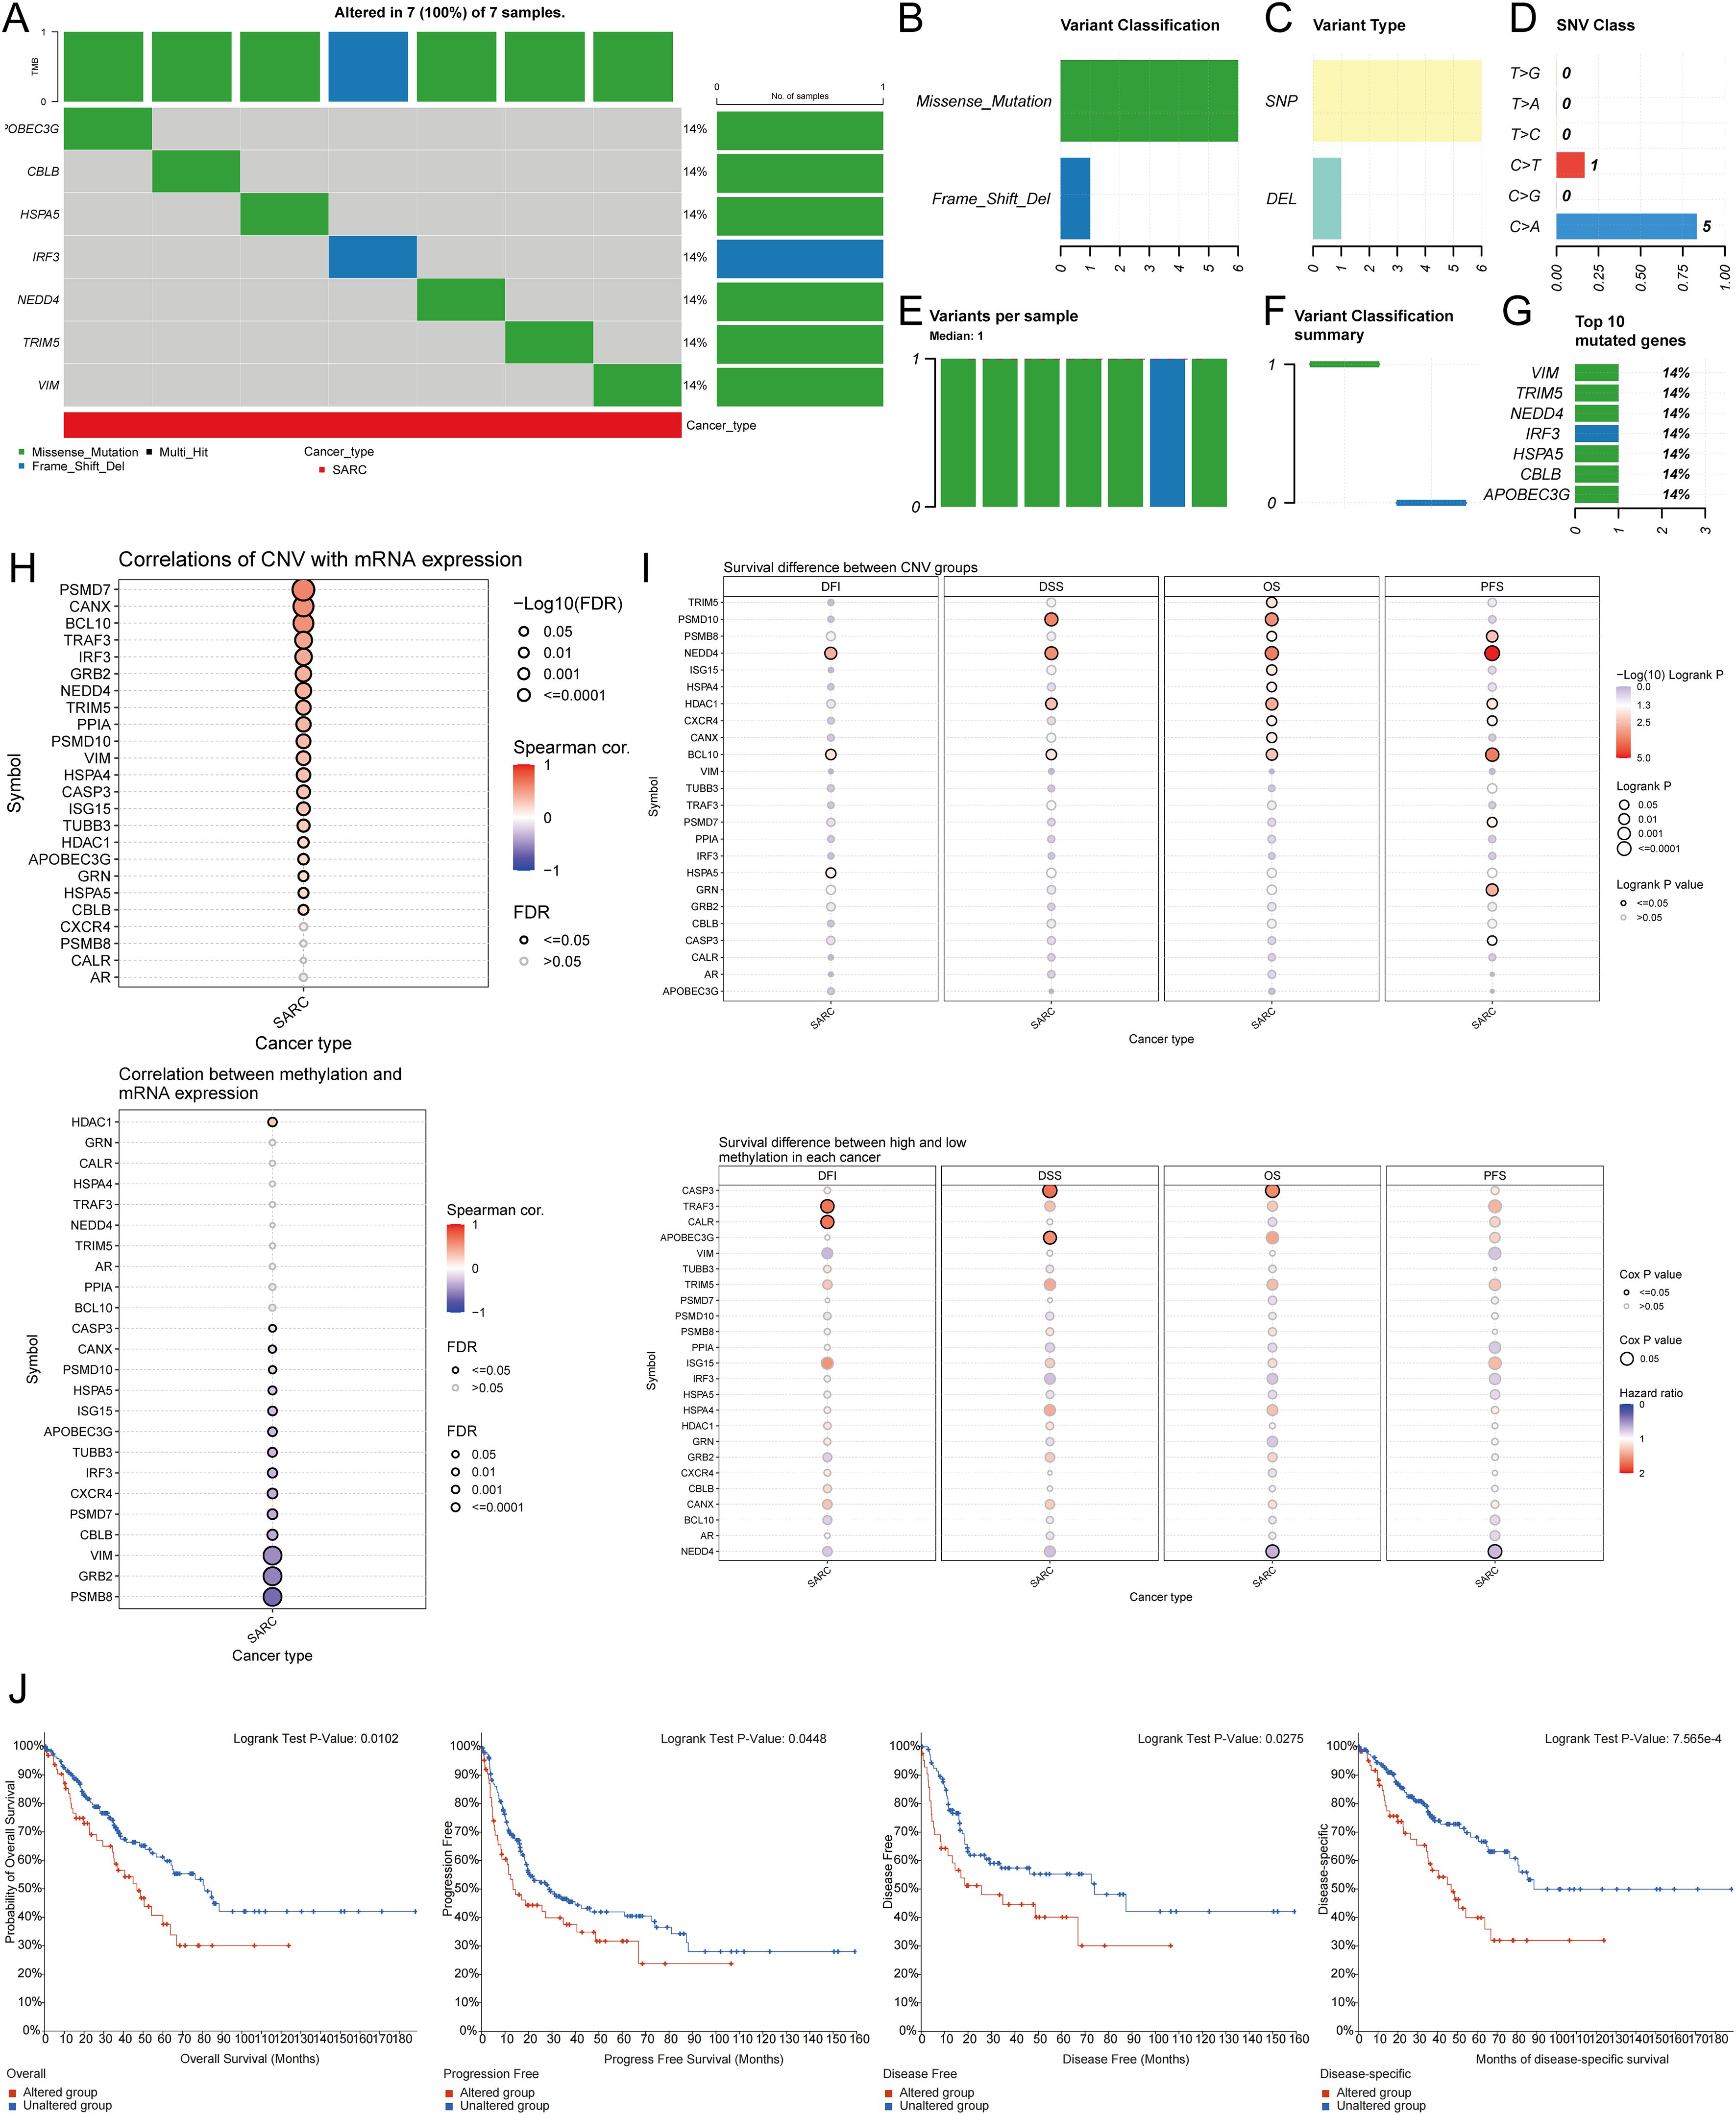
Figure 5. Analysis of genetic alterations associated with URGs in SARC. (A) Distribution of mutation types in the first 7 URGs in SARC; (B-D) Variant classification, variant type, SNV class; (E) Mutation burden per sample; (F) Variant classification summary; (G) Top 7 mutated genes in SARC; (H) Relationship between CNV, methylation, and URGs expression; (I) Correlation between URGs CNV, methylation, and survival rates; (J) Association between URGs alterations and shorter OS, PFS, DFS, and DSS in SARC patients.
3.5 Identification of prognostic URGs in SARCUnivariate Cox regression analysis was used to predict and screen for prognostic URGs in SARC patients (Figure 6A). OS analysis showed that high expression of BCL10, PSMD7, PSMD10, and VIM was associated with lower survival rates. PFS analysis indicated that high expression of CALR, CASP3, PPIA, and VIM predicted poor prognosis in SARC. DSS analysis results demonstrated that high expression of BCL10 and PSMD10 was significantly associated with poor prognosis (Figure 6B). Kaplan-Meier survival curves showed that high expression of CALR (P=0.035, HR=1.54 (1.03-2.30)), CASP3 (P=0.018, HR=1.50 (1.07-2.09)), BCL10 (P=0.007, HR=1.703 (1.16-2.60)), PSMD7 (P=0.031, HR=1.56 (1.04-2.33)), and PSMD10 (P=0.002, HR=1.91 (1.27-2.87)) was associated with lower survival rates in SARC patients. The expression levels and diagnostic efficacy of prognostic URGs were further validated using the GEO database. High expression levels of prognostic URGs were significantly upregulated in the GSE21122, GSE17674, and GSE36001 datasets compared to the low-expression group (Figure 6C). In the GSE21122 dataset, the AUC values for CALR, CASP3, BCL10, PSMD7, and PSMD10 were 0.996, 0.877, 0.855, 0.740, and 0.949, respectively. In the GSE17674 dataset, the AUC values were 1.000, 1.000, 1.000, 0.996, and 0.966, respectively. In the GSE36001 dataset, the AUC values were 0.851, 0.693, 0.807, 0.877, and 0.982, respectively (Figure 6D). The five prognostic URGs (CALR, CASP3, BCL10, PSMD7, and PSMD10) demonstrated consistently good sensitivity and specificity in diagnosing SARC. In conclusion, high expression levels of CALR, CASP3, BCL10, PSMD7, and PSMD10 were identified as potential prognostic biomarkers for SARC.
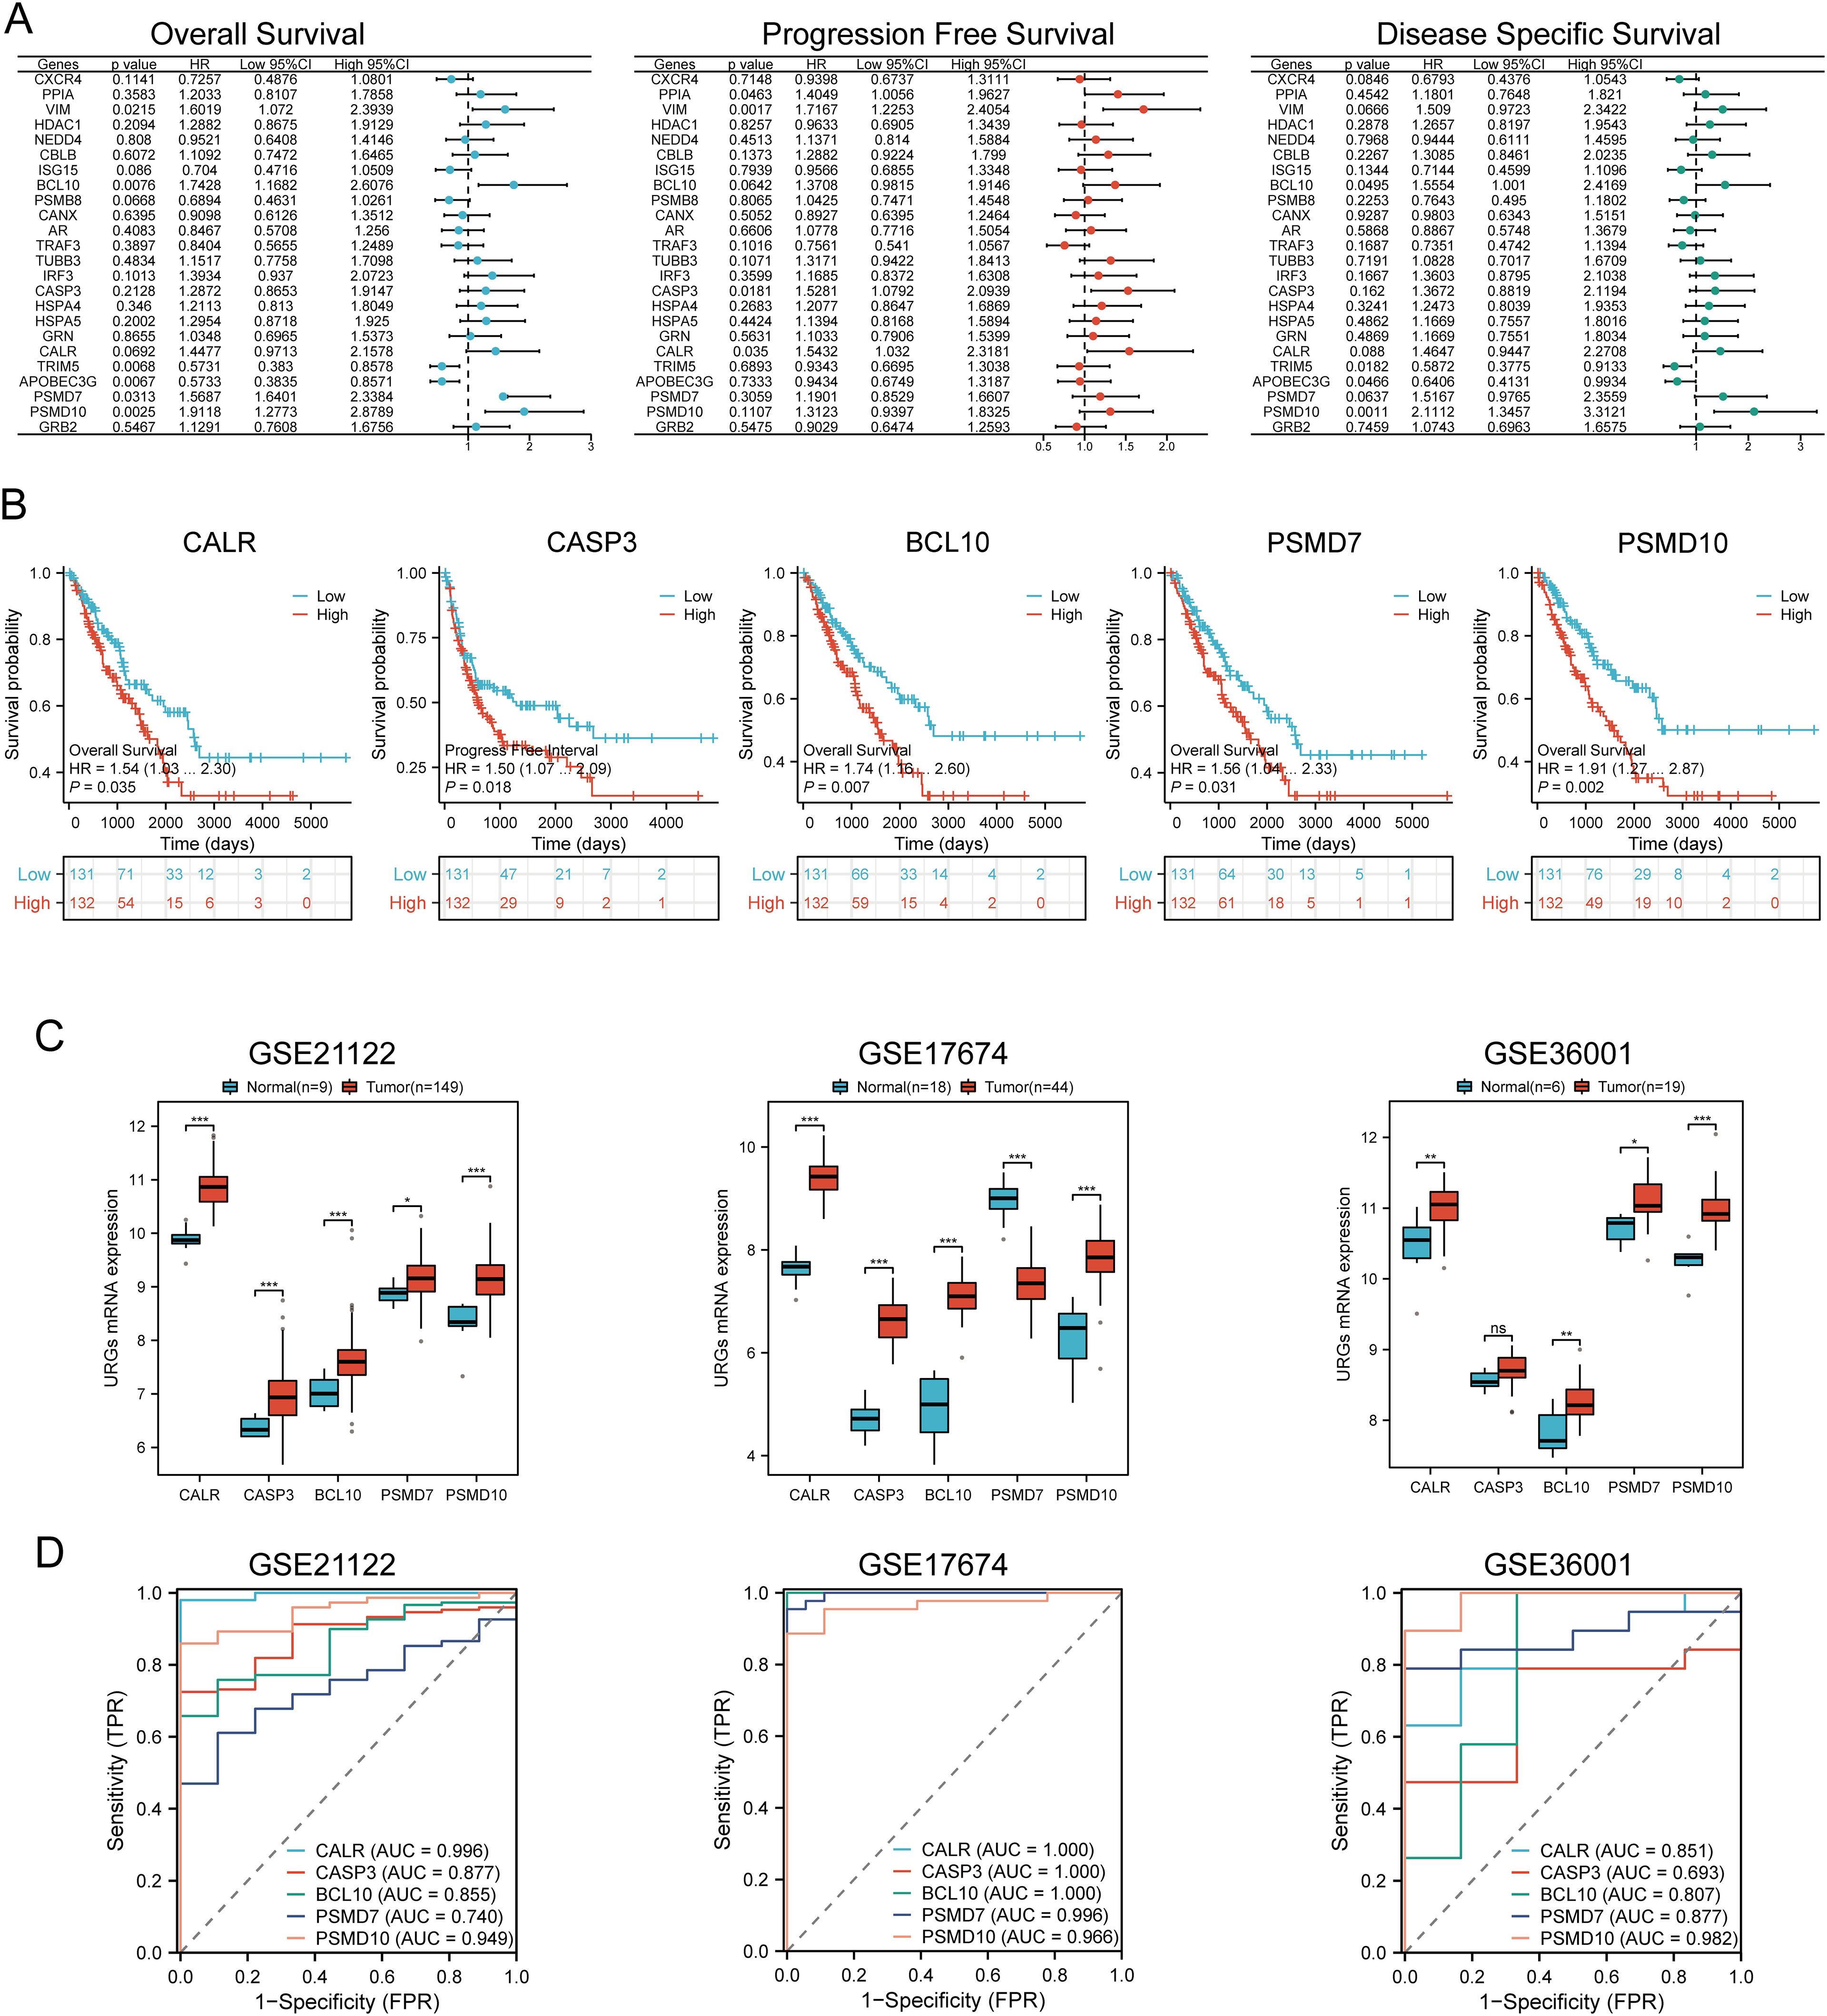
Figure 6. Identification and validation of prognostic URGs in SARC. (A) Univariate Cox regression analysis of prognostic URGs for OS, PFS, and DSS; (B) Survival curves of high and low expression groups of prognostic URGs; (C, D) mRNA expression of prognostic URGs and ROC curves to evaluate their diagnostic ability in SARC datasets. *p < 0.05, **p < 0.01, ***p < 0.001.
3.6 Prognostic model constructionBased on the expression profiles of potential prognostic biomarkers, a prognostic model for sarcoma (SARC) patients was constructed using LASSO Cox regression analysis, selecting Lambda.min to produce the model with higher accuracy (Figures 7A, B). The risk score for overall survival (OS) in SARC patients was calculated using the formula: Riskscore=(0.3239)×CALR+(−0.1553)×CASP3+(0.2845)×BCL10+(−0.1792)×PSMD7+(0.5715)×PSMD10. SARC patients were divided into two groups based on their risk scores. Higher risk scores correlated with increased mortality risk and decreased survival time (Figure 7C). Kaplan-Meier curves indicated that patients with high-risk scores had significantly lower OS compared to low-risk patients (median survival: 4.2 years vs. 7.2 years, log-rank p = 0.000415, HR = 2.09 (1.388-3.148)) (Figure 7D). The 1-year, 3-year, and 5-year ROC curves had AUCs of 0.651, 0.642, and 0.681, respectively (Figure 7E). The same analysis was conducted for progression-free survival (PFS) and disease-specific survival (DSS). The PFS risk score formula was: Riskscore=(0.3954)×CALR+(0.0999)×CASP3+(0.144)×BCL10+(−0.2606)×PSMD7+(0.2986)×PSMD10. Higher risk scores were associated with shorter PFS (median survival: 1.3 years vs. 5 years, log-rank p = 0.000354, HR = 1.859 (1.323-2.611)), with 1-year, 3-year, and 5-year ROC AUCs of 0.634, 0.7, and 0.664, respectively (Supplementary Figure 1A). For DSS, the risk score formula was:
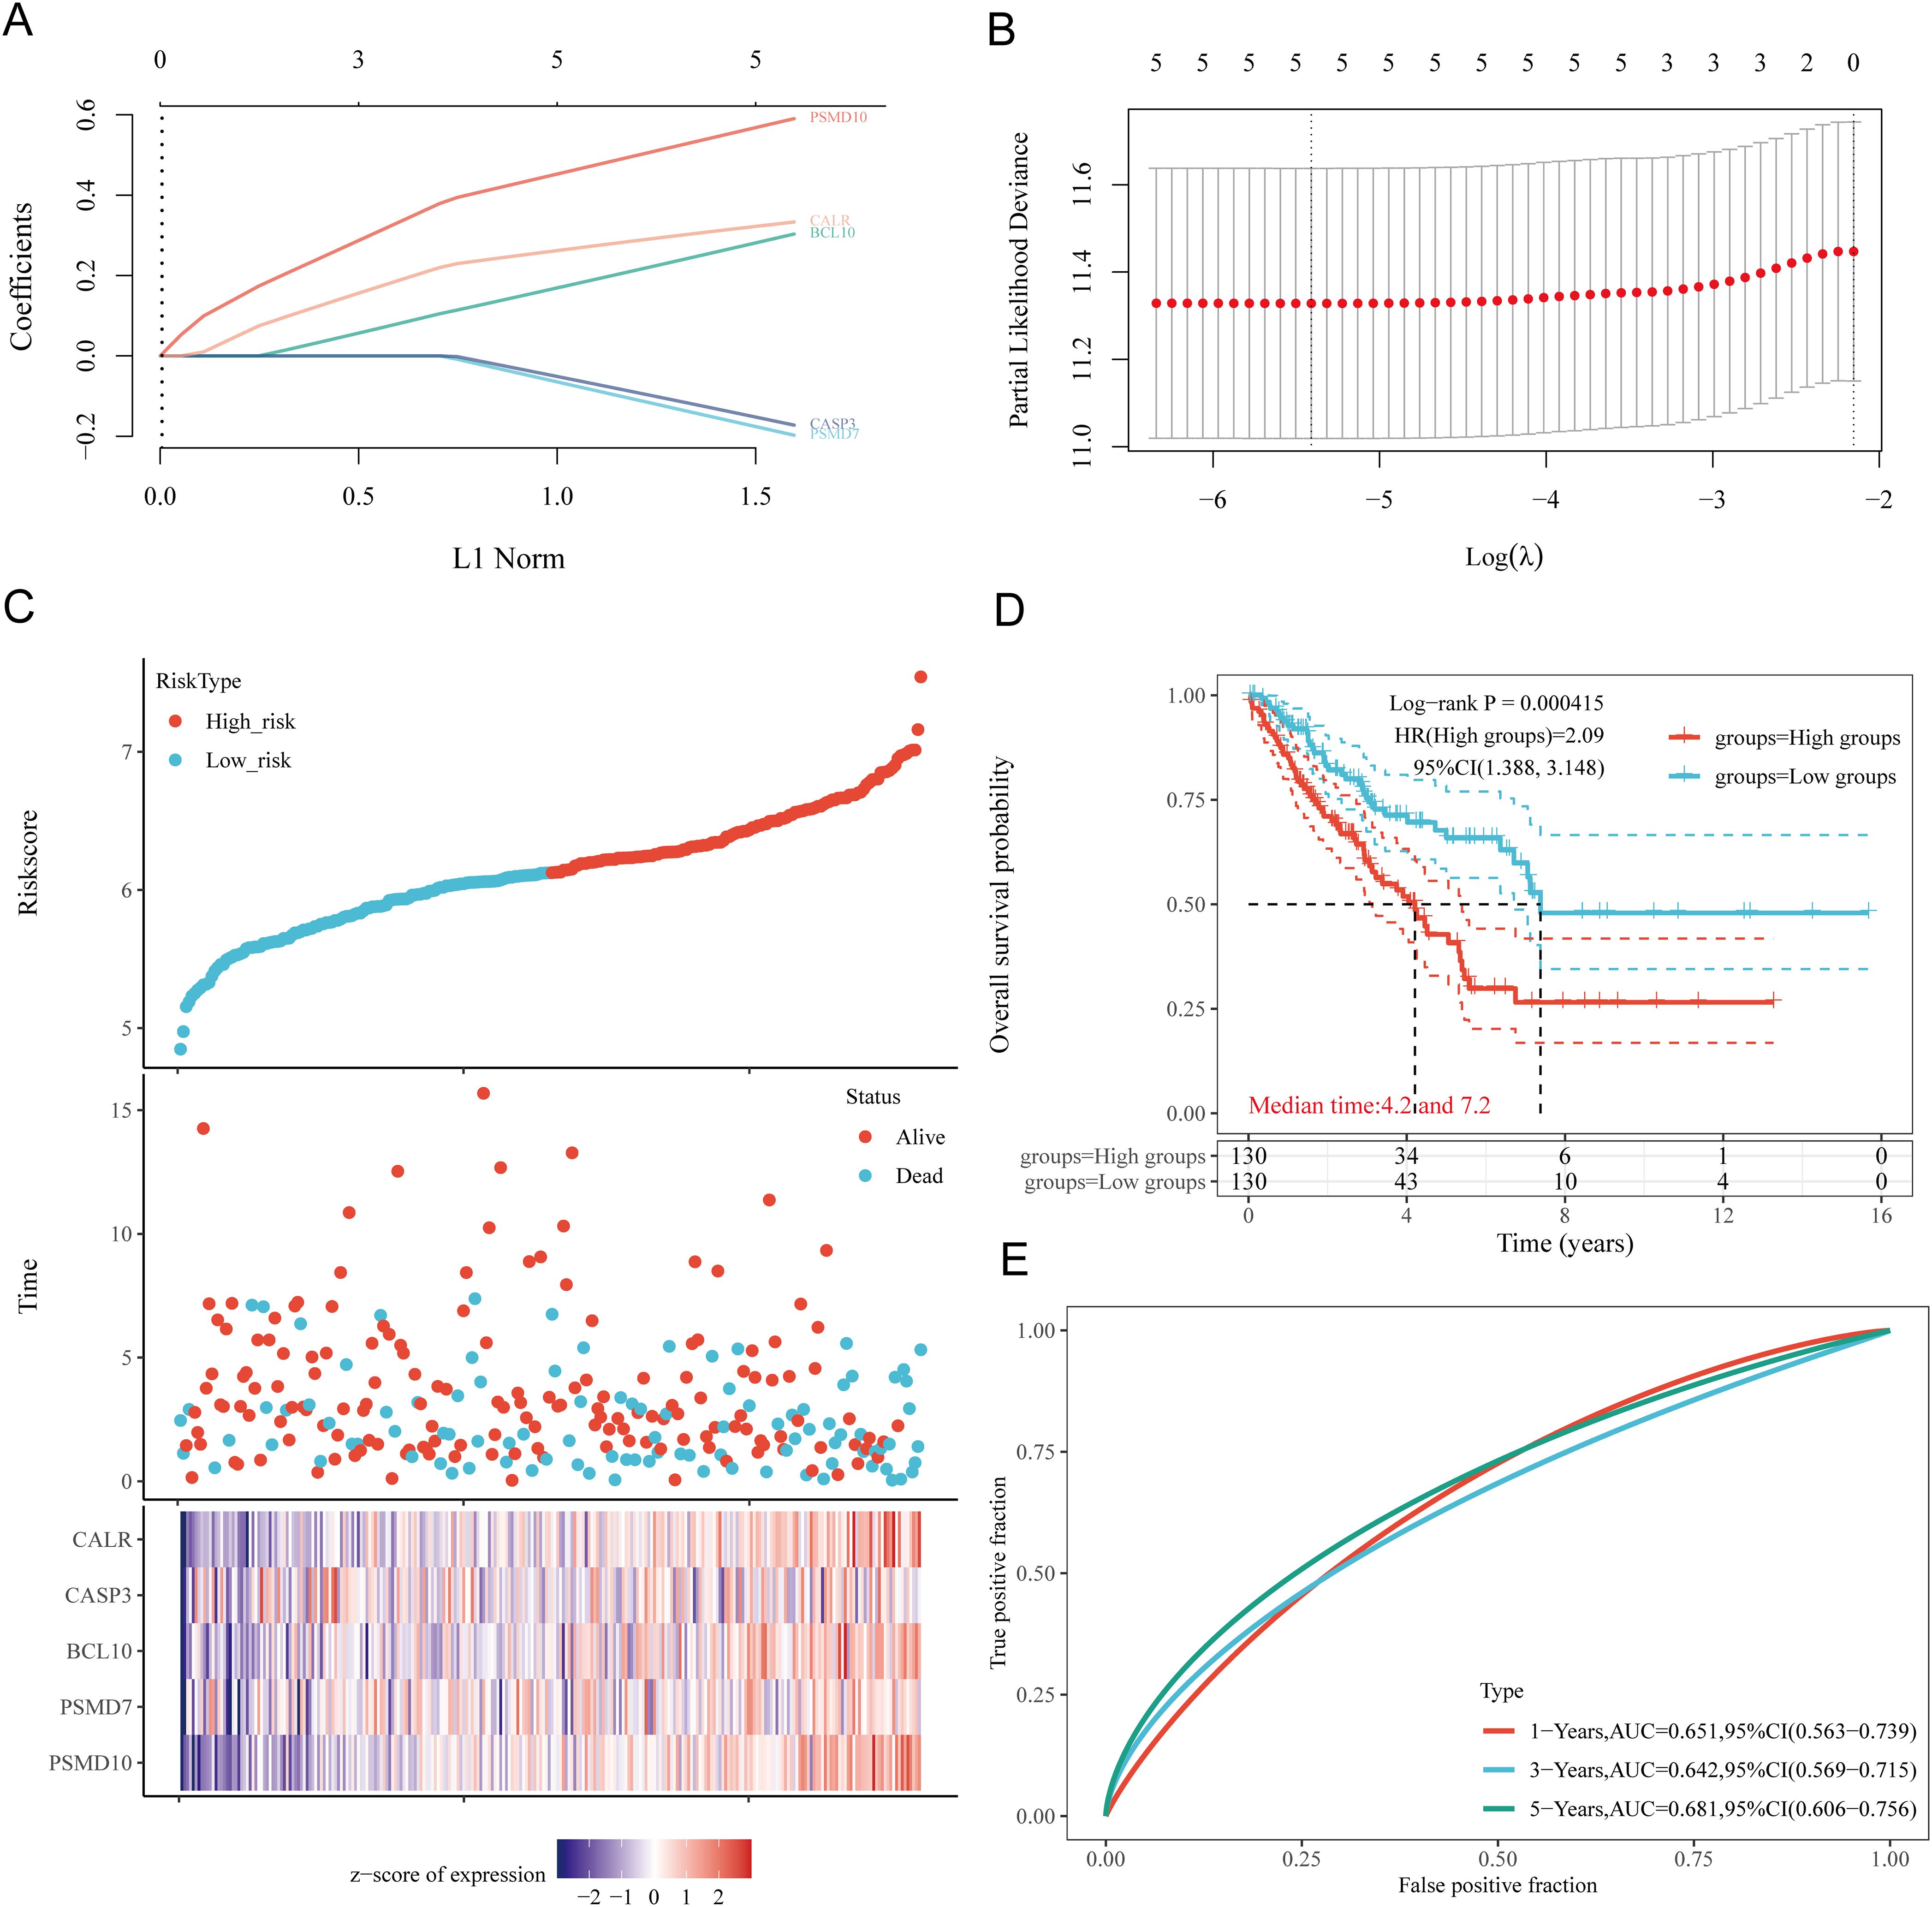
Figure 7. Construction of prognostic model based on URGs in SARC tissues. (A) LASSO coefficient curves of 5 URGs; (B) Ten-fold cross-validation error rate plot; (C) Risk score plot for each SARC patient and distribution of survival time and expression of 5 URGs; (D) Overall survival curves for high/low-risk groups of SARC patients; (E) Time-dependent ROC curves for OS at 1, 3, and 5 years.
Riskscore=(0.3292)×CALR+(0.1625)×BCL10+(−0.2173)×PSMD7+(0.6185)×PSMD10. Patients with high risk scores had worse DSS (median survival: 4.2 years, log-rank p = 3.76e-05, HR = 2.632 (1.661-4.169)). The 1-year, 3-year, and 5-year ROC AUCs were 0.668, 0.648, and 0.682, respectively (Supplementary Figure 1B). Thus, our URG-related risk characteristics are significantly associated with SARC patient survival.
3.7 Internal and external validation of the URGs prognostic signatureTo verify the predictive value of the five gene characteristics, we divided the entire TCGA dataset into validation sets. We found that URGs exhibited a high predictive accuracy for overall survival (OS) in both TCGA Validation Set 1 and TCGA Validation Set 2. Risk scores were calculated for each patient in TCGA Validation Sets 1 and 2, and patients were categorized into low-risk and high-risk groups based on the median score. The distribution of risk scores, survival time, and URGs expression for each SARC patient is illustrated in Supplementary Figures 2A, B. In the validation sets, patients in the high-risk group had significantly poorer OS compared to those in the low-risk group (Supplementary Figures 2C, D). Finally, the one-year, three-year, and five-year survival AUCs for TCGA Validation Set 1 were 0.676, 0.655, and 0.698, respectively (Supplementary Figure 2E), while the AUCs for Validation Set 2 were 0.633, 0.614, and 0.661, respectively (Supplementary Figure 2F). Then, the GSE21257, GSE17674, and GSE16091 datasets were used as external validation cohorts. Risk scores were calculated for each patient using the same formula, yielding results consistent with the TCGA cohort. Risk score distribution, survival time, and URGs expression for each SARC patient were visualized (Supplementary Figures 2G–I). In the validation set, patients in the high-risk group had significantly worse OS than those in the low-risk group (p = 0.040, p = 0.013, and p = 0.041) (Supplementary Figures 2J–L). The AUCs for 1-year, 3-year, and 5-year OS were 0.658, 0.654, and 0.679 in the GSE21257 dataset, 0.628, 0.730, and 0.763 in the GSE17674 dataset, and 0.829, 0.587, and 0.424 in the GSE16091 dataset, respectively (Supplementary Figures 2M–O). These results confirm the effectiveness of our risk scoring model in predicting SARC patient survival.
3.8 Construction of predictive nomogramWe constructed a predictive nomogram to estimate survival probability. Univariate and multivariate regression analyses identified age and race as independent prognostic factors for SARC patients (Figures 8A, B). The nomogram’s predictions for 1-year, 3-year, and 5-year OS showed a good fit with the actual outcomes in the entire cohort, with a C-index of 0.625 (0.536-1), p = 0.006 for OS and 0.62 (0.527-1), p = 0.012 for DSS (Figures 8C, D, Supplementary Figure 3).
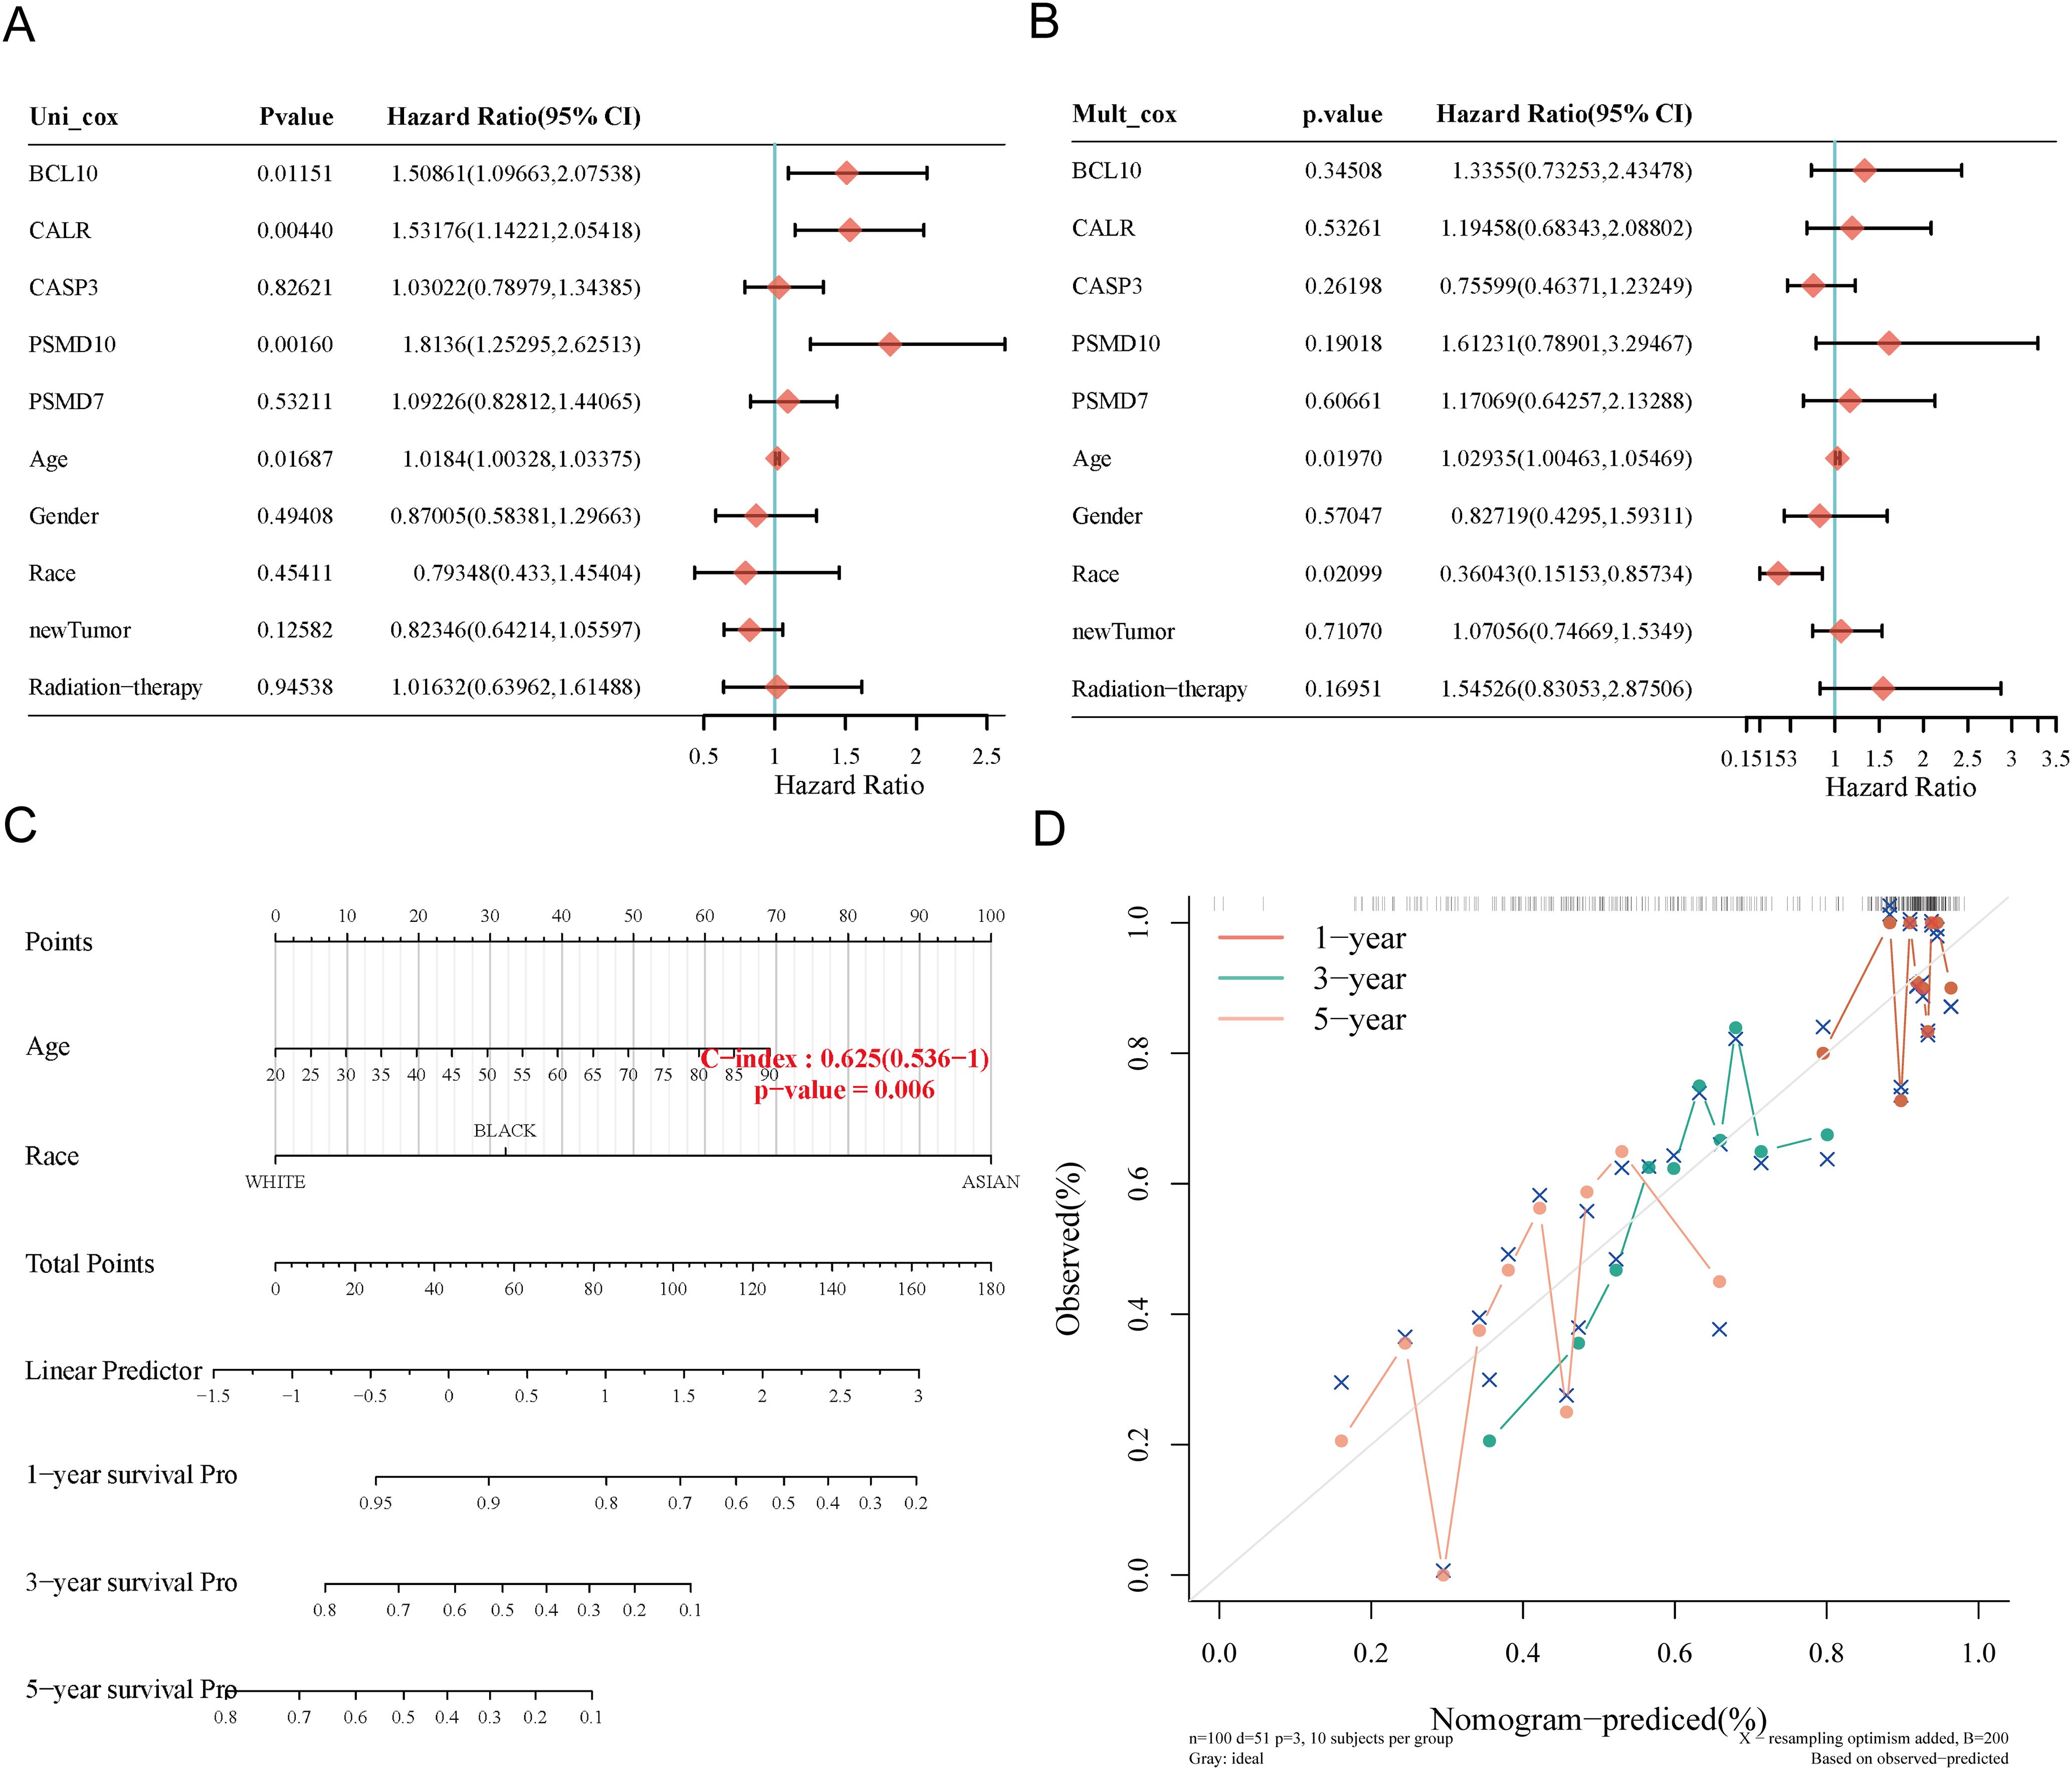
Figure 8. Construction of prognostic nomogram for OS. (A, B) Univariate and multivariate Cox regression analysis of clinicopathological features and URGs for OS; (C) Nomogram for predicting 1-, 3-, and 5-year OS of SARC patients; (D) Calibration curve of OS nomogram model in the discovery group.
3.9 Correlation of risk score with clinicopathological characteristicsWe explored the correlation between high and low-risk groups and clinicopathological characteristics (Supplementary Table 6). Subgroup survival analysis indicated that high-risk significantly impacted survival in patients older than 60 years (P < 0.001), male patients (P < 0.001), white patients (P = 0.002), those with metastasis (P = 0.044), no radiation treatment (P < 0.001), those receiving chemotherapy and hormone therapy (P < 0.001), and those without neoadjuvant treatment (P < 0.001). However, no significant correlation was found in females (P = 0.083), patients aged ≤60 (P = 0.174), Asian+Black patients (P = 0.088), primary+recurrence cases (P = 0.325), and those receiving radiation (P = 0.295) (Supplementary Figures 6A–L).
3.10 Immune cell infiltration analysisUsing six algorithms, we observed differences in immune cell infiltration between SARC subtypes C1 and C2. The CIBERSORT algorithm indicated significant differences in T cell gamma delta, NK cell activated, T cell CD8+, T cell follicular helper, macrophage M2, T cell CD4+ memory resting, T cell regulatory (Tregs), myeloid dendritic cell activated, and B cell memory (Figure 9A). Other algorithms (TIMER, xCell, MCP-counter, quanTIseq, EPIC) also showed significant differences in immune infiltration scores between the subtypes (Supplementary Figures 4A–E). Correlation analysis between risk scores and immunological scores using the quanTIseq algorithm revealed significant associations with various immune cell populations. Risk scores were negatively correlated with B cells (p = 0.003, cor = -0.186), monocytes (p = 0.015, cor = -0.151), and positively correlated with neutrophils (p < 0.001, cor = 0.269) and uncharacterized cells (p = 0.032, cor = 0.133) (Figure 9B, Supplementary Figures 5A–E). The ssGSEA method showed significant differences in immune cell infiltration between high and low expression groups of CALR, CASP3, BCL10, PSMD7, and PSMD10 (Supplementary Figure 7A). Correlation analysis demonstrated positive correlations between CALR and TFH, macrophages, neutrophils, and Th2 cells, and negative correlations with pDC, NK cells, Tgd, mast cells, cytotoxic cells, and B cells. Similar patterns were observed for the other URGs (Supplementary Figure 7B). Further analysis of the correlation between risk scores and three ESTIMATE scores indicated significant negative correlations between risk scores and ImmuneScore (P = 0.001, Cor = -0.197), StromalScore (P = 0.005, Cor = -0.175), and ESTIMATE scores (P = 0.004, Cor = -0.180) (Figure 9C). Low ImmuneScore and ESTIMATE scores were associated with poor prognosis (Figure 9D), suggesting a correlation between URGs and tumor immune infiltration.
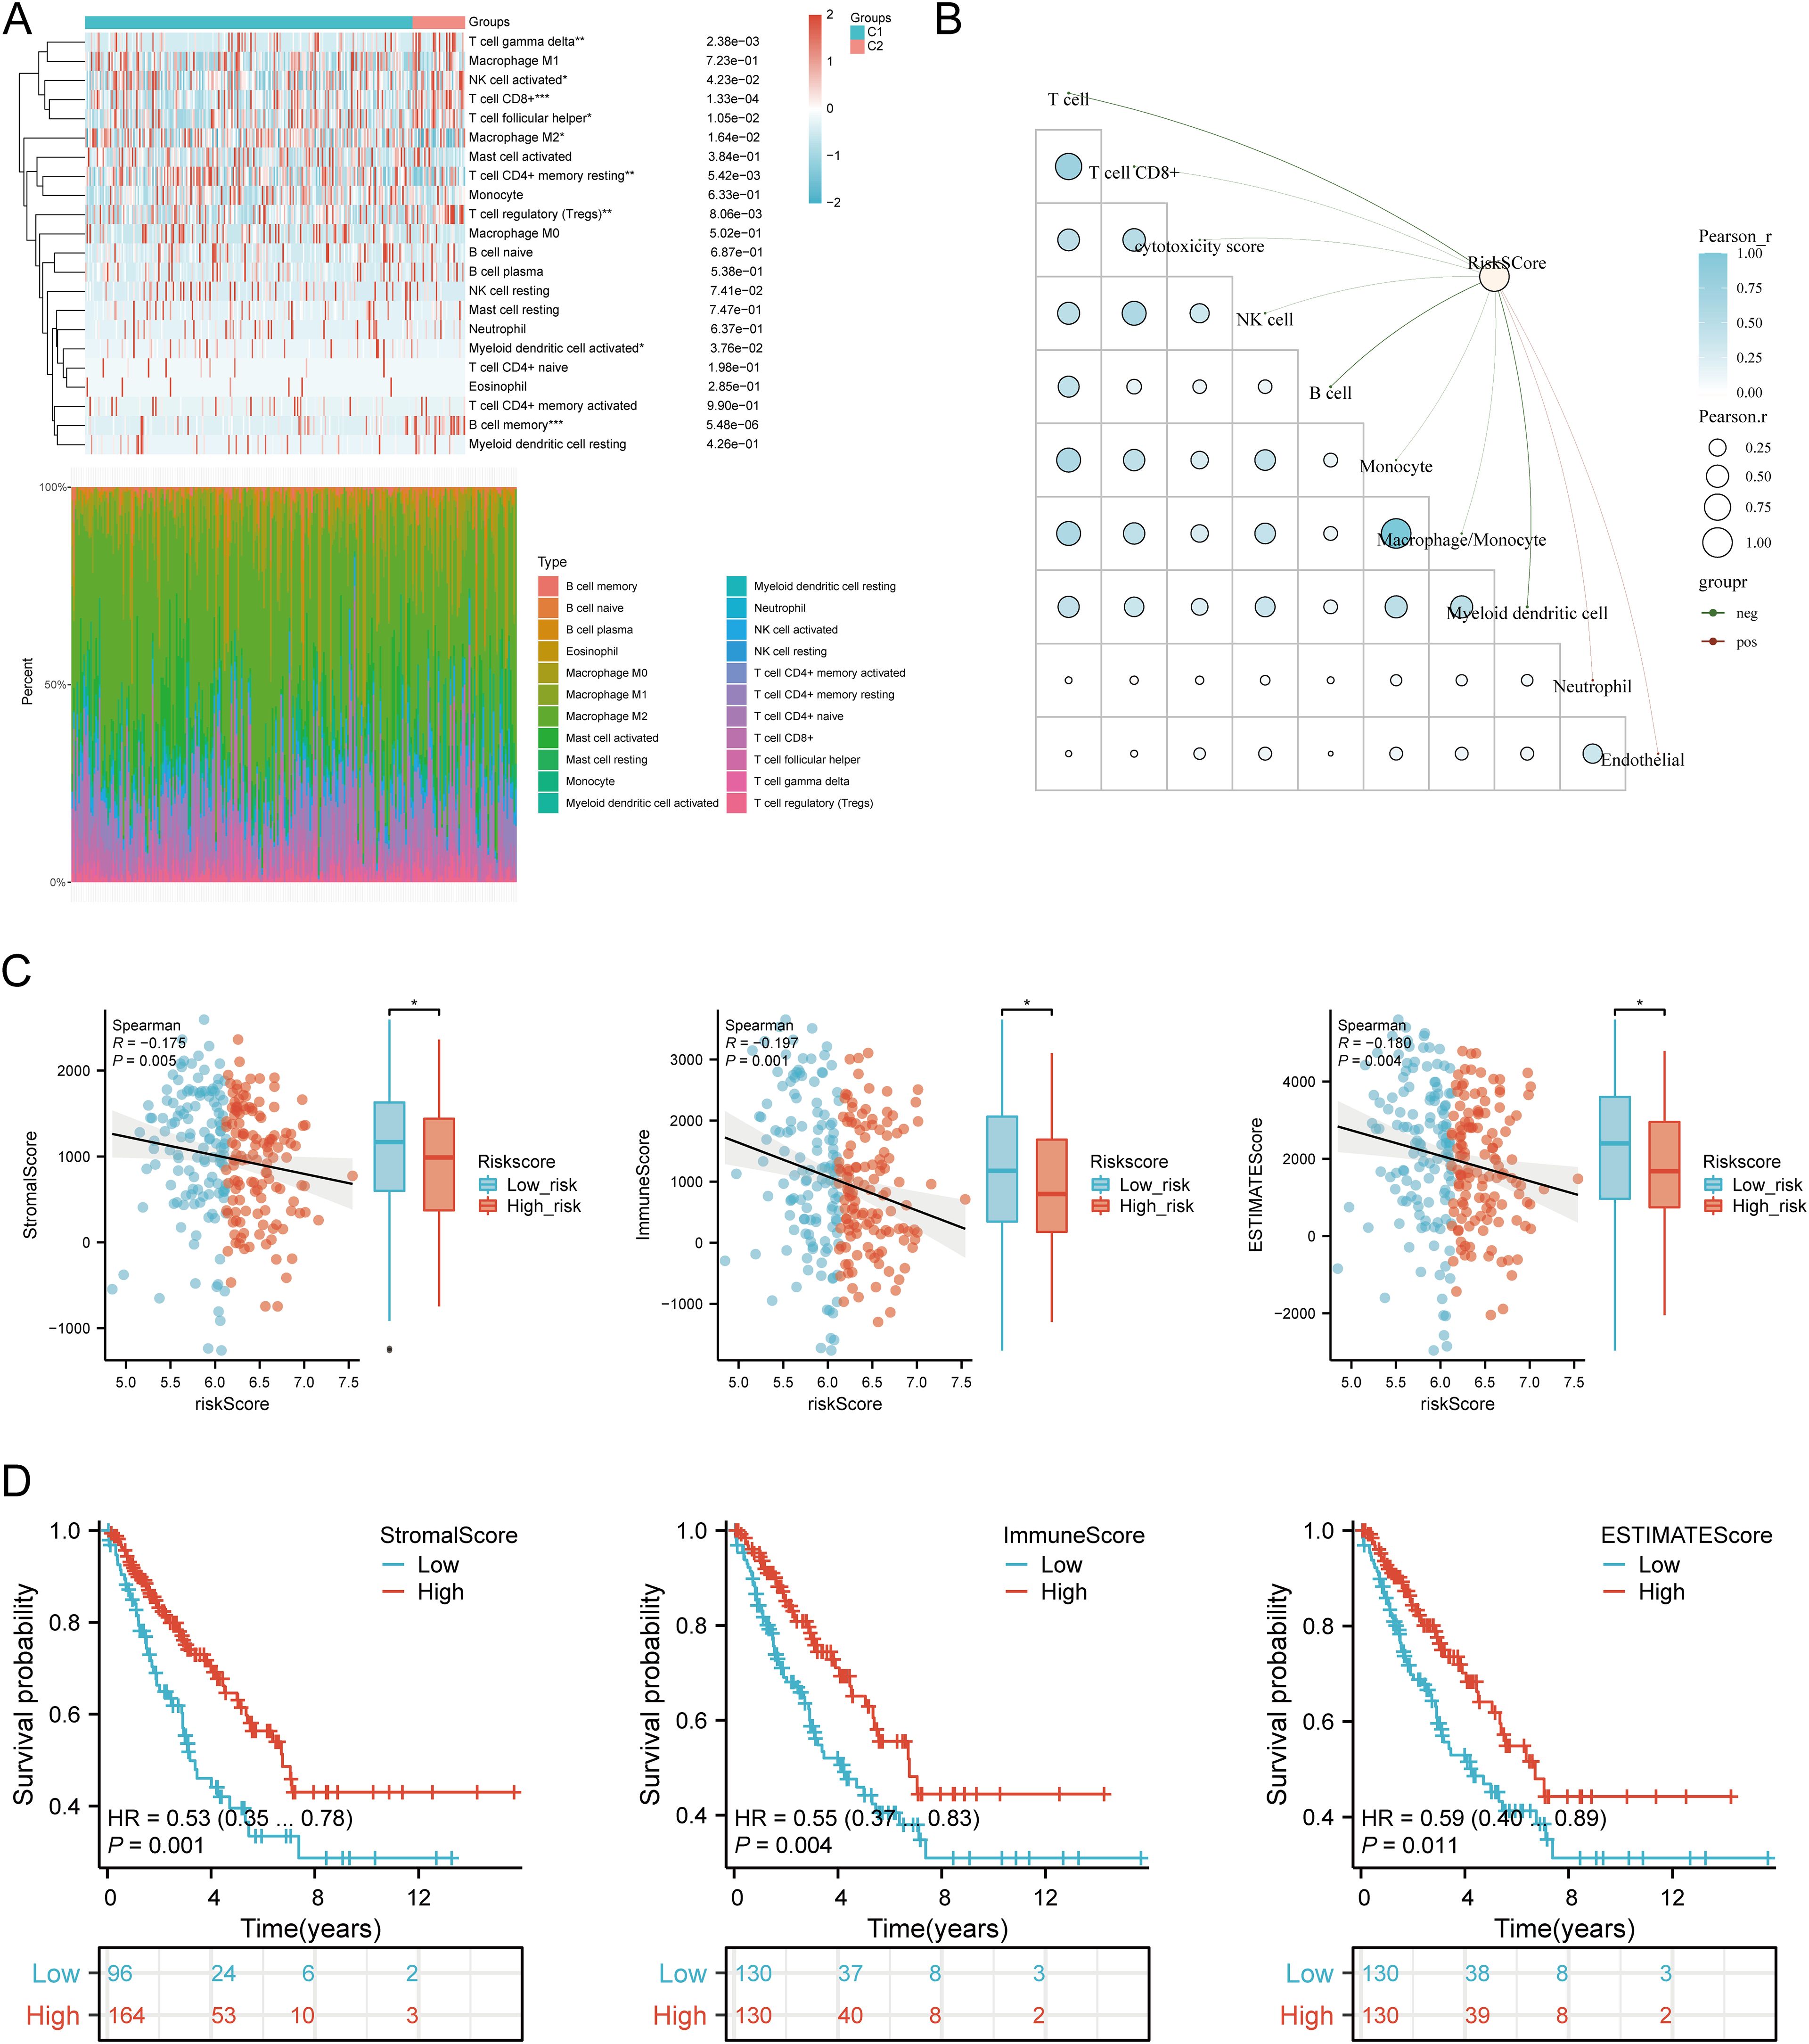
Figure 9. Relationship between URGs expression levels in tumor microenvironment and immune infiltration. (A) Comparison of immune scores between C1 and C2 subtypes in TCGA; (B) Correlation analysis between Riskscore and Immunocore; (C) Correlation between Riskscore and three ESTIMATE; (D) Kaplan-Meier curves of high and low ESTIMATE groups in SARC. *p < 0.05, **p < 0.01, ***p < 0.001.
3.11 Immunotherapy response analysisWe analyzed differences in the expression of eight immune checkpoint-related genes between the two subtypes. Results showed that CTLA4 (P < 0.05), LAG3 (P < 0.001), and PDCD1 (P < 0.001) were significantly higher in the C2 subtype compared to the C1 subtype (Figure 10A). Additionally, HLA members (HLA-A, HLA-DMA, HLA-DMB, HLA-DOB, HLA-DPB1, HLA-DRB1, HLA-E, and HLA-F) were more highly expressed in the C2 group compared to the C1 group (Figure 10B). Further analysis revealed significant positive correlations between prognostic URGs and several immune checkpoints and HLA members (Figures 10C, D). CALR correlated positively with HAVCR2 (P = 0.00841, cor = 0.162) and SIGLEC15 (P = 0.000217, cor = 0.226). CASP3 showed positive correlations with PDCD1LG2 (P = 0.01107, cor = 0.156) and SIGLEC15 (P = 0.00111, cor = 0.200). BCL10 correlated positively with CD274 (P = 0.0424, cor = 0.125), CTLA4 (P = 0.00354, cor = 0.179), HAVCR2 (P = 1.12e-08, cor = 0.343), PDCD1LG2 (P = 0.000496, cor = 0.213), TIGIT (P = 8.59e-05, cor = 0.24), and SIGLEC15 (P = 3.54e-08, cor = 0.332). PSMD7 correlated positively with CD274 (P = 0.0143, cor = 0.151), CTLA4 (P = 0.0129, cor = 0.153), PDCD1LG2 (P = 0.0366, cor = 0.129), and SIGLEC15 (P = 5.14e-06, cor = 0.277). PSMD10 showed negative correlations with PDCD1 (P = 0.00751, cor = -0.164) and HAVCR2 (P = 0.00209, cor = -0.189). Additionally, URGs expression correlated positively with most HLA members in SARC (Figure 10D). Using the TIDE database and GSE91061, IMvigor210 datasets, we predicted URGs’ response to immunotherapy. C2 subtype had a better response to immune checkpoint blockade compared to the C1 subtype (Figure 10E). High-risk score patients showed higher predicted response rates to immunotherapy than low-risk score patients (Figure 10F). The high-risk group responded better to immune checkpoint blocking than the low-risk group (Figure 10G). TIDE Dysfunction scores were higher in the low-risk group (Figure 10H), and TIDE Exclusion scores were lower in the low-risk group (Figure 10I). Kaplan-Meier analysis showed that higher TIDE scores were significantly correlated with poorer overall survival (Figure 10J). In the GSE91061 and IMvigor210 datasets, URGs accurately predicted immune therapy response with AUC values of 0.711 and 0.615, respectively (Figures 10K, L). High-risk patients in the GSE91061 cohort had worse overall survival compared to low-risk patients (p = 0.046, HR = 0.60 [0.36 - 0.99]) (Figure 10M). Validation in 32 advanced sarcoma patients treated with anti-PD-1/PD-L1 showed that high expression of prognostic URGs and high-risk scores correlated with better immunotherapy response. ROC analysis confirmed the predictive efficacy of the risk score (Figures 10N, O). These findings suggest that low-risk score groups are more likely to respond to immunotherapy.
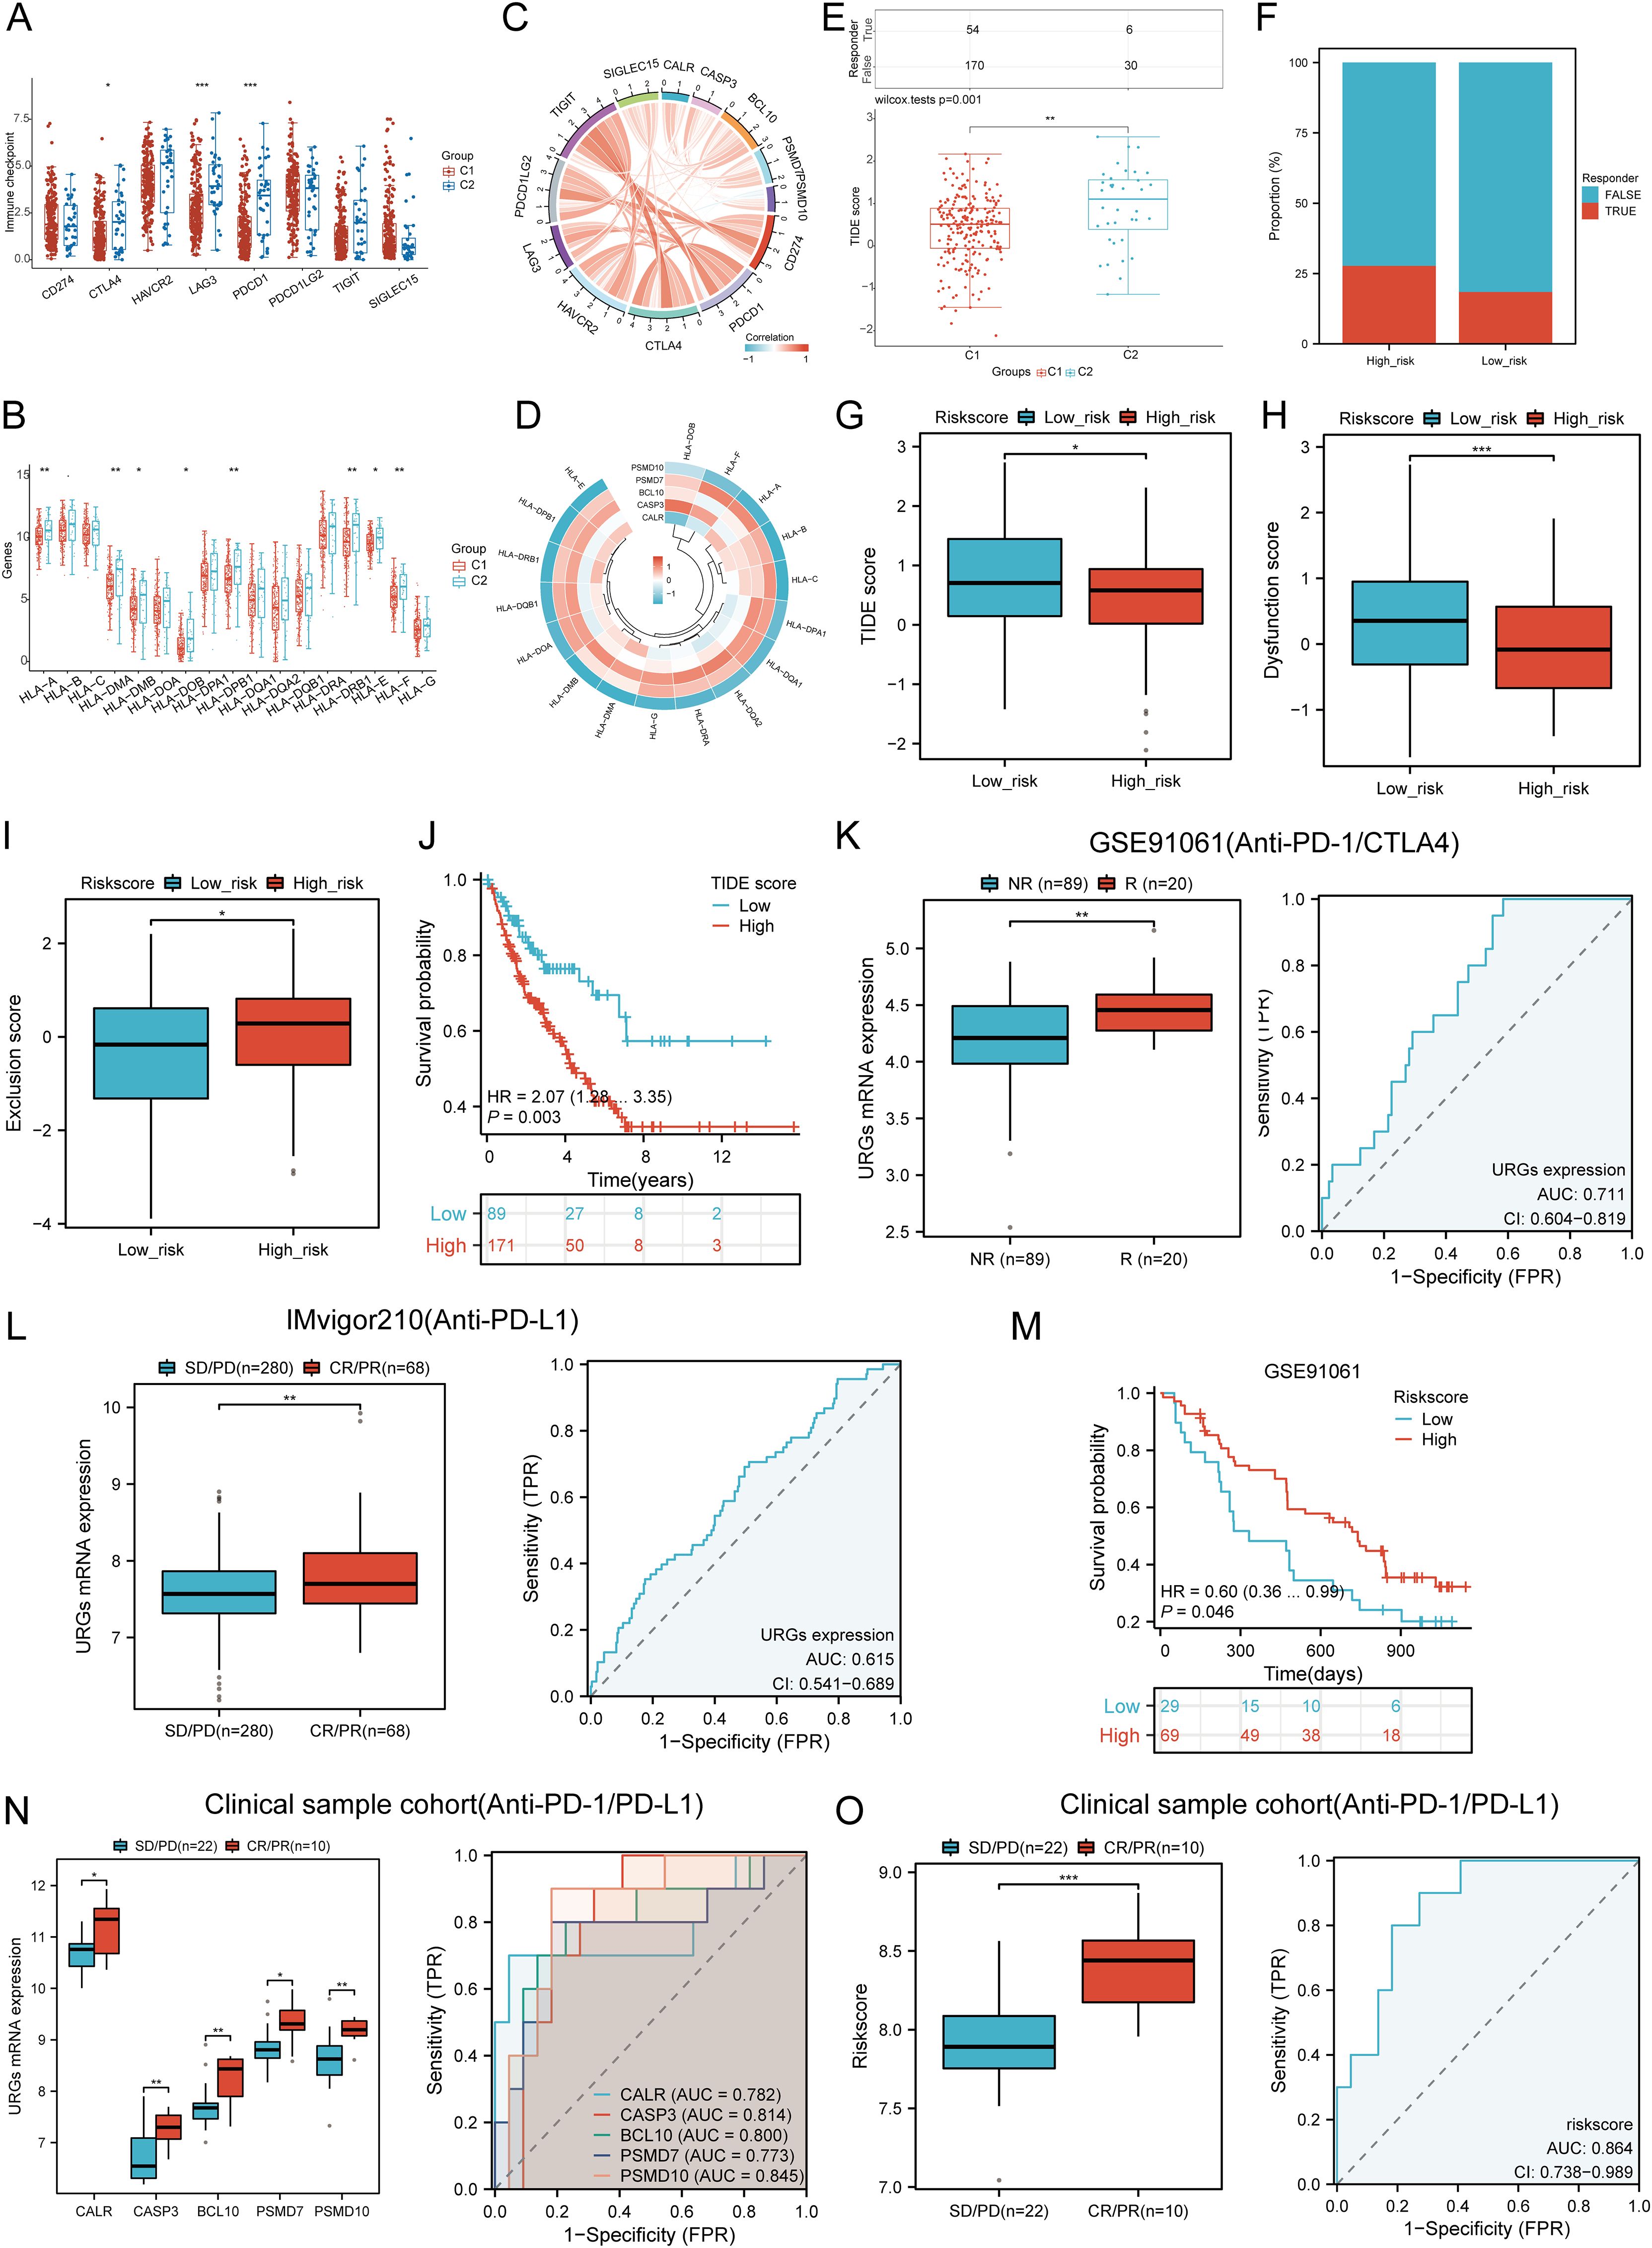
Figure 10. Correlation between expression of prognostic URGs and immunogenicity. (A) Differences in immune checkpoint-related genes in SARC subtypes; (B) Differences in HLA members between C1 and C2 subtypes; (C) Correlation between prognostic URGs in SARC and immune checkpoint-related genes; (D) Association between prognostic URGs and HLA members; (E) Differential responses to immune checkpoint blocking in TIDE score between C1 and C2 subtypes; (F) Prediction of response rates of immunotherapies in patients with URGs high and low riskscore; (G) Differential reactions of URGs high and low riskscore groups to immune checkpoint blocking in TIDE score; (H, I) Differences of URGs high and low riskscore groups in TIDE Dysfunction score and TIDE Exclusion score; (J) Correlation of TIDE scores with prognosis of SARC patients; (K, L) Prediction of immune response and ROC analysis of URGs riskscore for prediction of ICI responsiveness in GSE91061, IMvigor210 dataset; (M) Kaplan-Meier plots of overall survival for high and low risk patients in GSE91061 dataset; (N, O) URGs expression differences and ROC analysis for prediction of ICI responsiveness in clinical tissue samples cohort; Riskscore differences and ROC analysis for prediction of ICI responsiveness in clinical tissue samples cohort. *p < 0.05, **p < 0.01, ***p < 0.001.
3.12 TMB, MSI, and mRNAsi analysisWe assessed the correlation between risk scores and TMB, MSI, ESTIMATE, and mRNAsi scores. High-risk patients had higher TMB, MSI, and mRNAsi scores compared to low-risk groups (Figures 11A, B). Risk scores positively correlated with TMB (R = 0.189, p = 0.003), MSI (R = 0.189, p = 0.002), and mRNAsi (R = 0.184, p = 0.003) (Figure 11B). Survival analysis indicated that high TMB (p = 0.039, HR = 1.77 [1.03 - 3.03]) and MSI scores (p = 0.015, HR = 1.65 [1.10 - 2.47]) were associated with poor OS, but mRNAsi scores were not significantly associated with prognosis (p = 0.163, HR = 1.42 [0.87 - 2.32]) (Figure 11C). Combining risk scores with TMB, MSI, and mRNAsi, we observed that patients with low TMB + low risk score had better OS compared to those with high TMB + high risk score (p = 0.002). Similarly, high MSI + high risk patients had worse prognosis compared to low MSI + low risk patients (p = 0.003), and low mRNAsi + low risk patients had better OS compared to high mRNAsi + high risk patients (p < 0.001) (Figure 11D). These results suggest that high-risk groups are more likely to have an immune response and respond to immunotherapy.
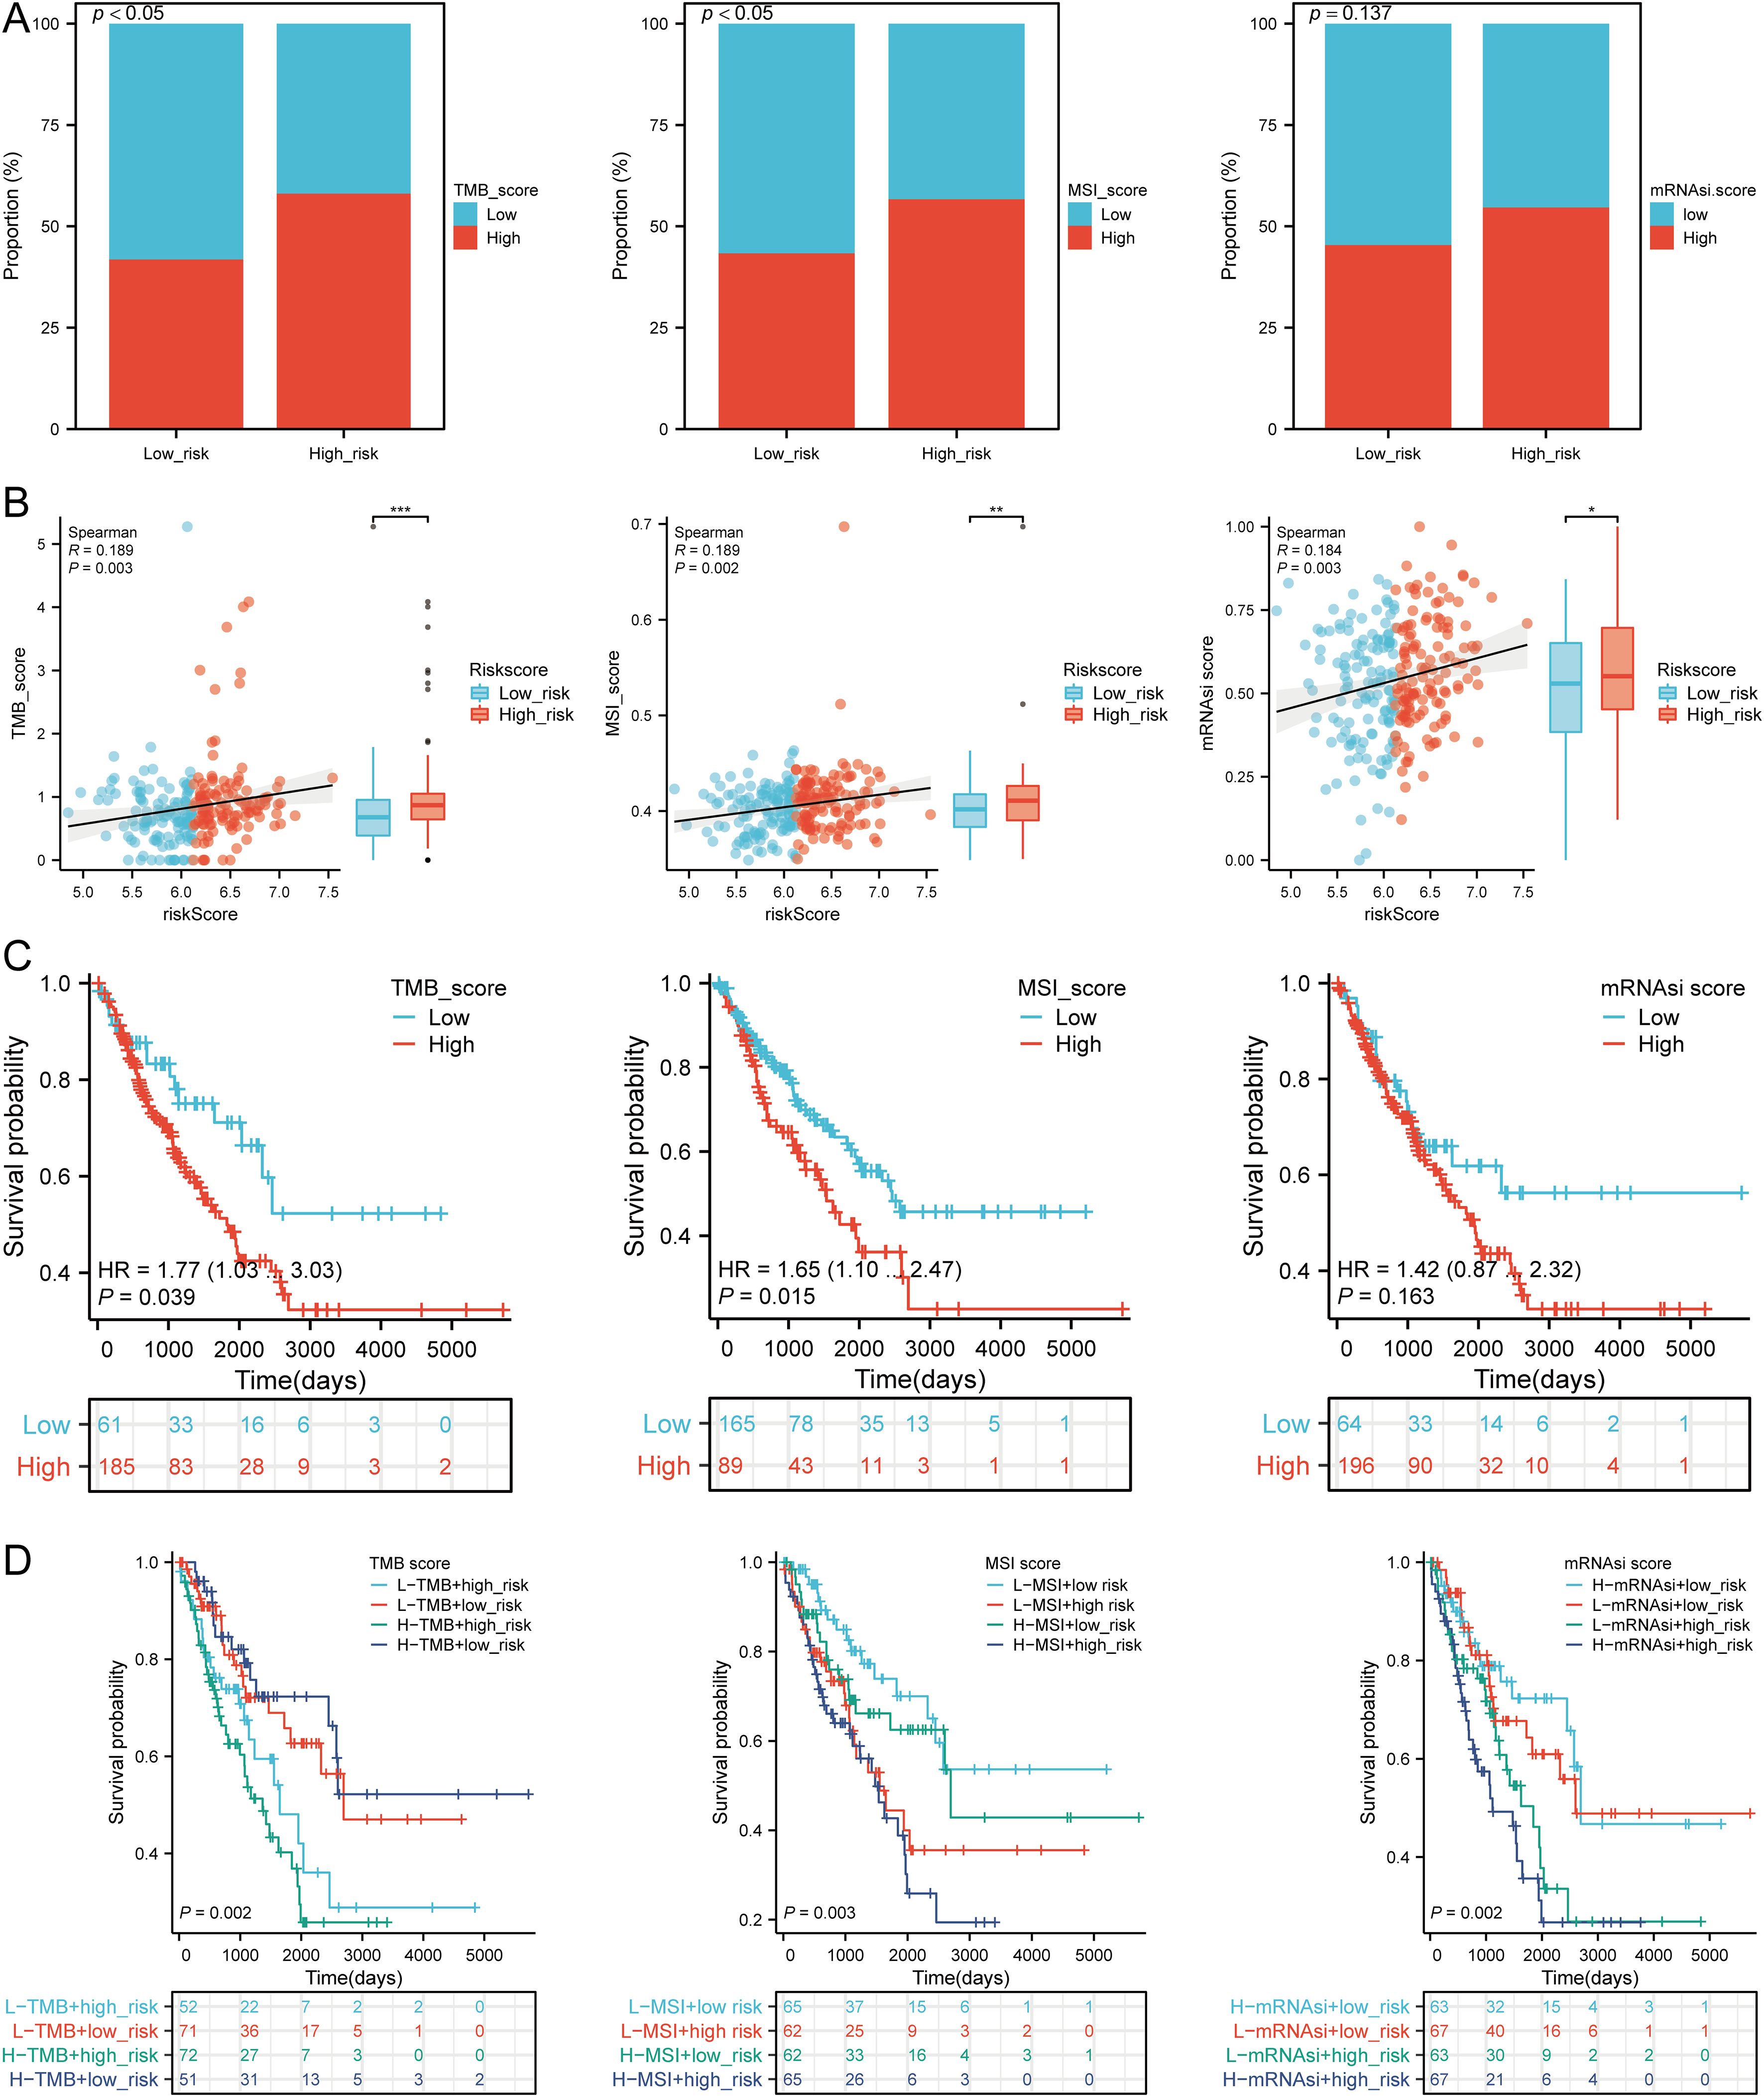
Figure 11. Analysis of TMB, MSI, and mRNAsi. (A) Distributions of patients with TMB, MSI, and mRNAsi scores in high and low risk groups; (B) Correlation between risk scores model and TMB, MSI, mRNAsi; (C) Kaplan-Meier curves of high and low TMB, MSI, mRNAsi groups in SARC; (D) Kaplan-Meier curves of four groups classified by risk score and TMB, MSI, mRNAsi in SARC. *p < 0.05, **p < 0.01, ***p < 0.001.
3.13 Drug sensitivity analysisWe analyzed drug sensitivity using the GDSC and CTRP databases and found significant correlations between risk scores and drug sensitivity (Figures 12A, B). Spearman correlation analysis showed negative correlations between risk scores and the sensitivity to Bleomycin (50 uM), CP466722, Docetaxel, Genentech Cpd 10, GSK1070916, Methotrexate, Navitoclax, TG101348, and Vorinostat (Figure 12C). High-risk SARC showed significantly higher sensitivity to these drugs compared to the low-risk group (Figure 12D). These drugs may be potential therapeutic options for SARC.
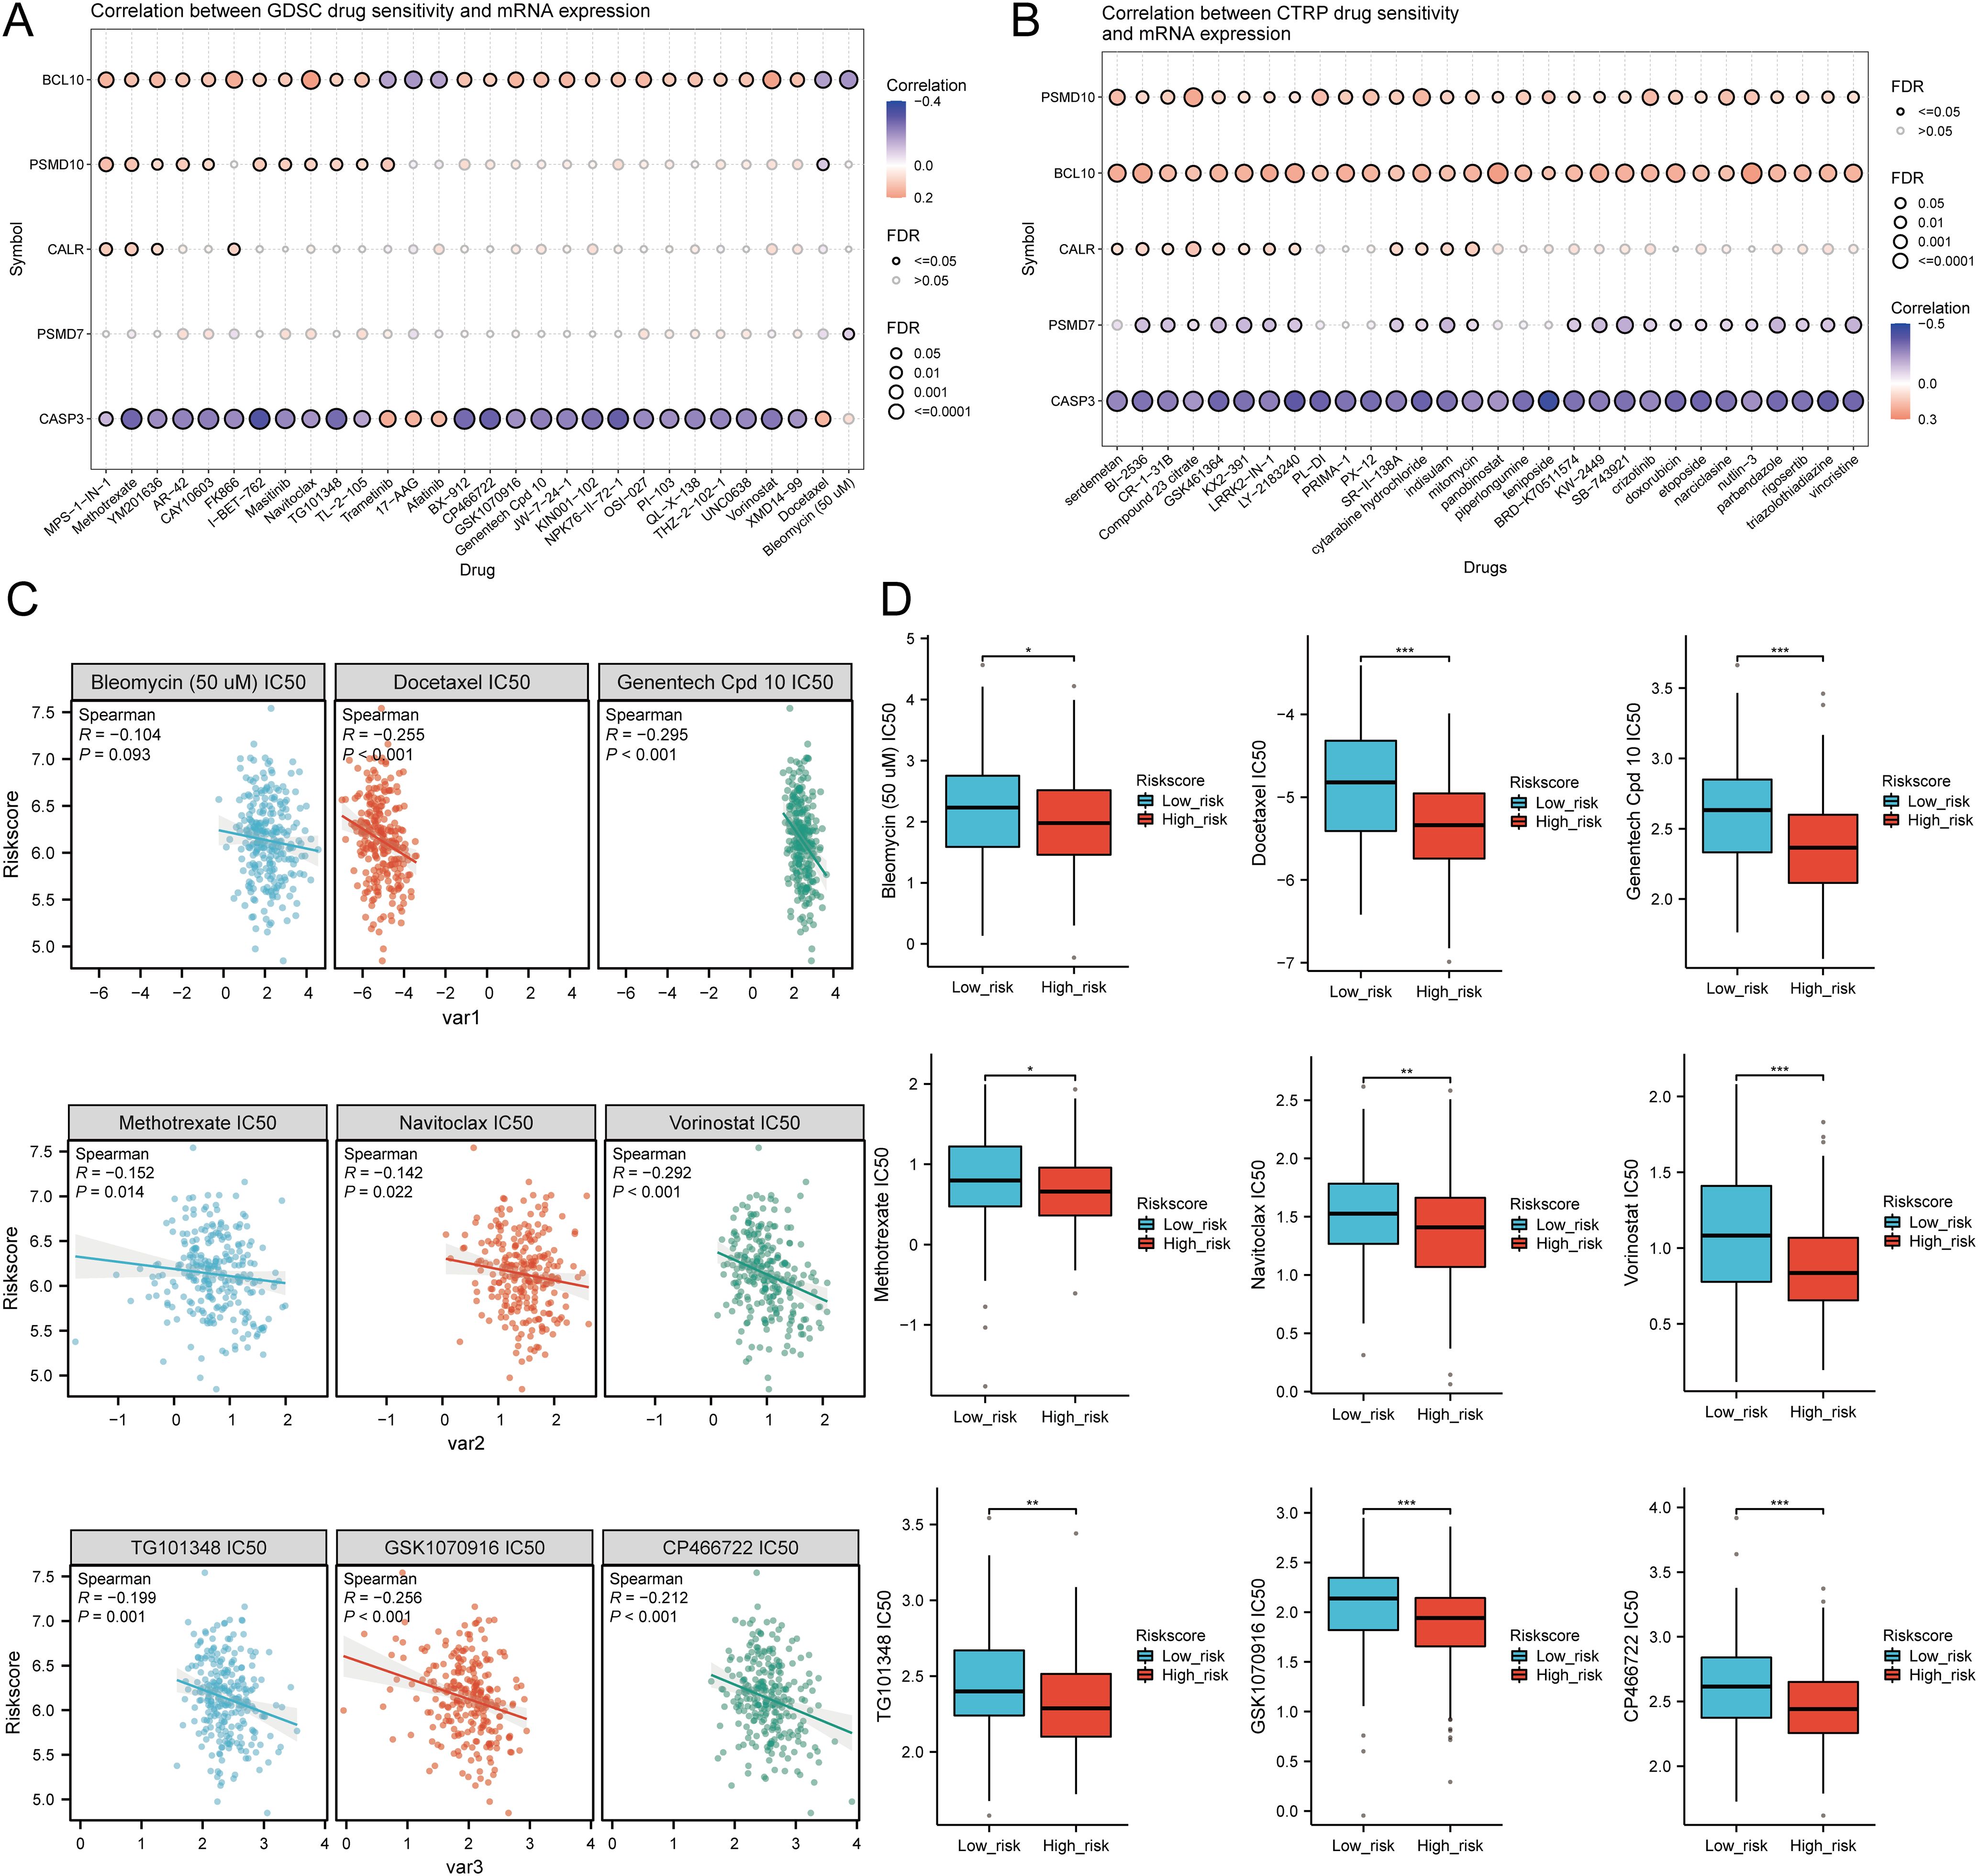
Figure 12. Drug sensitivity analysis. (A, B) Predictive antitumor drugs based on the risk scores model in SARC from the GDSC and CTRP datasets; (C, D) Correlation analysis of IC50 score and risk scores model, and distribution of IC50 scores in the high and low groups. *p < 0.05, **p < 0.01, ***p < 0.001.
3.14 Single-cell RNA data analysisThe tumor microenvironment (TME) consists of extracellular matrix (ECM), cancer-associated fibroblasts (CAFs), myofibroblasts, immune cells, and other factors. Using two GSE datasets (SARC_GSE119352_aPD1aCTLA4), we evaluated the expression of CALR, CASP3, BCL10, PSMD7, and PSMD10 at the single-cell level. The single-cell RNA sequencing analysis annotated various immune cells, including Conventional CD4 T cells (CD4Tconv), proliferating T cells (Tprolif), CD8 T cells (CD8T), Natural killer cells (NK), Dendritic cells (DC), Monocytes/Macrophages (Mono/Macro), and Fibroblasts (Figures 13A, B). Prognostic URGs were expressed in all immune cells, with the highest expression in Fibroblasts, followed by Tprolif, Mono/Macro, and DC (Figure 13C). We further explored the relationship between URGs and cancer-associated fibroblasts (CAFs), tumor-associated macrophages (TAMs), and their biomarkers, finding extensive correlations (Figures 13D, E). Additionally, we analyzed the impact of URGs expression on EMT by examining correlations with EMT-related markers (SNAI1, SNAI2, TWIST1, CDH2, VIM, MMP2, MMP9, MMP3), revealing significant associations (Figure 13F). These results suggest that URGs-mediated EMT may be related to fibroblast activation.
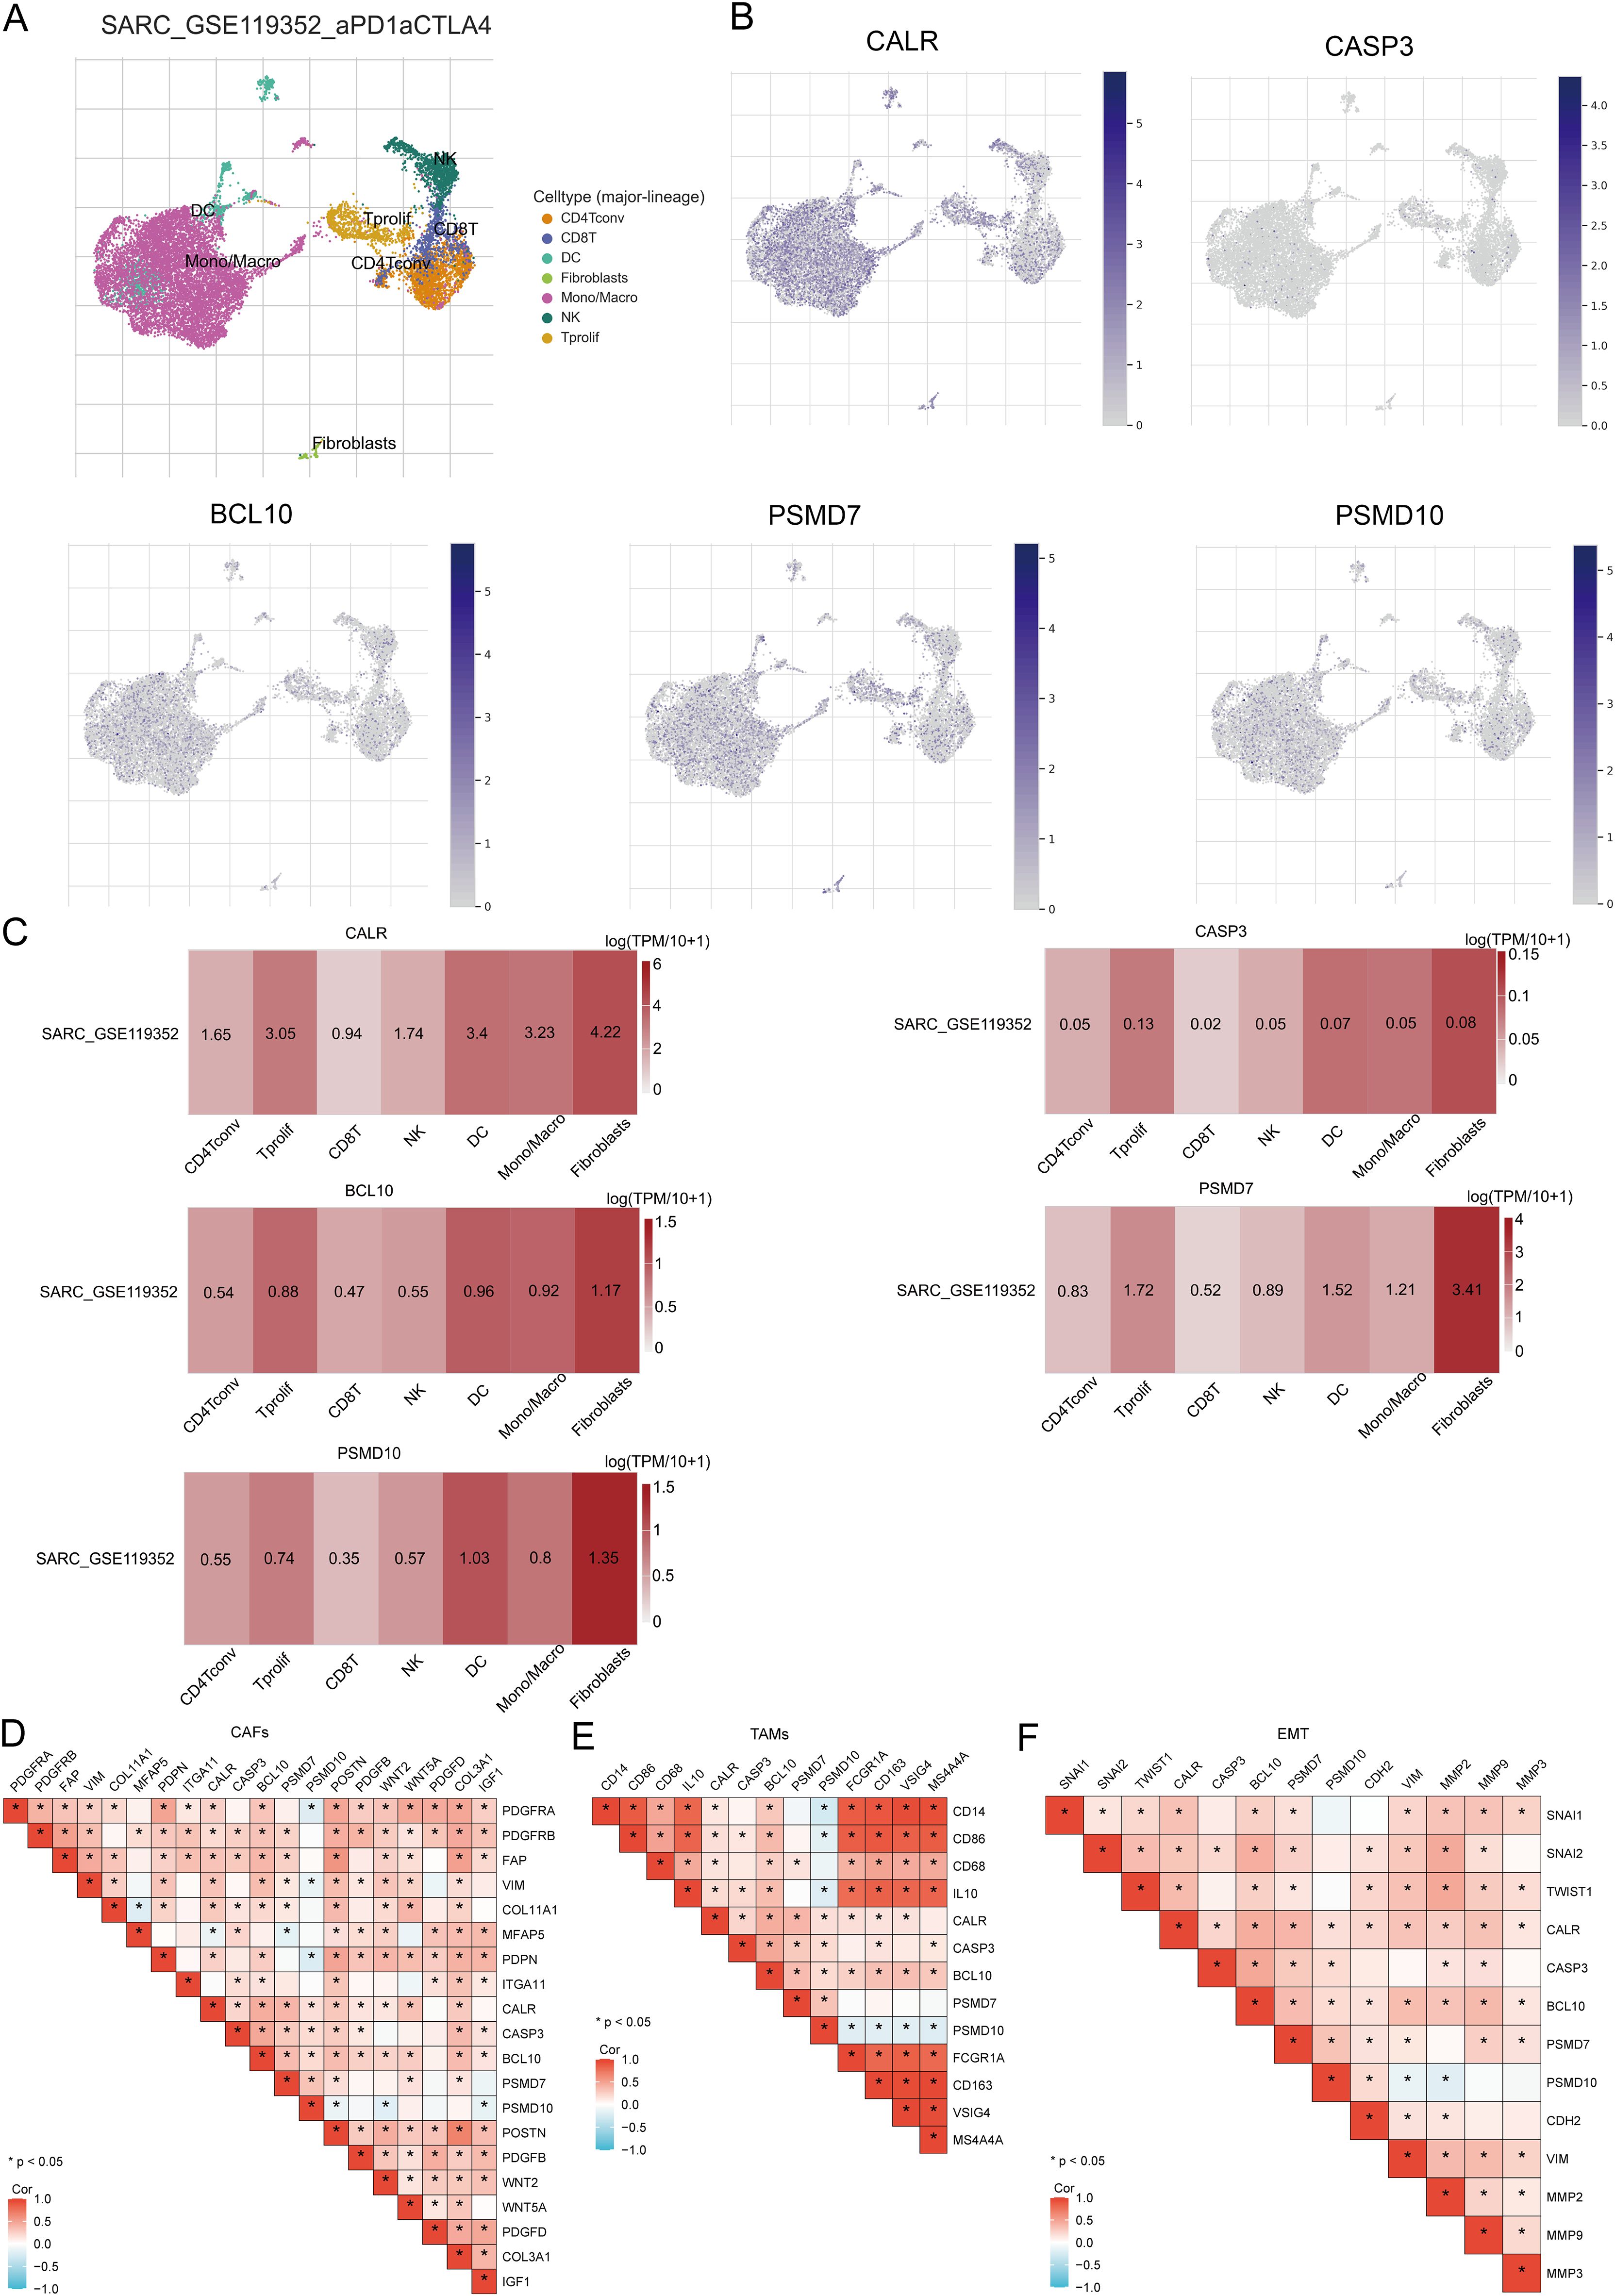
Figure 13. Expression of prognostic URGs in different immune cell types in SARC. (A) Clustering of cell types in scRNA-seq data, t-SNE plot showing the expression of different immune cells in SARC tissues; (B) Feature plots of CALR, CASP3, BCL10, PSMD7, PSMD10 obtained from scRNA-seq data; (
留言 (0)