
記住我


The prevalent population comprised a total of 22,079 adult patients in 2019, and the incident population included 2661 newly identified MG adult patients in 2012 and 2013 (Table 1).
Table 1 Description of study populationsThe mean age was 60.8 (SD ± 18.6) years in the prevalent population and 60.1 (SD ± 19.0) years in the incident populations. Just over half of patients were female in both the prevalent (56.4%) and the incident population (52.5%). The mean time elapsed from the identification of MG until December 31st, 2019, was 10.6 (SD ± 9.5) years in the prevalent population. A minority of patients in the incident population (9.5%) underwent thymectomy during the 6-year follow-up.
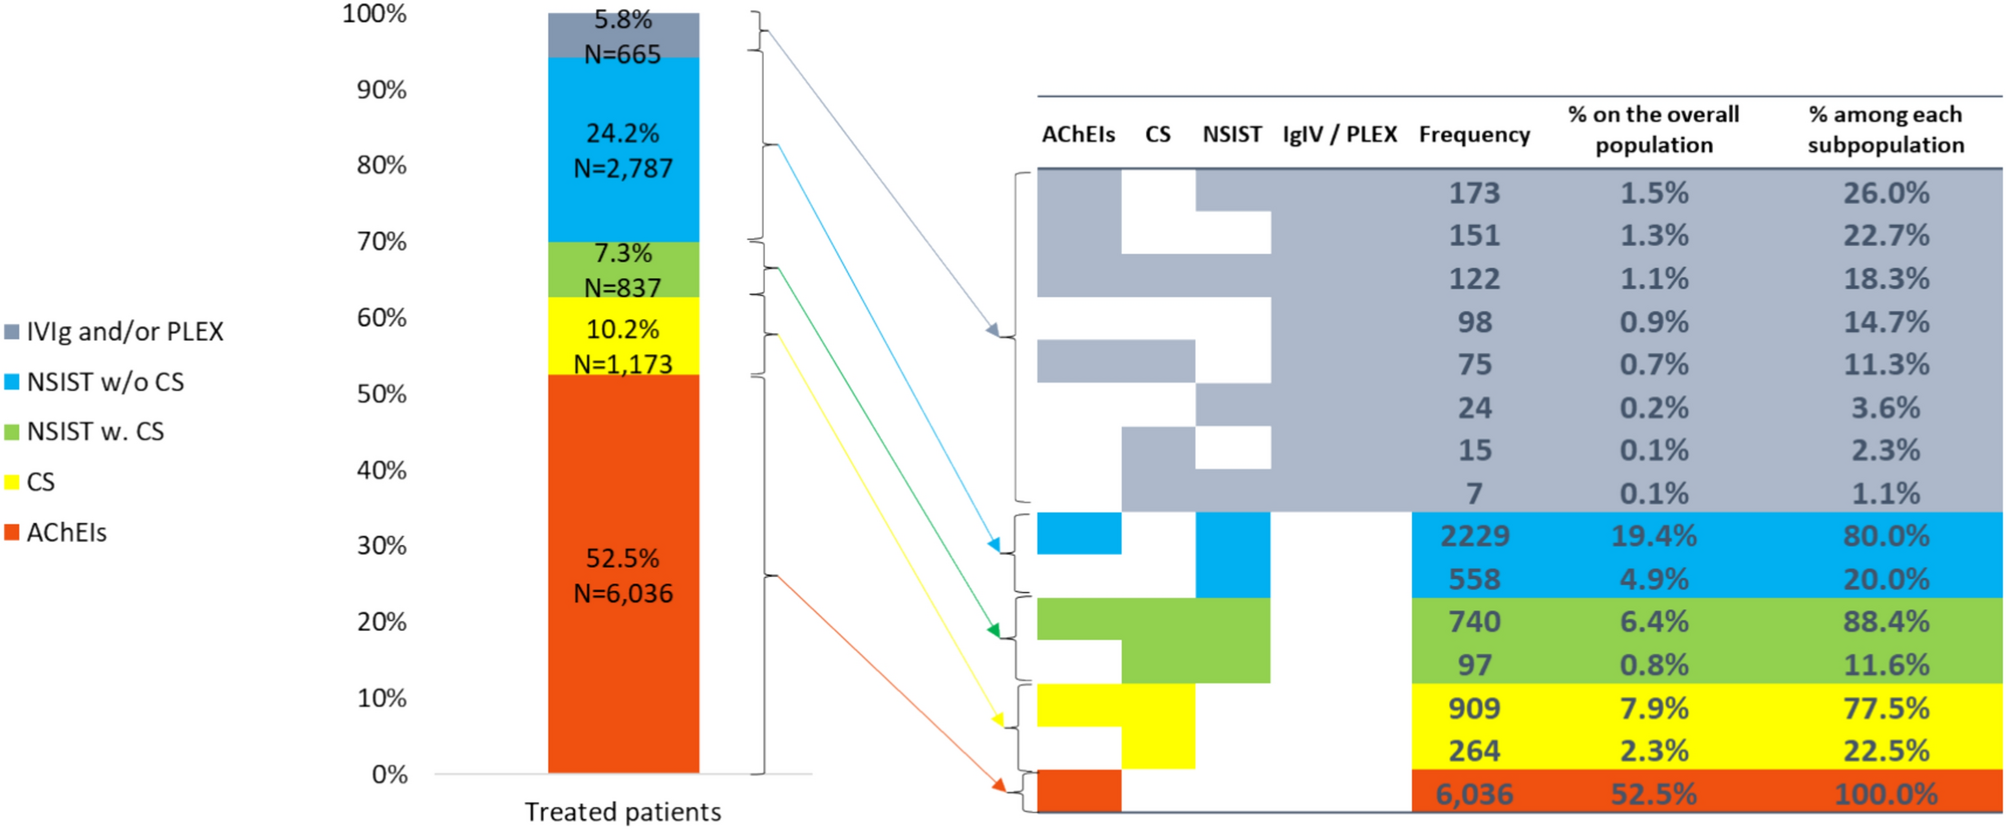
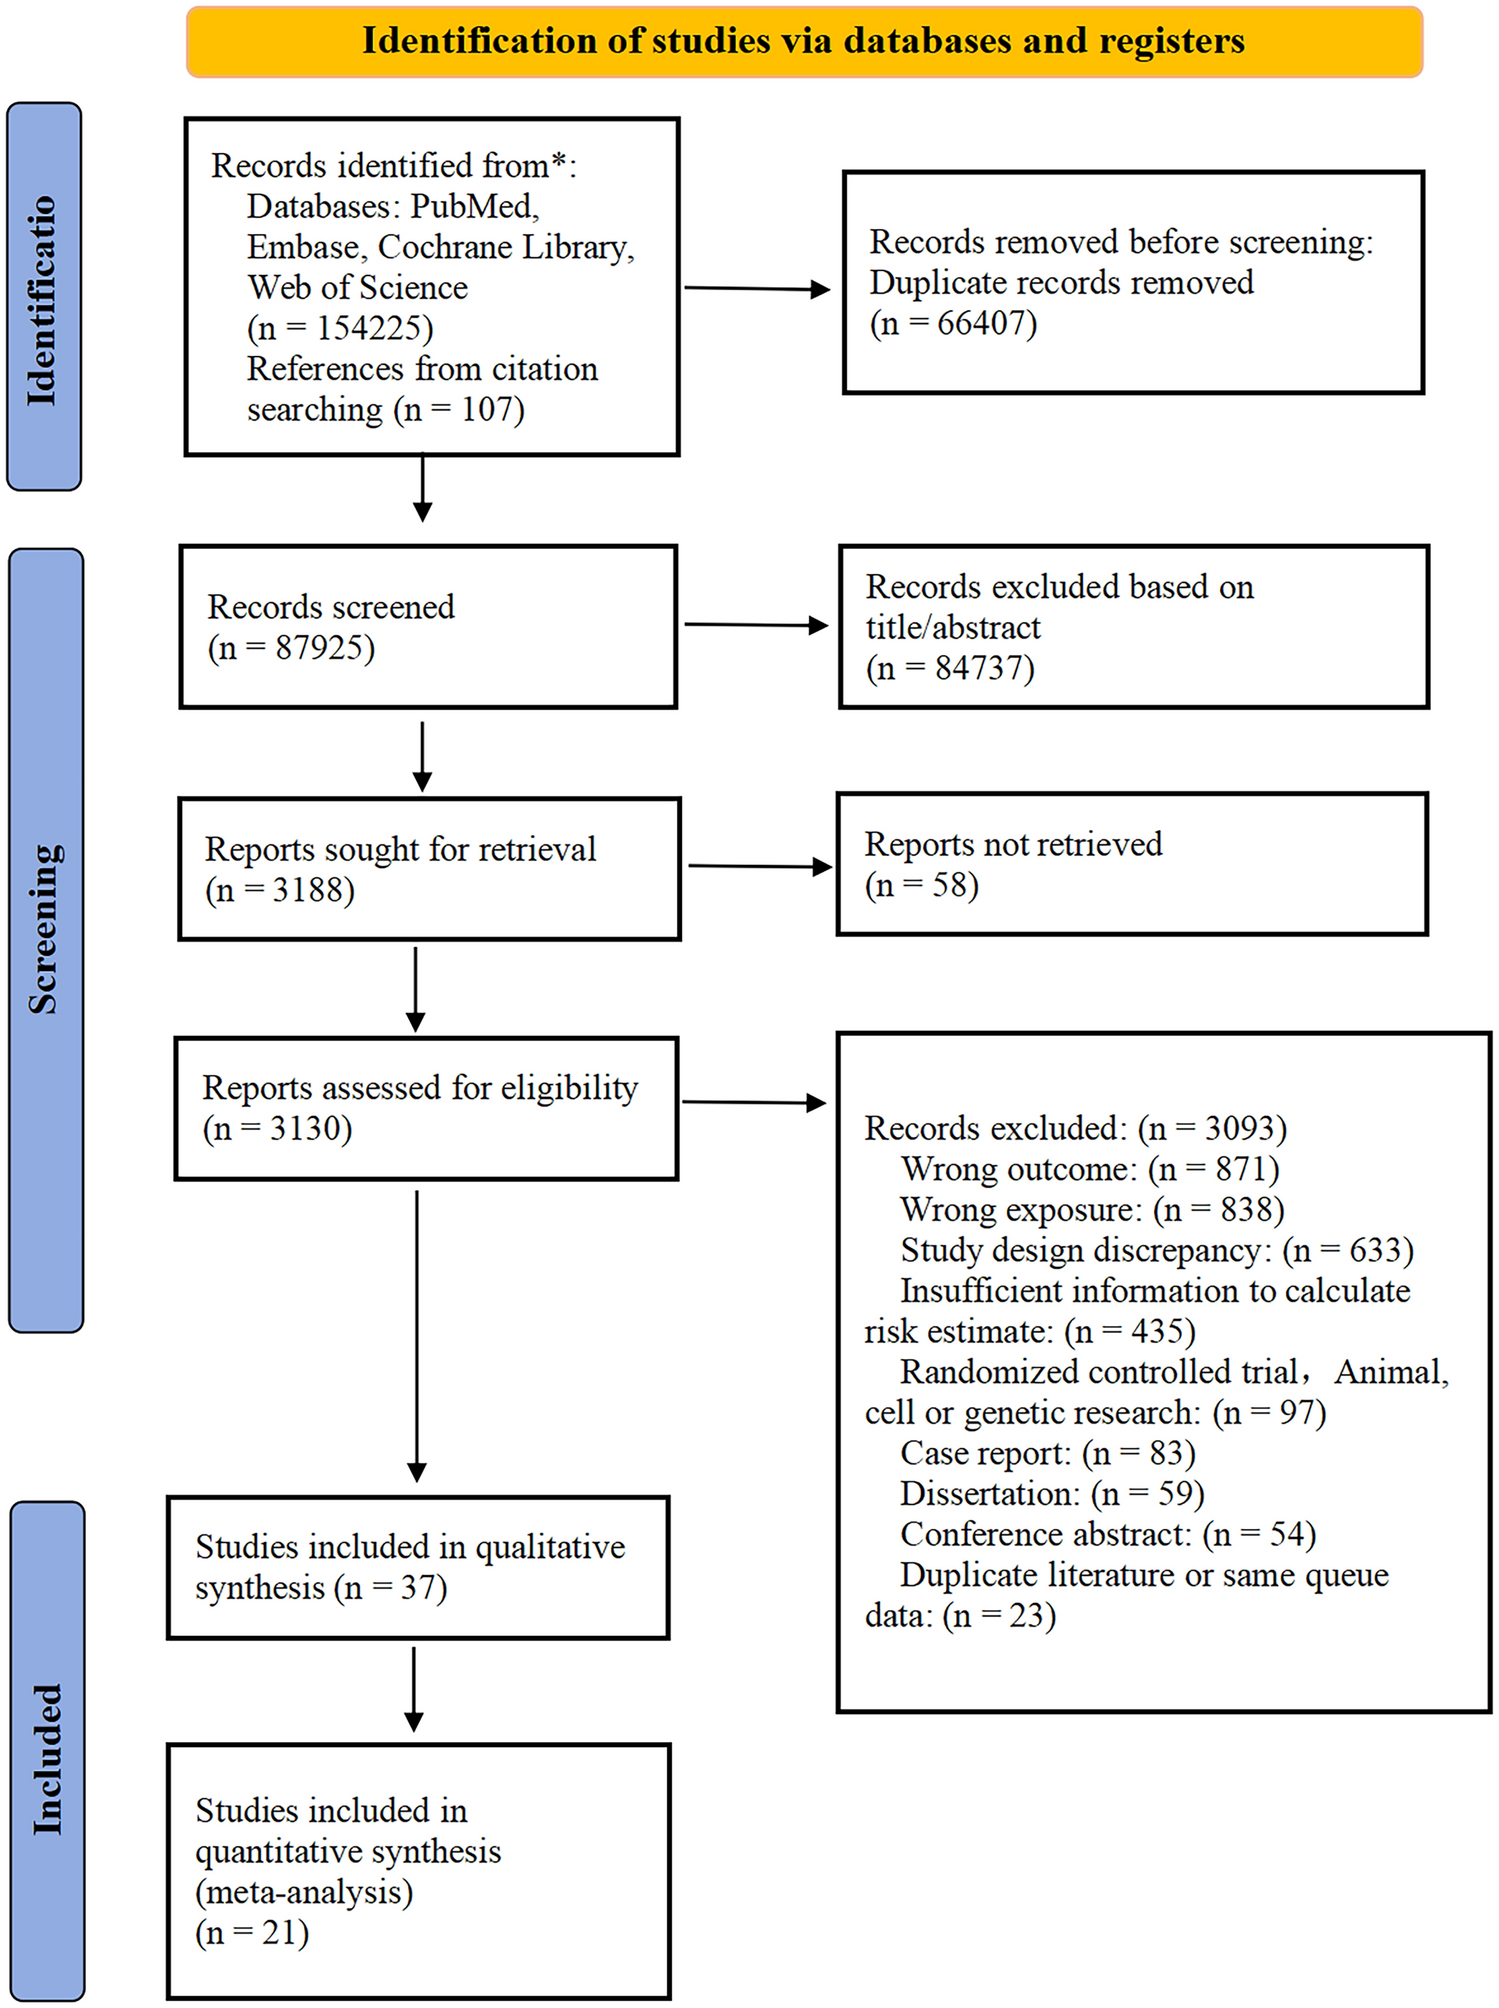
Prevalent population (in 2019)Chronic treatmentsOut of the 22,079 adult patients from the prevalent population, 11,498 (53.1%) received at least one chronic MG treatment in 2019. Among these treated patients, more than half (n = 6036; 52.5%) received AChEIs only, 1173 patients (10.2%) were treated with CS ± AChEIs, 837 (7.3%) had NSIST w. CS, 2,787 (24.2%) had NSIST w/o CS, and 665 (5.8%) received IVIg and/or PLEX (Fig. 1).
Fig. 1
Chronic treatments in 2019 for treated patients in the prevalent population (N = 11,498). The table on the right side gives the number of patients for all combinations of treatments. For example, of the 665 patients (5.8%) who were treated with’IVIg and/or PLEX’ (colored in grey), 173 patients were treated with IVIg/PLEX, AChEIs, and NSIST, and 151 patients were treated with IVIg/PLEX and AChEIs, etc. Definitions of chronic treatments: IVIg and/or PLEX: at least 4 sessions per year with or without AChEIs, NSIST or CS; NSIST w. CS: at least one NSIST delivery per year (mycophenolic acid, azathioprine, cyclosporine, tacrolimus, rituximab, and cyclophosphamide) and at least 5 CS deliveries over a 6-month period, and fewer than 4 sessions/year of IVIg/PLEX; NSIST w/o CS: at least one NSIST delivery per year with fewer than 5 CS deliveries over a 6-month period and fewer than 4 sessions/year of IVIg/PLEX; CS: at least 5 CS deliveries over a 6-month period with or without AChEIs and fewer than 4 sessions/year of IVIg/PLEX and no chronic NSIST delivery; AChEIs only: delivery of AChEIs and not meeting the criteria for any of the aforementioned categories
AChEIs were the most frequently prescribed symptomatic chronic treatment, whatever the treatment subgroup: 77.5% in the CS subgroup; 88.4% in NSIST w. CS subgroup; 80.0% in the NSIST w/o CS subgroup; and 78.3% in the IVIg/PLEX subgroup.
Among the patients treated with IVIg and/or PLEX, 13.6% were also treated with CS and no NSIST, 29.6% with NSIST and no CS, and 19.4% were also treated with both NSIST and CS, showing a high disease severity.
In 2019, 3.8% of the patients who received NSIST w. CS, and 7.9% of the patients who received NSIST w/o CS, were treated with rituximab as a second line NSIST. This shows that twice as many patients were prescribed rituximab after a first course of NSIST w/o CS than after a first course of NSIST w. CS.
Fast-acting treatments for exacerbations and crisesA total of 5,056 episodes of exacerbations were recorded in 2019 in the prevalent population.
Among the 22,079 patients from the prevalent population, 3,165 (14.3%) had at least one exacerbation (mean 1.6 exacerbations per patient) and 1321 (6.0%) at least 2 exacerbations. Overall, 1548 (30.6%) exacerbations were treated with IVIg and/or PLEX. Of the 3165 patients with an exacerbation, 933 (29.5%) had previously been treated with a chronic NSIST.
The overall mean duration of hospital stay for exacerbation was 5.9 days (median, 3.0 days).
During hospital stays, a fast-acting treatment was delivered for 1548 exacerbations (30.6%), and IVIg was the most frequently used with more than 90% (Table 2).
Fifty-nine (1.9%) of the 3,165 patients with at least one exacerbation in 2019 were treated with rituximab in the 6 months before the exacerbation. When not treated with rituximab beforehand, 123 patients (4.0%) received a first infusion of rituximab during the month following the exacerbation.
In 2019, 467 (2.1%) out of the 22,079 patients in the prevalent population had at least one myasthenic crisis, with a total of 501 crises recorded.
The overall mean duration of hospital stay related to a crisis was 17.7 days (median, 9.0 days).
During hospital stays, a fast-acting treatment was delivered for 265 crises (52.9%), and IVIg was the most frequently used with 75% (Table 2).
Seventy-nine (16.9%) of the 467 patients with at least one myasthenic crisis in 2019 were treated with rituximab in the 6 months before the crisis. When not treated with rituximab beforehand, 19 (4.9%) received a first infusion of rituximab during the month following the crisis.
When using the more stringent definition of myasthenic crises requiring mechanical ventilation to be invasive, overall, 318 patients (1.4%) had at least one crisis in 2019, with a total of 393 crises. Of these 393 crises, more than half (n = 222) were treated with a fast-acting treatment: 167 (75.2%) were treated with IVIg, 21 (9.5%) were treated with PLEX, and 34 (15.3%) were treated with both (Table 2).
Table 2 Hospitalization duration and fast-acting treatments for exacerbations or myasthenic crises in 2019 for the overall number of MG prevalent adult patients (N = 22,079)Incident population (6-year follow-up)Whole populationOverall, 2,661 adult patients were first identified with MG in 2012 or 2013. At least one chronic MG treatment was prescribed to 2250 of these patients (84.6%) during the up to 6-year follow-up period.
Among those 2,250 patients, 1,777 (79.0%) changed treatment category at least once by the end of the follow-up (Fig. 2). Most of them received AChEIs (n = 286; 60.5%). Changes of patients’ treatment category over the 6-year follow-up period are illustrated as a Sunburst diagram showing the variety of treatment pathways (Fig. 2). During the follow-up period, the mean number of treatment category modifications was 2.89 (median 1).
Fig. 2
Sunburst diagram depicting 1-year treatment sequences over the first 6 years following MG identification (each ‘spoke’ follows a patient over time: successive treatments for the same patients are visualized through each circle, chronologically from the centre to the periphery). IVIg and/or PLEX: at least 4 sessions per year with or without AChEIs, NSIST, or CS; NSIST w. CS: at least one NSIST delivery per year (mycophenolic acid, azathioprine, cyclosporine, tacrolimus, rituximab, and cyclophosphamide) and at least 5 CS deliveries over a 6-month period, and fewer than 4 sessions/year of IVIg/PLEX; NSIST w/o CS: at least one NSIST delivery per year with fewer than 5 CS deliveries over a 6-month period and fewer than 4 sessions/year of IVIg/PLEX; CS: at least 5 CS deliveries over a 6-month period with or without AChEIs and fewer than 4 sessions/year of IVIg/PLEX and no chronic NSIST delivery; ACchEIs only: delivery of AChEIs and not meeting the criteria for any of the aforementioned categories
Focus on patients initiating treatment with CS and/or NSISTAmong the 2,250 patients treated during at least one semester over the 6-year follow-up, 632 (28.1%) patients received an immunomodulator (CS, NSIST) treatment on the first semester (Fig. 3). The initiated immunomodulator treatment was CS for 35.3%, NSIST w. CS for 28.2% and NSIST w/o CS for the remaining 36.6%. During the last semester, among the patients who remained on treatment and after excluding death (n = 119), these proportions were 10.9%, 12.5%, and 35.3%, respectively, showing a decrease of patients treated with CS and NSIST w. CS.
Fig. 3
Modifications of treatment for the 2012–2013 incident patients treated with CS and/or NSIST in the first 6 months (N = 632 patients). IVIg and/or PLEX: at least 4 sessions per year with or without AChEIs, NSIST or CS; NSIST w. CS: at least one NSIST delivery per year (mycophenolic acid, azathioprine, cyclosporine, tacrolimus, rituximab, and cyclophosphamide) and at least 5 CS deliveries over a 6-month period, and fewer than 4 sessions/year of IVIg/PLEX; NSIST w/o CS: at least one NSIST delivery per year with fewer than 5 CS deliveries over a 6-month period and fewer than 4 sessions/year of IVIg/PLEX; CS: at least 5 CS deliveries over a 6-month period with or without AChEIs and fewer than 4 sessions/year of IVIg/PLEX and no chronic NSIST delivery; AChEIs only: delivery of AChEIs and not meeting the criteria for any of the aforementioned categories
Over the 6 years of follow-up, 78.0% of the 632 patients who initiated treatment with an immunomodulator during the first semester switched treatment category. This proportion was even higher in the CS and NSIST w. CS subgroups with, respectively, 81.2% and 86.0% having at least one treatment category modification (vs. 68,8% in the NSIST w/o CS subgroup). In the CS and NSIST w. CS subgroups, respectively, 52.0% and 55.6% had two or more treatment category modifications.
Impact of age at first identification of MG on chronic treatment patternDistribution of chronic treatment categories was almost similar across the different age groups (< 50, 50–64, 64–79 years, and ≥ 80 years) at first identification of MG (Supplementary, Fig. 1). However, when comparing treatment in the last 6 months of the 6-year follow-up, the increase in the proportion of patients receiving no treatment and the decrease in the proportion of patients receiving NSIST w/o CS were both higher in patients under 50 years of age than in older patients.
Impact of calendar year of first MG identification on chronic treatment patternNo significant difference was seen in the distribution of chronic treatment categories over the first year after MG identification, regardless of the year of MG identification (2012–2019) (Supplementary, Fig. 2).
留言 (0)