
記住我
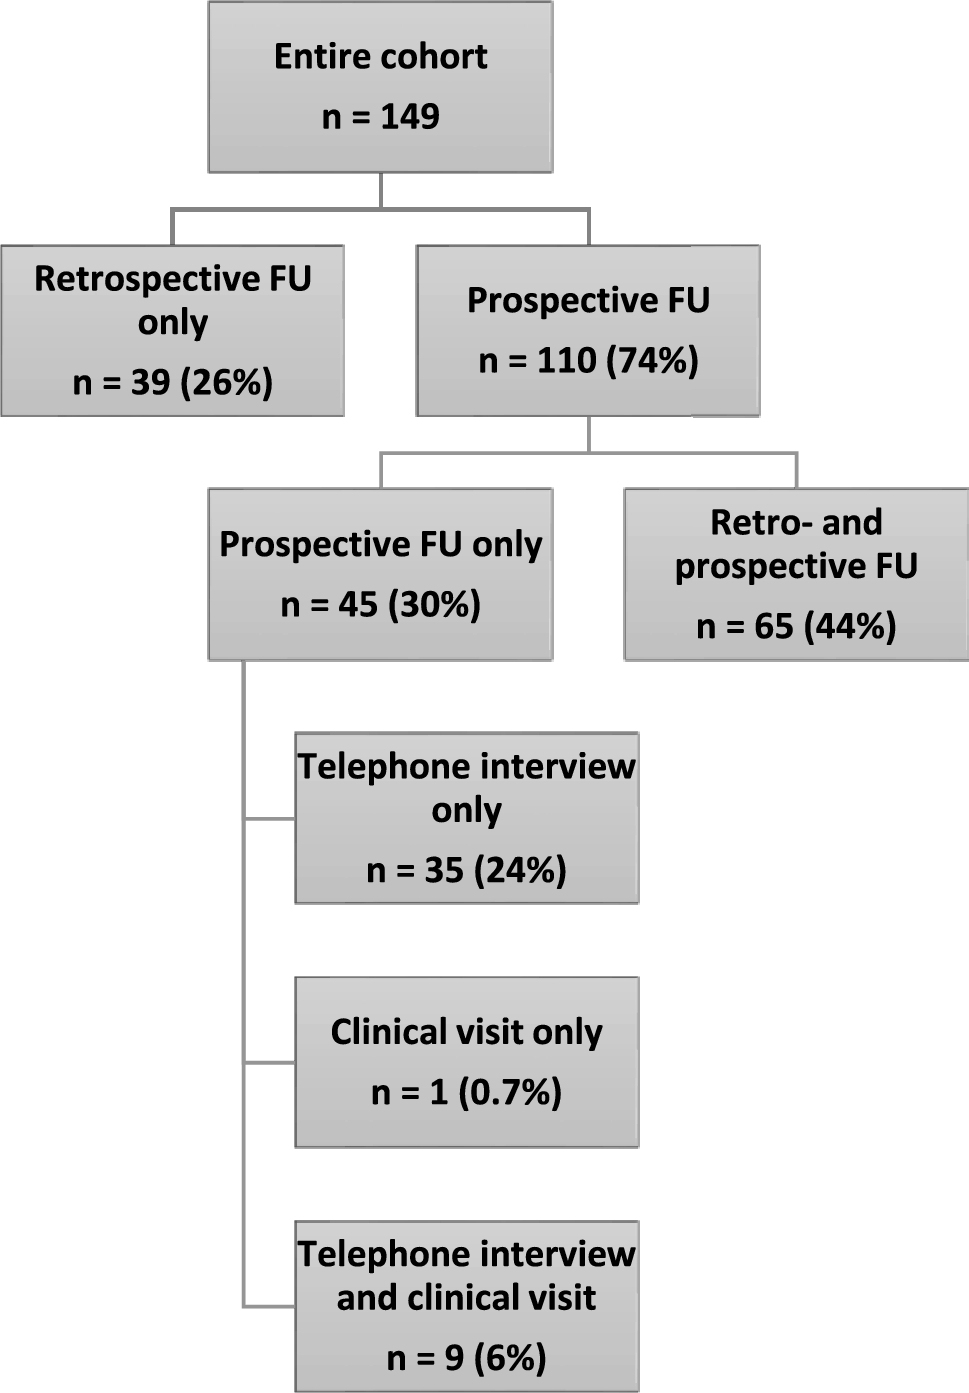


21 HD gene carriers and 14 controls participated in the study. All gene carriers were premanifest at baseline (2009–10) and Time 2 (2011–12). By Time 3 (2013–14), 1 gene carrier had converted to prodromal HD, and another had converted to manifest HD. Between Time 3 and Time 4, a further 12 gene carriers converted to prodromal (n = 5) or manifest (n = 7) HD. As such, 7/21 gene carriers remained premanifest by study completion (“non-converters”), whereas 14/21 had converted to prodromal or manifest HD (“converters”). The time of conversion to manifest disease could be confirmed to within 12 months in 5/8 manifest gene carriers; the mean ± SD years to conversion from study initiation within these individuals was 10.0 ± 2.9 years. The mean ± SD TFC of manifest individuals was 9.4 ± 2.7. Together, this indicates that our converter cohort predominantly reflected individuals in the prodromal or early stages of HD by study completion. Clinical trajectories are depicted in Scheme 1.
Scheme 1
Clinical conversion trajectory of gene carriers. X denotes timing of conversion to manifest disease, where conversion could be confirmed to within 12 months (n = 5/8)
There was no statistical difference between converters, non-converters and controls with respect to potentially confounding factors, bar, as would be expected, a lower time interval in years to predicted onset from baseline among converters (Table 1). 5 gene carriers and 5 controls withdrew from blood sampling and cognitive testing at Time 4. These individuals were matched to participants remaining in the study on all relevant confounding factors apart from in a marginal reduction in years of education, and significantly lower predicted years to onset (Table 1). This latter finding reflects that all five gene carrier withdrawals were manifest of HD at Time 4.
Table 1 Cohort demographicsIn addition, some participants omitted a proportion of cognitive tests or some blood sampling timepoints. Precise rates of participation, together with summary statistics, of these variables are detailed in Fig. 2B and Supplementary Table S2. Considering all participants and timepoints, NfL data were available in 97/140 (69%) possible observations, and clinical scores were available in 365/462 (79%) possible observations. There was no significant difference in the proportion of missing data per group in any variable, bar in comparatively lower missing NfL data among non-converters at baseline (p = 0.025). No values in any variable met outlier criteria.
1.NfL is significantly higher in prodromal/manifest HD than in premanifest HD, and is positively associated with clinical markers of disease severity
First, we assessed for differences in NfL levels between groups after phenoconversion to prodromal/manifest disease, i.e. by assessing Time 4 data.
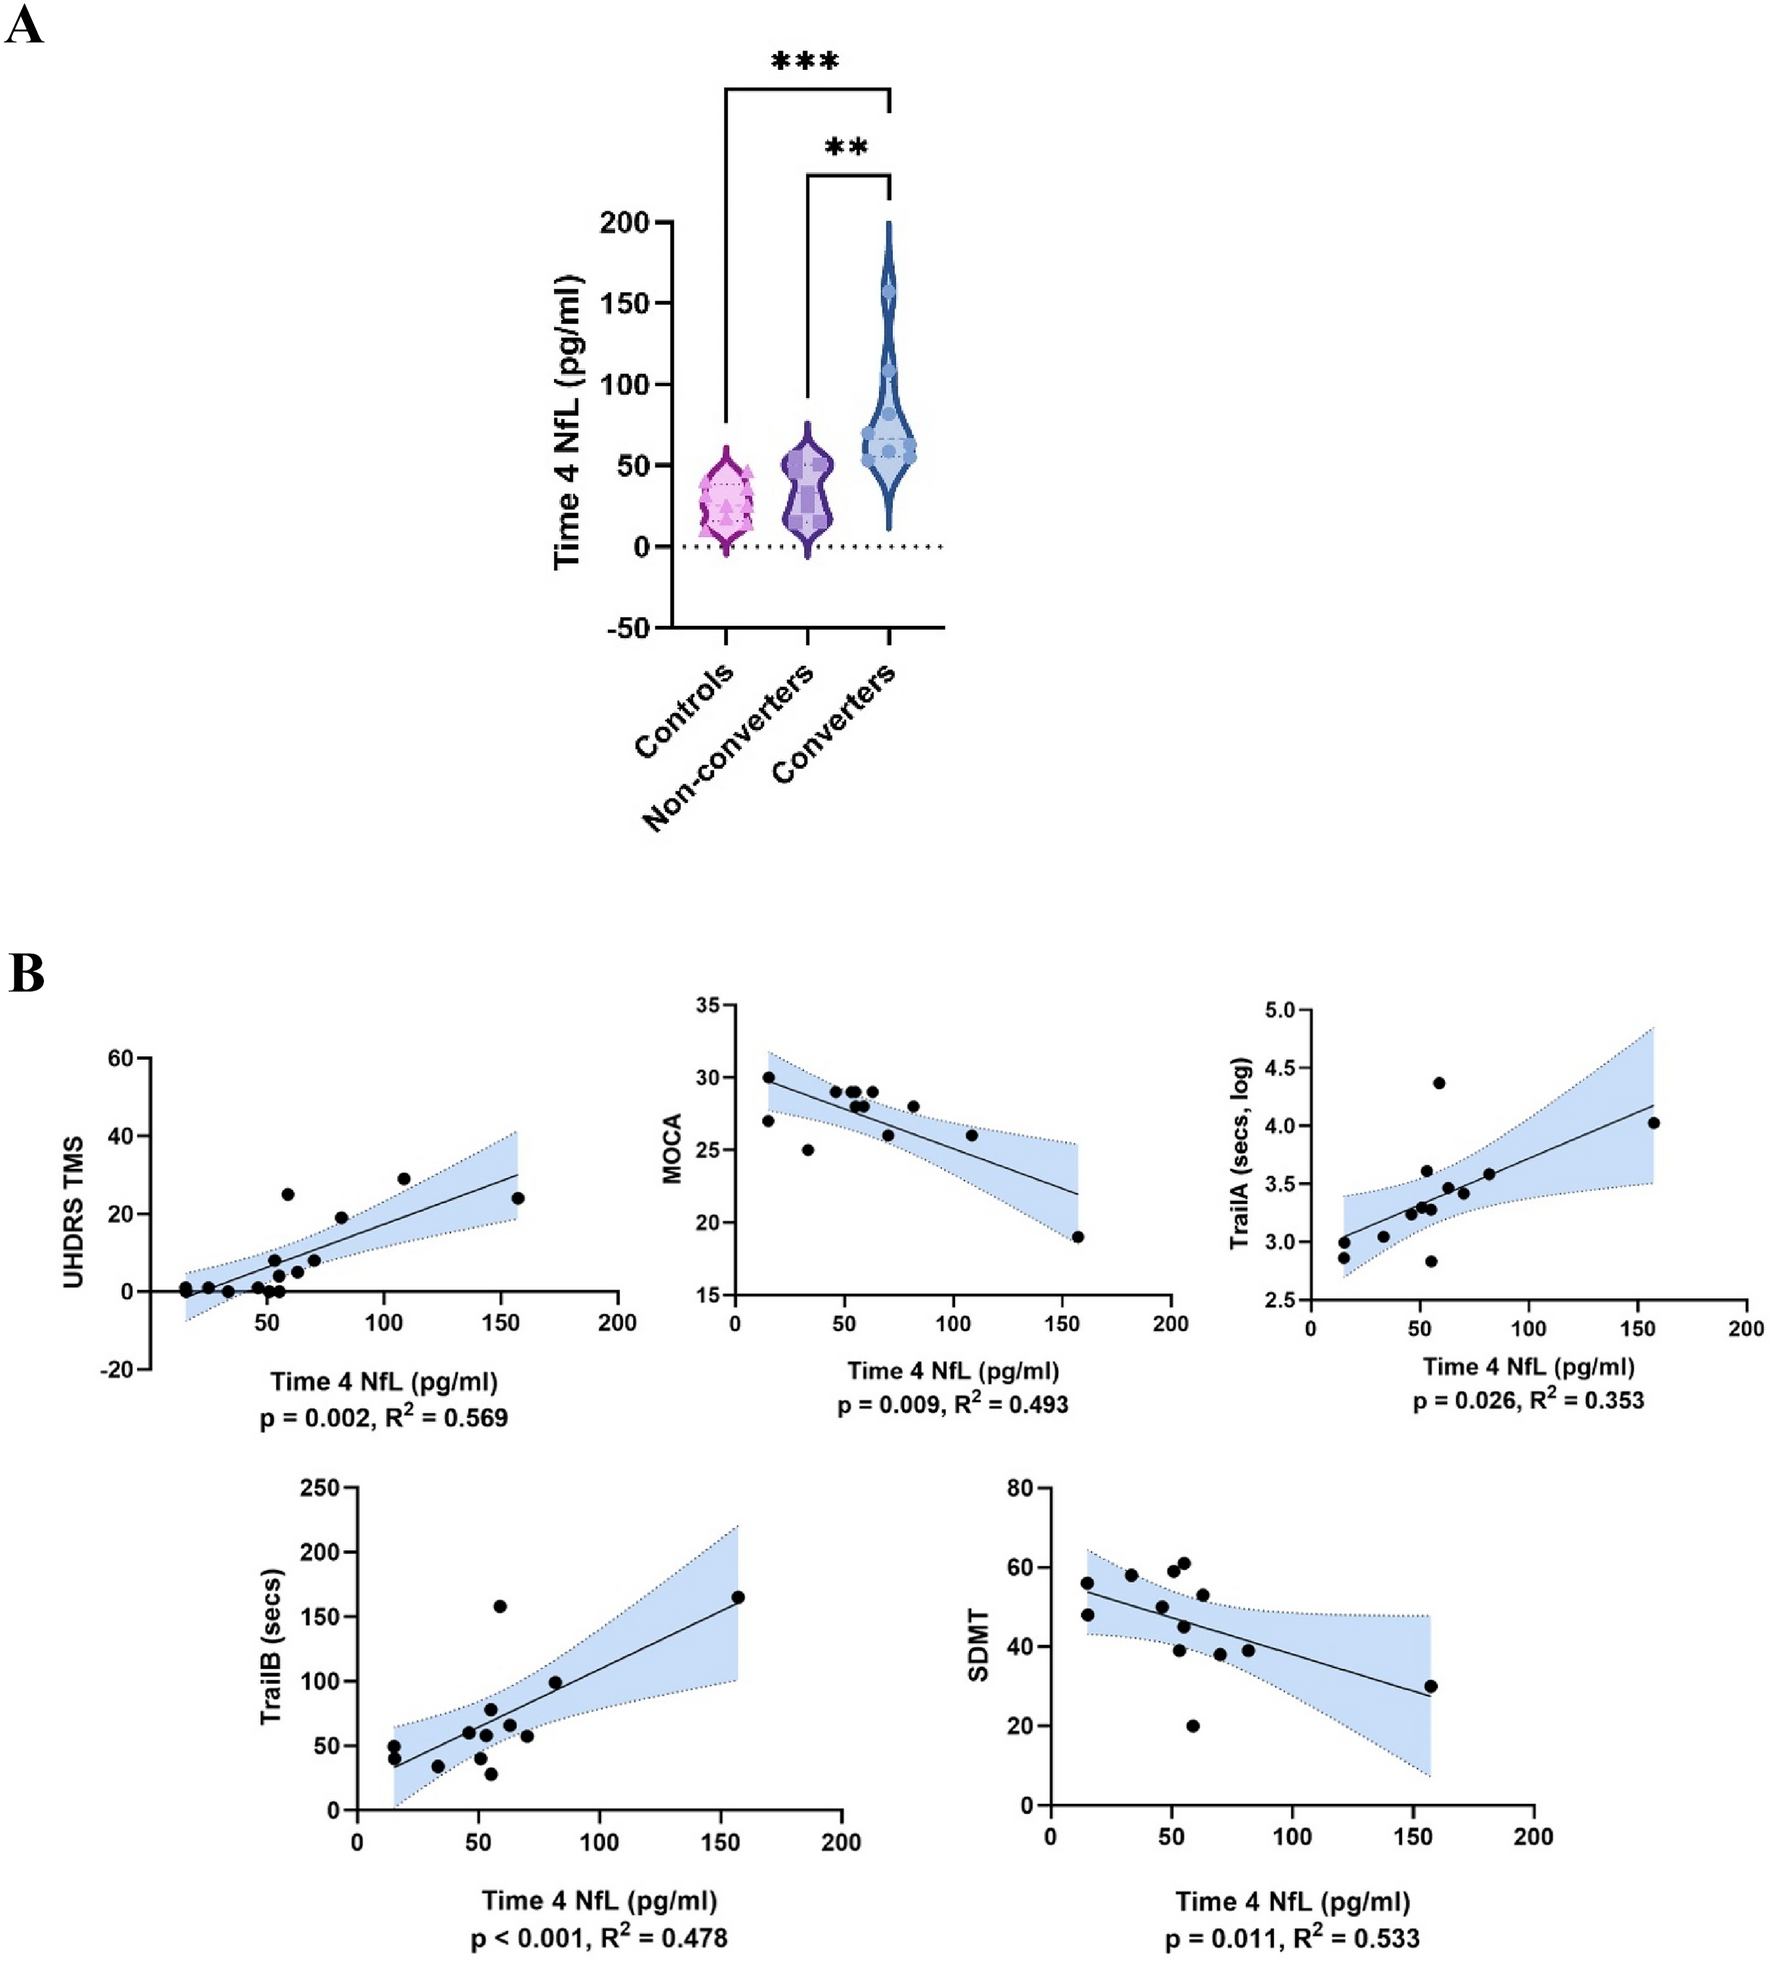
At Time 4, NfL concentrations were significantly higher in gene carriers who had converted to prodromal or manifest disease than in those who remained premanifest (t = 3.29, p = 0.006, Cohen’s d = 1.63) and controls (t = 4.02, p = < 0.001, Cohen’s d = 2.05) (ANOVA ηp2 = 0.54). By contrast, NfL levels in non-converters did not significantly differ from controls (t = 0.920, p = 0.833) (Fig. 1A).
Fig. 1
A Time 4 NfL concentrations. Group differences assessed by ANOVA adjusted for age, sex, CAG repeat length and BMI. ***p < 0.001; **p < 0.01; *p < 0.05. B Linear regression analyses of Time 4 NfL concentrations versus Time 4 clinical assessment scores among all gene carriers. Linear regressions adjusted for age, sex, CAG repeat length and BMI. p values corrected for multiple comparisons by false discovery rate (Benjamini–Hochberg correction). Shaded areas reflect 95% confidence interval. Results meeting significance threshold depicted
To provide additional confidence in our results, we mitigated against the possible effects of sample size by then also repeating analysis with bootstrapping. The results remained significant following this (Supplementary Table S3).
Higher Time 4 NfL levels among gene carriers were also associated with a more severe concurrent motor features (UHDRS TMS R2 = 0.569, β = 0.774, p = 0.002) and poorer scores on four cognitive scales (MoCA R2 = 0.493, β = − 0.732, p = 0.009; logTrail A R2 = 0.353, β = 0.638, p = 0.026; Trail B R2 = 0.478, β = 0.722, p = < 0.001; SDMT R2 = 0.533, β = − 0.726, p = 0.011) (Fig. 1B).
2.NfL becomes elevated and rises more rapidly in the late premanifest/transitional phase of HD, compared to the early premanifest phase
Next, we assessed for differences in NfL levels during the late premanifest/transitional phase of HD compared to the early premanifest phase and controls, by assessing for group differences cross-sectionally at Baseline, Time 2 and Time 3.
In cross-sectional analysis at each of these timepoints, NfL concentrations were higher in converters (i.e. those in the late premanifest/transitional phase) than in both non-converters (i.e. those in the early premanifest phase) and controls (F = 15.55, p = < 0.001, ηp2 = 0.66; F = 4.05, p = 0.03, ηp2 = 0.25; F = 5.56, p = 0.012, ηp2 = 0.35 respectively). This reached statistical significance on post hoc pairwise analysis in all cases, bar between converters and non-converters at Time 2 (Fig. 2A). Findings again persisted following re-analysis incorporating bootstrapping (Supplementary Table S3).
Fig. 2
A Baseline, Time 2, and Time 3 NfL concentrations by group. Group differences assessed by ANOVA adjusted for age, sex, CAG repeat length and BMI. ***p < 0.001; **p < 0.01; *p < 0.05. B Longitudinal dynamics of NfL concentrations by group. Top = individual participants. Left shaded markers indicate sampling in first half of a given timepoint period, right shaded markers indicate sampling in second half of a given timepoint period. Bottom = pooled data. Error bars = SEM. **p < 0.01; *p < 0.05 in group*time interaction adjusted for age, sex, CAG repeat length and BMI
We then assessed for group differences in the longitudinal dynamics of NfL across the study period.
Longitudinal patterns in NfL concentrations are depicted in Fig. 2B (to p = individual data; bottom = pooled data). Longitudinal modelling across the total study period by linear mixed model indicated significant main effects of both group (F = 8.79, p = 0.0094) and time (F = 17.6, p < 0.001), and a significant group*time interaction (F = 6.81, p = 0.006). Post-hoc pairwise comparison indicated that this interaction was significant with respect to both converters versus controls (estimate = 3.35 ± 0.92 (SEM), p = 0.001) and non-converters (estimate = 2.30 ± 1.00 (SEM), p = 0.033), suggesting a significantly faster rate of change in NfL among converters.
The mean (SD) annualised rate of change for the three groups generated from raw data was: controls 0.028 (± 0.47) pg/ml/year, non-converters 1.47 (± 1.24) pg/ml/year, converters 3.30 (± 3.13) pg/ml/year.
There was no significant difference between non-converters and controls in either cross-sectional (p = 0.161–0.707) or longitudinal modelling (estimate = 1.05 ± 0.99 (SEM), p = 0.304). This was also the case when longitudinal modelling was restricted to the first three timepoints (estimate = 3.20 ± 2.20 (SEM), p = 0.159).
Thus, together, these results suggest that NfL longitudinal dynamics are non-constant, increasing in parallel to healthy individuals during the premanifest phase far from onset, but becoming elevated and rising more rapidly during the late premanifest and transitional phase.
3.NfL may identify individuals at risk of conversion to manifest disease and predict clinical trajectory over a subsequent 14-year period
In ROC analysis, baseline NfL concentrations were highly effective in discriminating gene carriers who went on to convert during the study period from those who did not, exhibiting an area under curve of 1.000 (p = 0.003) (Fig. 3A). A cut off score of 24.06 pg/ml at baseline exhibited 100% sensitivity and specificity in determining this. A corresponding probability plot, depicting likelihood ratios of conversion within the study period for given baseline NfL concentrations, is provided in Fig. S4.
Fig. 3
A ROC curve analysis of Baseline NfL concentrations (left) and annualised rate of change in NfL (right) versus discrimination of converter from non-converter gene carriers. AUC area under curve. B Linear regression analysis of annualised rate of change in NfL concentrations and Time 4 clinical assessment scores among all gene carriers. Linear regression adjusted for age, sex, CAG repeat length and BMI. p values corrected for multiple comparisons by false discovery rate (Benjamini–Hochberg correction). Shaded areas reflect 95% confidence interval. Results meeting significance threshold depicted
Annualised rate of change of NfL, however, did not exhibit parallel predictive utility: area under curve 0.643 (p = 0.355) (Fig. 3A). Nonetheless, annualised rate of change in NfL concentration in gene carriers was predictive of more severe motor features (UHDRS TMS R2 = 0.468, β = 0.711, p = 0.007) and poorer scores on three cognitive scales at Time 4 (MoCA R2 = 0.604, β = − 0.798, p = 0.007; Trail B R2 = 0.567, β = 0.772, p = 0.007; phonemic fluency R2 = 0.345, β = − 0.632, p = 0.035) (Fig. 3B).
We then used our NfL cut off score of 24.06 pg/ml to provide further exploratory analysis of the dataset. We used this cut off score to segregate gene carriers into high (n = 12) and low (n = 9) NfL groups according to NfL concentration at their initial sample. Longitudinal modelling of UHDRS TMS trajectories based on these groups demonstrated a significant group*time interaction (p = 0.047, Figure S5).
We also undertook Kaplan–Meier survival curve and Cox regression analysis based on these groups. This was necessarily exploratory, as the precise timing of conversion to manifest disease (accurate to within 12 months) could only be ascertained from clinical records for five of the eight participants who converted to manifest HD during the study. Limiting analysis to these five participants, versus those who remained premanifest throughout the study (n = 7), a log-rank (Mantel–Cox) test of the Kaplan–Meier survival curve showed a significant difference between the two groups (χ2(1) = 6.78, p = 0.009, Fig. S6). Cox regression, following adjustment for covariates, indicated that initial NfL > 24.06 pg/ml was a significant predictor of conversion to manifest HD within the study period (p = 0.028) with a HR of 12.43 (95% CI 1.73–250.38). The mean time to conversion in this group from initial NfL sampling was 9.0 ± 2.8 years.
留言 (0)