
記住我


In this cross-over single-centre prospective study, a cohort of 30 patients (60.9 ± 16.1 yo, 7 females) with various chronic aortic diseases (aortic dissection type A: 10, aortic dissection type B: 7, aortic aneurysm: 8; status after contained aortic rupture: 3, Marfan syndrome: 1, stenosis of the left subclavian artery and impact of coronary artery bypass: 1) underwent a clinical follow up routine MRI examination between July and October 2022. The standard TWIST was complemented by a GRASP sequence after the local institutional review board approved the study and all patients gave their written informed consent before the MRI examination.
MRI data acquisitionAll data were acquired on a 1.5T clinical scanner (Magnetom SolaFit, Siemens, Erlangen, Germany) equipped with a 32-channel body coil.
With each CE-trMRA acquisition, the same amount of GBCA (Gadovist 1.0 M, Bayer, Switzerland AG, Zurich) was administered (0.075 ml/(kg bw), flow rate 4 ml/s), i.e. twice during each protocol. All images were acquired during free breathing in the oblique coronal plane. To reduce bias due to contrast enhancement in the vascular systems during the second CA administration, TWIST and GRASP sequences were acquired in reverse order for half of the patients (n = 15), respectively. For all examinations, there was a three-minute pause between CA administrations. The reconstruction of GRASP data was performed inline at the scanner within about 30 s.
All acquisition parameters are summarised in Table 1. For the TWIST sequence, 25% of the k-space centre was used to reconstruct a time frame, whereas 33% of the remaining k-space periphery was sampled between each acquisition of the k-space centre [27]. For the GRASP sequence, 13 radial projections were used to reconstruct one-time frame.
Table 1 Time-resolved contrasted-enhanced magnetic resonance angiography acquisition parametersQualitative image analysisQualitative analysis was performed using original non-subtracted 3D dynamic images. Three experienced radiologists (with 20 (#1), 5 (#2), and 8 (#3) years of experience) assessed the overall image quality independently. To this end, vascular contrast, vessel sharpness, and image artefacts of TWIST and GRASP were assessed by grading the images on a 4-point Likert scale. In detail: for overall image quality, vascular contrast, and vessel sharpness: 1 = excellent; 2 = acceptable (good); 3 = poor (still diagnostic); 4 = non-diagnostic. For image artefacts: 1 = no artefacts; 2 = minor artefacts (not interfering with diagnostic content), 3 = moderate artefacts (degrading diagnostic content, image still diagnostic), 4 = severe artefacts (non-diagnostic image).
Special attention was paid to streaking artefacts for GRASP and fold-over artefacts for TWIST when assessing image artefacts. For the overall image quality index, readers focused on vascular enhancement visibility and perfusion on the vessel of the ascending aorta, supra-aortic vessels, intercostal arteries, visceral branches, notably inferior mesenteric artery, renal cortex (primary entry and additional small communication channels in aortic dissection patients).
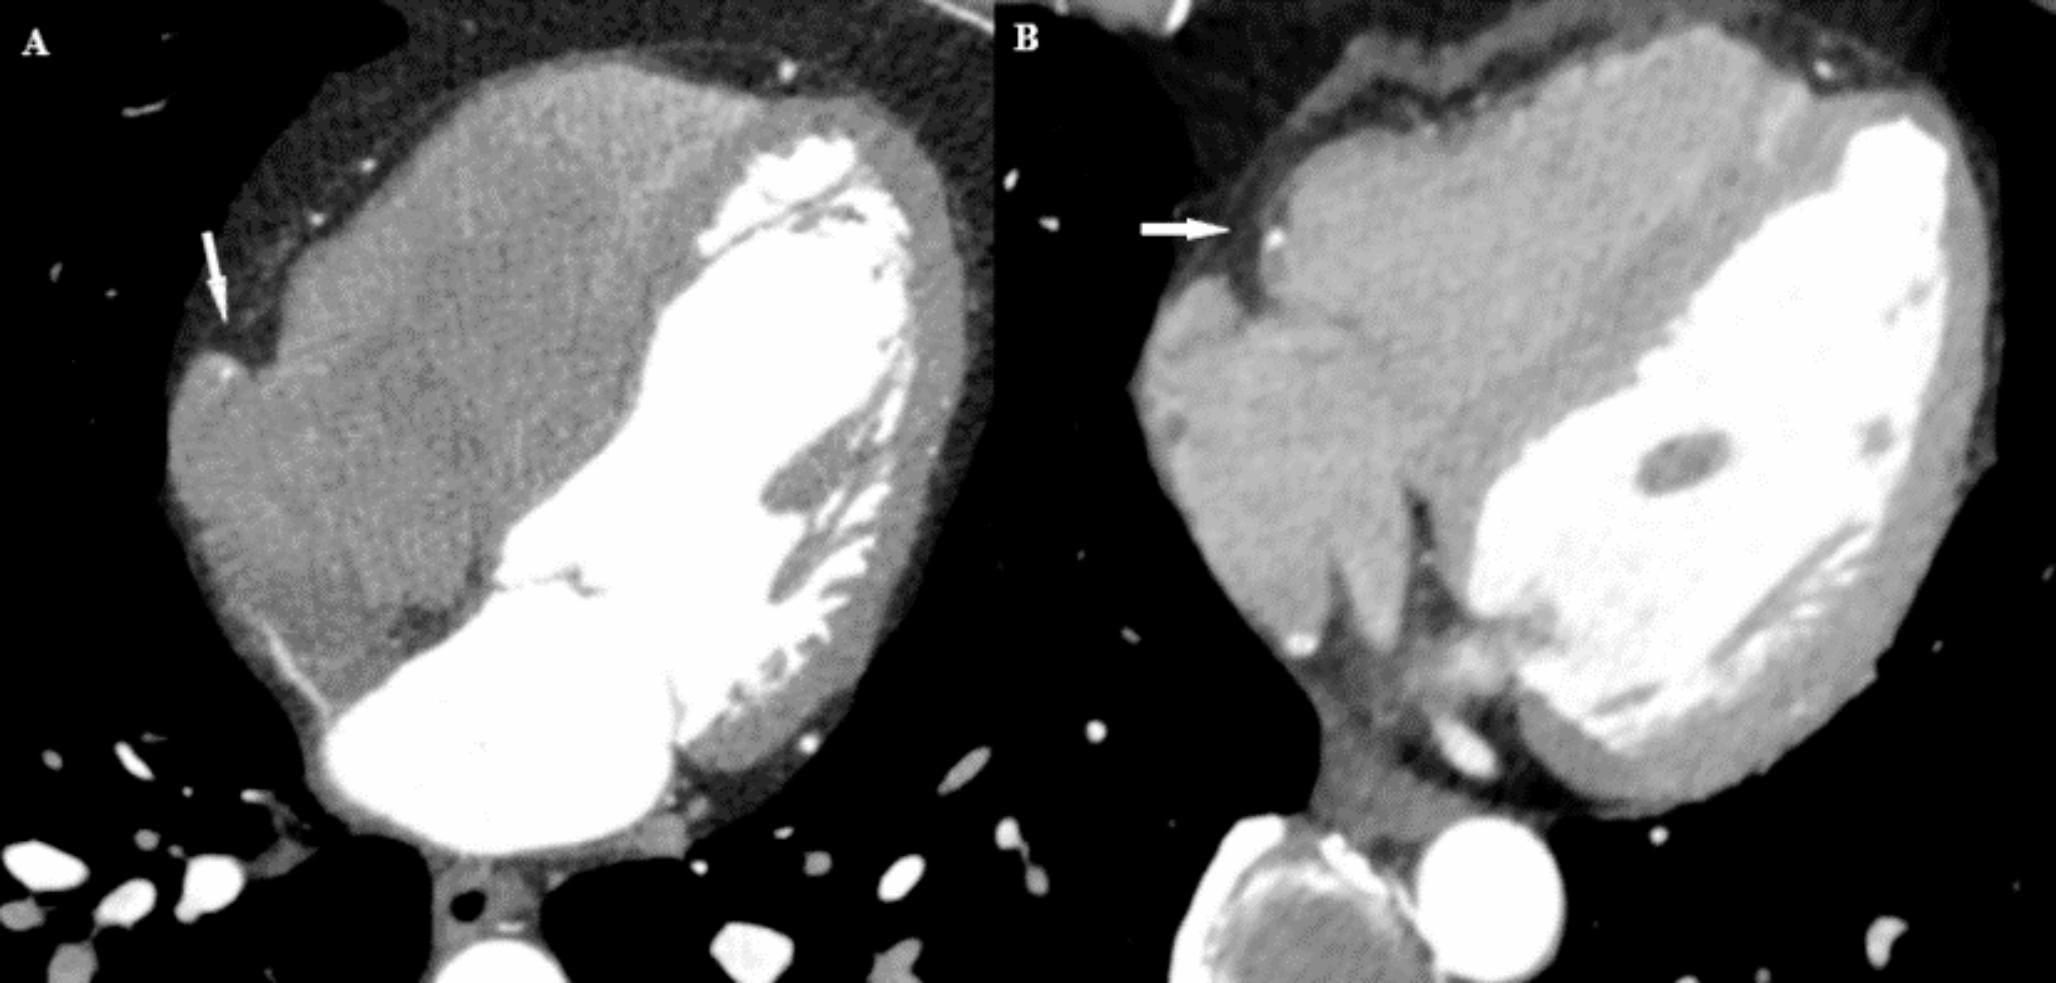
An experienced (20 years of practice) radiologist also assessed aortic diameters at three levels, as illustrated in Fig. 1: ascending aorta (AA), descending aorta at the level of the pulmonary trunk (DA), and abdominal aorta below the infrarenal arteries (AbA). This assessment was carried out by manually measuring the vessel diameters based on double-oblique multiplane reformation provided by clinical routine software from PACS.
Fig. 1
On the bottom, example of placement of ROIs at different levels of aorta: ascending aorta at the level of the pulmonary trunk, AA (red), descending aorta at the level of the pulmonary trunk, DA (blu), and abdominal aorta at the level of the renal arteries, AbA (green). On the top, plot of their signal intensity over time. Images shown are exemplary GRASP images
Quantitative image analysisQuantitative image analysis was performed by MATLAB 9.12 (MathWorks, Natick, MA, USA) using original non-subtracted images. Circular regions-of-interest (ROIs) were placed at the same three aortic levels as for the qualitative image analysis (Fig. 1). In cases of an aortic dissection, the true lumen was chosen for the placement of the ROIs. When drawing circular ROIs, those slices and temporal frames were selected, where the anatomy of interest was best visible to the readers. For each patient identical ROIs at the same positions were used for both sequences. ROIs were drawn on TWIST images first for half of the patients. The temporal behaviour of the sequences was quantified by obtaining the maximum slope of the CA uptake (maxslope) and the full width at half maximum (FWHM) from the normalised and interpolated signal intensity time courses within the ROIs. Time signal intensity curves were interpolated by a factor of 10 and a smoothing function was applied to exclude the influence of noise on the outcome.
Spatial blurring was quantified by calculating vessel sharpness as follows: at the same levels of the aorta as described above a straight line perpendicular to the vessel wall was drawn across the aorta. Vessel sharpness (vs.) of the boundary was then calculated from the resulting signal intensity profile as vs. = 1/d. The value d (millimetres) is the distance between those points on the drawn line, between which the signal intensity changed from 20 to 80% of the absolute intensity difference, i.e. the difference between the maximal and the minimal signal intensity values [28] (Fig. 2).
Fig. 2
In A an example of line drawing perpendicular to the vessel, across descending aorta at the level of the pulmonary trunk, for GRASP is shown. In B there is the generation of profile assessment of vessel sharpness (vs.) from such line and a comparison with TWIST. Normalised signal intensity is represented for an easier comparison between TWIST and GRASP even if absolute signal intensity was employed for the calculus of vs. In C there is the formula used to calculate vessel sharpness from the information obtained in B
Signal-to-Noise ratio (SNR) calculation was performed by adopting the first method described in the previous work [29]. Images from the second and the third time frames (before the bolus onset) were subtracted for noise. The first time frame was not used as it has slightly different acquisition parameters for TWIST.
Statistical analysisStatistical analysis was performed using R, version R 4.2.2 (R Foundation for Statistical Computing, 2021) and Excel, version 16.66.1 (22101101), (Microsoft, Redmond, Washington, USA). The statistically significant difference for all tests is set to p < 0.05.
T-tests were used for the quantitative image analysis and for the evaluation of diameter measurements. Multilevel mixed-effect proportional-odds models were used for the qualitative analysis. Multilevel mixed-effect proportional-odds models include the scores as an ordinal dependent variable, the sequence (GRASP vs. TWIST) as the fixed factor, and patient pseudo-ID and reader ID as random factors. The link function is logit (proportional odds). With such models, positive estimates indicate higher metrics for GRASP than for TWIST, suggesting better image quality or performance of TWIST over GRASP. On the contrary, negative values indicate higher metrics for TWIST than for GRASP, suggesting better image quality or performance of GRASP over TWIST.
留言 (0)