
記住我


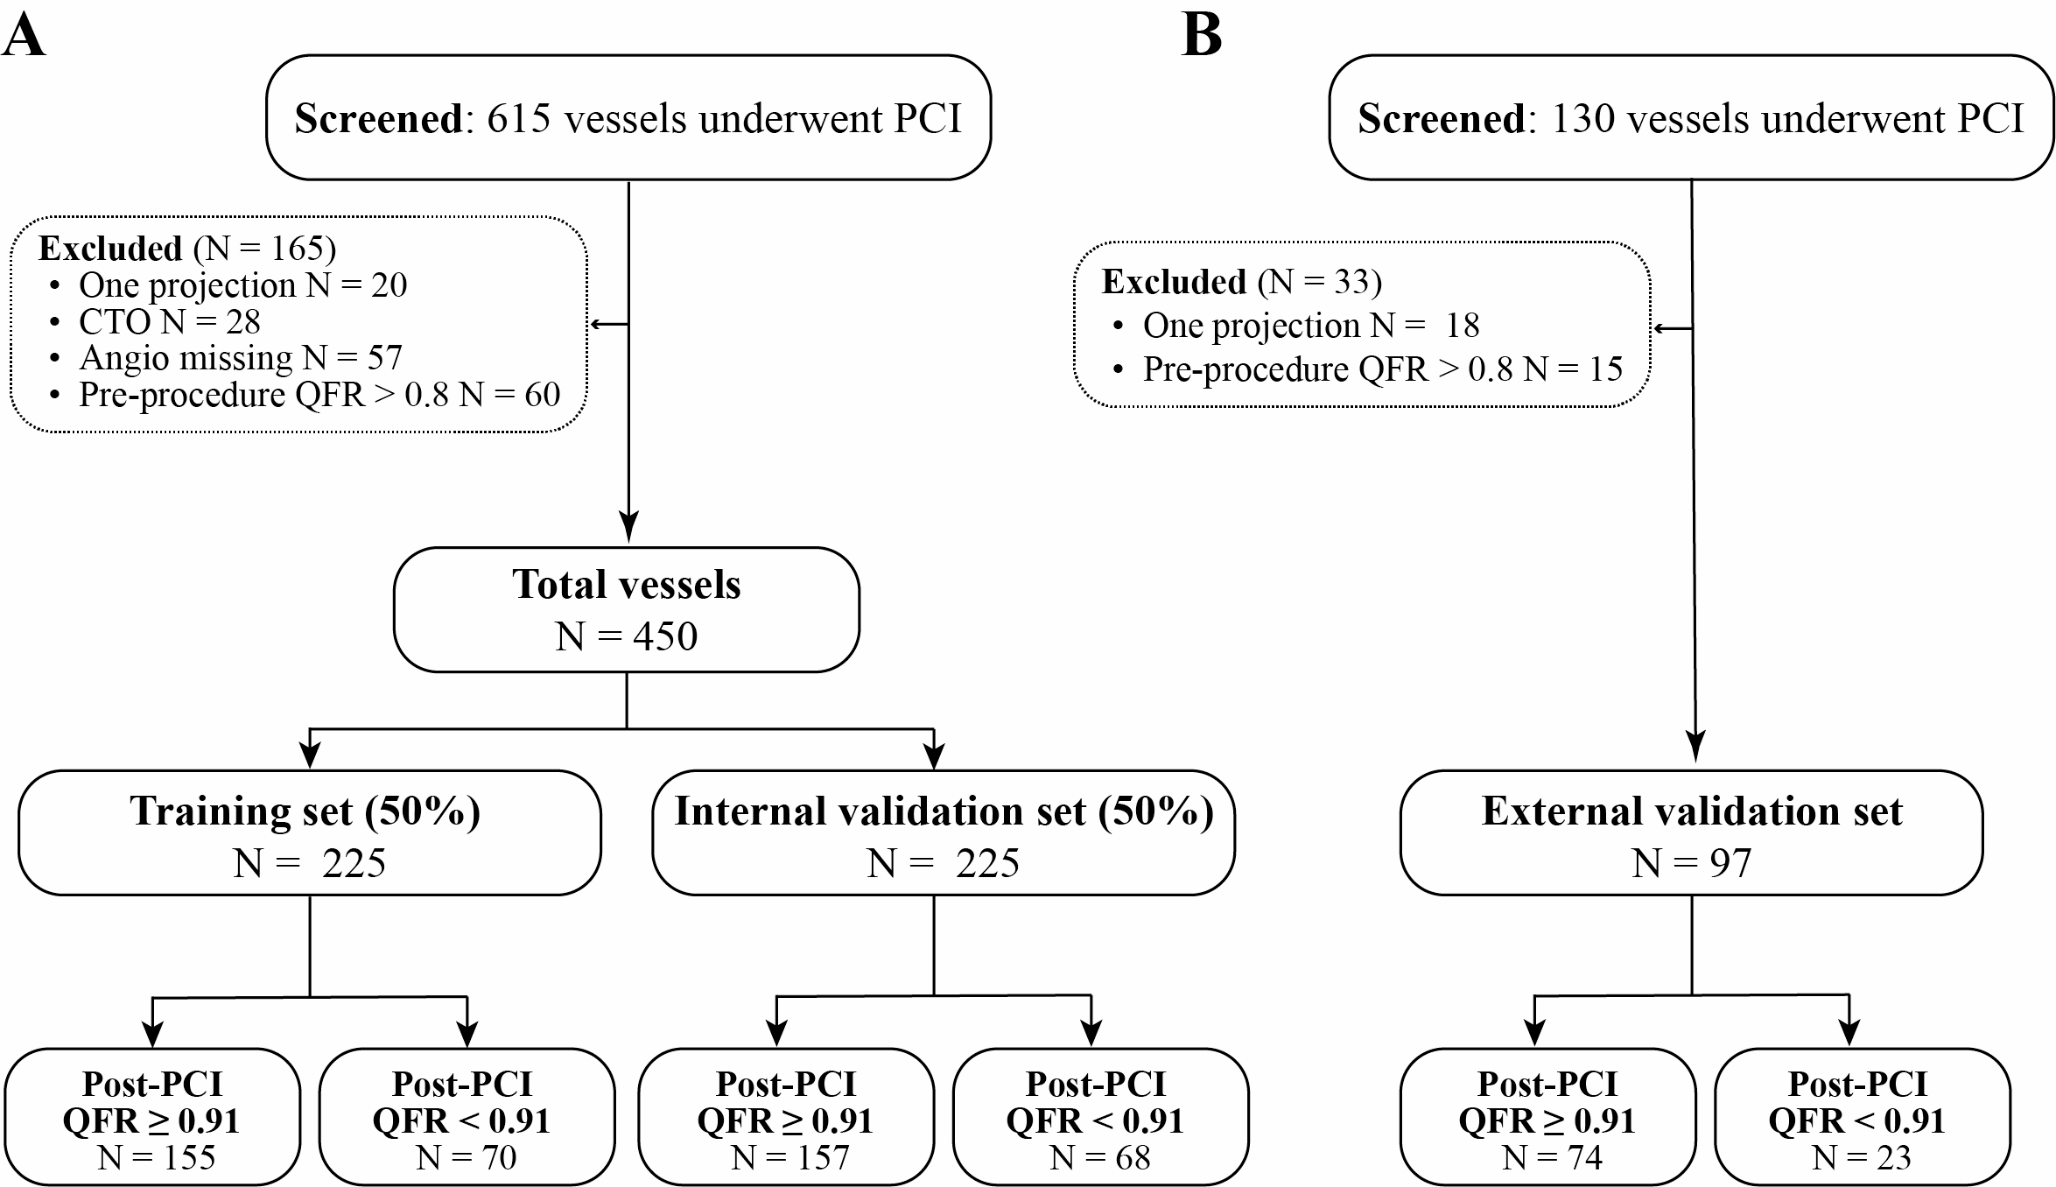


This study was approved by the Ethics Committee of the Sichuan Provincial People’s Hospital (approval number: 2022 − 357). In this retrospective study, it included adults suspected or diagnosed with obstructive CAD between October 2020 and March 2024. The inclusion criterion was having undergone CTP + coronary computed tomography angiography (CCTA) in addition to invasive coronary angiography (ICA) or fractional flow reserve (FFR) tests within 60 days (n = 66). The exclusion criteria were: (1) History of MI (n = 5) and acute coronary syndrome within the 14-days interval from either procedure, (2) Interventional coronary revascularization, stent placement (n = 6), or coronary artery bypass surgery, (3) Presence of alternative cardiac conditions, such as hypertrophic cardiomyopathy (n = 3), atrial fibrillation, congestive heart failure, hypertensive cardiomyopathy, (4) Severe chronic obstructive pulmonary disease, and (5) Insufficient quality of CTP and CCTA images to meet diagnostic and post-processing requirements (n = 5). Finally, 14 patients were excluded, and 48 patients with 144 coronary arteries were included in the final analysis (Fig. 1).
Fig. 1
Flowchart of participant inclusion
Basic patient information included age, sex, body mass index (BMI), heart rate, and CAD risk factors recorded using a picture archiving and communication system (Table 1). The dose-length product (DLP) of CTP was recorded, and the effective radiation dose (mSv) was calculated as DLP × k (k = 0.026 mSv). mgy− 1.cm− 1 [16].
Dynamic CTMyocardial perfusion imaging and CCTA protocolA third generation dual-source CT scanner (Somatom Force; Siemens Medical Solutions, Forchheim, Germany) was used for all CT examinations. The patients initially underwent a calcium score scan, with the range of the dynamic CTP scan determined based on the calcium score images to encompass the entire left ventricle (LV). Then, CCTA scans were conducted after resting for 5–10 min.
CTP scanAdenosine triphosphate disodium (ATP) was intravenously infused at 0.14 mg/kg/min to induce coronary artery relaxation. Following a 3 min injection, 40 ml of iodinated contrast agent (Iodine Myron, 400 mg/ml, Bracco, Italy) was administered, followed by 40 ml of normal saline at the same rate. The scan trigger delay was set to 4 s, and scanning was performed at the end of the systolic phase using the cradle-bed shuttle mode. The total scan duration was 32 s, with ATP infusion ceasing immediately after the scan. CARE kV and CARE Dose 4D were used to automatically adjust the voltage and current to minimize radiation exposure. The reconstructed layer thickness was 3 mm, with a layer spacing of 2.9 mm.
CCTA scanScans were acquired prospectively with electrocardiogram triggering by injecting 40–60 ml of iodinated contrast agent at a rate of 4–6 ml/s, followed by normal saline. The trigger scanning technology was employed with the trigger level set at the ascending aorta, a threshold of 100 HU, and an automatic 5 s delay before scanning. Automatic tube voltage (Care Kv, Care Dose 4D) was set at a reference tube voltage of 100 kV, reference tube current of 320 mAs, rotation time of 0.25 s, reconstructed layer thickness of 0.75 mm, and layer spacing of 0.5 mm.
Post-processing and image analysisThe CTP images were reconstructed using a dedicated kernel (Qr36) to reduce beam-hardening artifacts and analyzed using a CTP software package (myocardial perfusion analysis, Siemens Healthineers, Forchheim, Germany). Motion correction was manually applied to correct LV misregistration, and a hybrid deconvolution model was used to quantify the MBF. For quantitative analysis, the resulting perfusion data automatically generated the average MBF value of the LV, which was recorded as MBF-av. Subsequently, a region of interest (ROI) with a minimum size of 0.5 cm was manually delineated on the short-axis view of the LV in the lowest and highest perfusion regions within 1–16 myocardial segments (2 mm away from the endocardium and epicardium). The lowest and highest MBF values were automatically calculated and recorded as the MBF-lowest and MBF-hi, respectively. The resulting perfusion data were also sent to the Cardiac Function Analysis software (version 2.0.5, Siemens Healthcare, Germany) to automatically generate the average MBF values of the 1–16 myocardial segments in the same patient, with the third quartile MBF value of the segmental analysis recorded as MBF-Q3.
Relative MBF ratios were calculated using the following formula: Relative MBF ratio = MBF-lowest/reference MBF value. Therefore, three reference MBF values (MBF-hi, MBF-Q3, and MBF-av) were used to calculate the relative MBF ratios and were recorded as Ratio-hi, Ratio-Q3, and Ratio-av: Ratio-hi = MBF-lowest/MBF-hi; Ratio-Q3 = MBF-lowest/ MBF-Q3; Ratio-av = MBF-lowest/MBF-av. The perfusion territories of three major coronary arteries (left anterior descending artery-LAD, left circumflex artery-LCX, and right coronary artery-RCA) were evaluated for each patient.
Further analysis of the CCTA images was conducted using a Coronary Artery Analysis workstation (Syngo.via, Siemens Healthineers, Germany). The degree of stenosis (DS) in LAD, LCX, and RCA were calculated as (reference diameter - minimal lumen diameter)/reference diameter. Furthermore, the most severe type of stenosis was considered if multiple coronary artery stenoses were present within the same perfusion territory. Anatomic obstructive CAD was defined as ≥ 50% coronary stenosis. The ratio of the coronary artery volume to the myocardial mass (V/M) of the LV in patients were measured manually based on the CCTA images [17].
Two cardiac radiologists (with 5 and 7 years of experience, respectively) anonymously assessed the CTP and CCTA results independently. In cases of disagreement, a third senior cardiac radiologist (with over 15 years of experience) was consulted for the final judgment.
ICA and FFRInterventional cardiologists conducted ICA within 60 days of CTP and CCTA scans, analyzing ICA images unknown to the CCTA and CTP results. The FFR examinations were performed if the ICA results were 40–90%. The criteria for diagnosing functional myocardial ischemia are ICA ≥ 90% or FFR ≤ 0.8, whereas non-myocardial ischemia is indicated by FFR > 0.8 or ICA < 40%.
Statistical analysis was performed using IBM SPSS Statistics (version 26.0; IBM; Armonk, NY, USA) and Med Calc 15.2.0 software by Amazon. Categorical variables are presented as counts (%), and continuous variables as mean ± standard deviation (SD) or median. The normality of data was assessed using variance or t-tests for normally distributed data and the Mann–Whitney U test for non-normally distributed data. Group comparisons were performed using the non-parametric Kruskal–Wallis test or analysis of variance. Receiver operating characteristic (ROC) curves were plotted, the area under the curve (AUC) was compared using the DeLong test, and the optimal diagnostic cutoff value was determined using the Jorden test. The diagnostic performance at the optimal cutoff value was calculated. Statistical significance was set as a two-sided P-value of < 0.05.
留言 (0)