
記住我


Polycystic ovary syndrome (PCOS) is a prevalent heterogeneous disease worldwide, associated with endocrine and metabolic disorders, affecting approximately 5-10% of women of reproductive age (1). Hyperandrogenism, ovulatory dysfunction, polycystic ovaries detected via ultrasound, insulin resistance (IR), and obesity are common clinical features of PCOS (2). Patients with PCOS may produce morphologically normal metaphase II oocytes during in vitro fertilization and embryo transfer (IVF-ET) procedures, with alterations in oocyte competence being considered potential causative factors for infertility (3). While generally attributed to interactions among genetic, environmental, metabolic, neuroendocrine, and lifestyle factors, the underlying mechanism of PCOS, particularly its impact on oocyte competence, remains unclear (4, 5).
The microenvironment for oocyte development includes follicular fluid (FF), cumulus cells (CCs), granulosa cells (GCs), and oocytes (6). FF contains metabolites from various metabolic processes during oocyte and follicle development, which further support the growth of oocytes and follicles (7). Consequently, metabolic products in FF may have a more direct impact on oocyte quality compared to those in serum and urine (8). Analyzing metabolic changes in PCOS FF may not only aid in understanding pathology but also uncover the influence of metabolites on oocyte competence (9, 10). Some research has focused on identifying metabolic biomarkers and exploring the pathophysiological mechanisms of PCOS (9). Metabolomic studies in FF have identified imbalanced redox potential and increased oxidative stress as potential factors resulting from or contributing to PCOS (8). Dysfunctions in glucose, lipid, and amino acid metabolism might play an important role in the development of PCOS as revealed by metabolomic analysis (9). Certain metabolites, such as trilauric glyceride, decanoylcarnitine, homocysteine and 7β-Hydroxycholesterol, have been investigated as potential biomarkers and may contribute to impaired oocyte competence in PCOS patients (11, 12). Despite providing important information about changes in metabolites, uncertainty remains regarding the specificity of metabolomic biomarkers and pathways when using metabolomics alone (9). Therefore, complementary and surrogate approaches are still necessary to further confirm critical pathways in the pathogenesis of PCOS.
CCs, which surround the oocyte, originate from relatively undifferentiated GCs. The crucial roles of CCs in supporting follicular development have prompted numerous researchers to concentrate on this unique cluster of cells (13). Extensive investigation of genes in CCs and GCs has yielded new evidence for understanding the pathogenesis of PCOS (14, 15). CCs from PCOS patients exhibit abnormal gene expression, including dysregulated growth factors, cell cycle regulation, inflammatory function, metabolic pathways, and oxidative phosphorylation (14). Moreover, aberrant expression of miRNA and lncRNA in granulosa cells might contribute to the development of PCOS (16). Despite the generation of extensive gene expression data from various studies on the CCs transcriptome (17–19), the variability in study endpoints makes it challenging to link different pathways or mechanisms. Nonetheless, gene expression profiling obtained from transcriptomic research has shown significant diagnostic value and potential to elucidate the pathogenesis of PCOS.
A multi-omics approach could offer a method for identifying potential biomarkers and understanding the pathological mechanisms of diseases (16, 20–22). Our objective is to identify metabolic biomarkers using a multi-omics approach that are correlated with the pathological mechanisms of PCOS and compromised oocyte competence in IVF cycles. In this study, we conducted an untargeted metabolomic analysis of follicular fluid samples from patients with PCOS and controls without PCOS using liquid chromatography-mass spectrometry (LC-MS). Our aim was to identify key metabolic alterations unique to PCOS. Subsequently, we conducted transcriptomic analysis on corresponding cumulus cell (CC) samples to identify differentially expressed genes (DEGs). Finally, we integrated our metabolomic and transcriptomic data to elucidate disrupted pathways at both metabolic and transcriptional levels and identify potential diagnostic biomarkers for PCOS.
2 Methods2.1 Human subjectsSeventy-one women, aged 22-37 years, undergoing IVF, were recruited for this study. Among them, 36 patients had PCOS, and 35 controls did not. PCOS was diagnosed according to the revised 2003 Rotterdam criteria, which necessitate the presence of two out of three indicators: oligo- or anovulation, signs of clinical and/or biochemical hyperandrogenism, and polycystic ovaries on ultrasonography after excluding other etiologies (such as androgen-secreting tumors, congenital adrenal hyperplasia, and Cushing’s syndrome). The control group subjects had regular menstrual cycles, no signs of hyperandrogenism, and normal ovarian morphology as determined by ultrasonography. The 35 controls were recruited from women with serum FSH levels < 10IU/L and AMH levels > 1.5ng/mL on day 2 or 3 of the menstrual cycle, who participated in IVF-ET treatment due to fallopian tubal obstruction. To ensure ovarian reactivity in the control group, a follicle count of more than 5 was required on the day of human chorionic gonadotropin (HCG) trigger. Informed consent was obtained from all study participants. The study received approval from the local Ethics Committee of the Third Affiliated Hospital of Guangzhou Medical University (No. 2023-150).
2.2 Ovarian stimulation and samples collectionAll subjects underwent controlled ovarian hyperstimulation following our established protocols. When more than three follicles reached a diameter larger than 18 mm, human chorionic gonadotropin (hCG) was administered intramuscularly. Oocyte retrieval was conducted 36 hours after hCG injection using transvaginal ultrasound-guided needle puncture for follicles with a diameter greater than 14 mm. CCs were mechanically dissected from the oocytes under stereomicroscopy using a glass pipette with an inner diameter of 200 μm. CCs from each patient were pooled. The recovered CCs were washed with 1 ml of phosphate-buffered saline (PBS) and flash-frozen in liquid nitrogen. The CC samples were stored at -80°C until needed. After oocytes collecting, the follicular fluid paired with CCs, free from contaminating blood from the same patient, was combined and centrifuged at 12,000 rpm for 10 minutes. The supernatant was transferred to a 1.5 ml EP tube and stored at -80°C until analysis.
2.3 Embryo assessmentOocytes were inseminated with spermatozoa prepared by gradient centrifugation approximately 4-6 hours after follicle aspiration. Normal diploid fertilization was assessed 16-18 hours after insemination. Only oocytes displaying two visible pronuclei (2PN) were considered normal. The 2PN fertilization rate was calculated as the ratio of the number of oocytes with 2PN to the total number of inseminated oocytes. The cleavage rate was calculated as the ratio of the number of cleaved embryos to the number of oocytes with 2PN. Embryo quality on day 3 was assessed 68 hours after insemination. High-quality embryos on day 3, resulting from normal fertilization of oocytes, consisted of 6-8 cells, exhibited good cell-cell contact, were free from multinucleation, and had less than 10% volume fragmentation. The high-quality embryo rate was calculated by dividing the number of high-quality embryos by the 2PN cleavage number.
2.4 UPLC-MS/MS detectionUltra-performance liquid chromatography/tandem mass spectrometry (UPLC-MS/MS) analysis was conducted by Oebiotech Co., Ltd. (Shanghai, China). Briefly, 100 μl of samples were mixed with 10 μl of L-2-chlorophenylalanine (0.3 mg/ml) dissolved in methanol as the internal standard in a 1.5 ml EP tube, followed by vortexing for 10 seconds. Then, 300 μl of an ice-cold mixture of methanol and acetonitrile (2/1, vol/vol) was added, and the mixture was vortexed for 1 minute, followed by ultrasonication for 10 minutes in an ice-water bath. The extract was centrifuged at 13,000 rpm for 10 minutes at 4°C. The supernatants from each tube were filtered through 0.22 μm microfilters. Quality control (QC) samples were prepared by mixing aliquots of all samples to create a pooled sample. Metabolic profiling was performed using an ACQUITY UPLC BEH C18 (1.7 μm, 100×2.1 mm) system (Waters, Milford, USA) in both ESI positive and ESI negative ion modes. Mobile phases A and B consisted of water and acetonitrile/methanol (2/3, v/v), both containing 0.1% formic acid. The flow rate was 0.4 ml/min and column temperature was 45°C. The injection volume was 1 μl. Mass detection was performed using a QE-HF mass spectrum detector (Thermo Fisher Scientific, Waltham, USA) with mass spectrophotometer scanning. Data acquisition was conducted in both full scan mode (50-1000 m/z) and MSE mode. Metabolites were identified using Progenesis QI data processing software (Waters, Milford, USA). Principal component analysis (PCA) and (orthogonal) partial least squares-discriminant analysis (OPLS-DA) were performed to visualize the metabolic differences between groups. The metabolites with variable importance of projection (VIP) >1 and P< 0.05 were considered as differential metabolites.
2.5 Transcriptomic sequencingTotal RNA from CCs was extracted using the TRIzol Reagent Kit (Life Technologies, Carlsbad, USA) according to the standard protocol. RNA quality was assessed using a Nanophotometer spectrophotometer (IMPLEN, CA, USA) with 1% agarose gels. Total RNA was then purified using the RNeasy Mini Kit (QIAGEN, GmBH, Germany) and treated with the RNase-Free DNase Set (QIAGEN, GmBH, Germany) to minimize genomic contamination. mRNA was isolated from total RNA using poly-T oligo-attached magnetic beads and ribosomal RNA was removed. The harvested mRNA was fragmented randomly using divalent cations in the NEB fragmentation buffer. The first strand cDNA was synthesized from 3 μg of RNA using random hexamer primers and M-MuLV Reverse Transcriptase (RNase H). PCR was performed using Phusion High-Fidelity DNA polymerase, universal PCR primers, and Index (X) Primer. PCR products were purified using the AMPure XP system. The sequencing library was prepared using the RNA Library Prep Kit, diluted to 10 pM, and sequenced on the HiSeq X Ten (Illumina, USA) platform at Novogene Science and Technology Co., Ltd. (Beijing, China). Clean reads were obtained by filtering out reads containing adapters, poly-N sequences, and low-quality reads from the raw data. FPKM of each gene were calculated based on the gene length and the number of reads mapped to that gene. Differentially expressed genes (DEGs) were analyzed using the DESeq2 R package (version 1.28.1, http://www.bioconductor.org/packages/release/bioc/html/DESeq2.html). Gene Ontology (GO) and Kyoto Encyclopedia of Genes and Genomes (KEGG) pathway analyses were conducted using the R package (version 3.16.1, http://www.bioconductor.org/packages/release/bioc/html/clusterProfiler.html) to assess the statistical enrichment of DEGs.
2.6 Statistical analysisStatistical analysis was conducted using SPSS 25.0 (SPSS, Chicago, IL, USA). Continuous variables with a normal distribution were expressed as mean ± standard error of the mean (SEM) and analyzed using Student’s t-test. The frequency (composition ratio) of categorical data was statistically described and evaluated using the Chi-square test. Pearson correlation coefficient was utilized for correlation analyses. Statistical significance was defined as P< 0.05. Receiver operating characteristic (ROC) curves were fitted to identify candidate metabolites for discriminating PCOS based on the area under the curve (AUC).
3 Results3.1 Clinical characteristicsA total of 71 participants, with 36 in the PCOS group and 35 in the control group, were included in this study. The clinical information and assisted reproductive technology (ART) results are presented in Table 1. There were no significant differences in age, body mass index (BMI), follicle stimulating hormone (FSH), total testosterone (TT), serum total cholesterol (TC), or fasting glucose levels between the PCOS group and the control group. Antral follicle count (AFC), anti-Mullerian hormone (AMH), luteinizing hormone (LH), LH/FSH ratio, and triglyceride (TG) levels were significantly higher in patients with PCOS compared to controls (P< 0.05). There were no statistically significant differences in the number of retrieved oocytes, 2PN fertilization rate, or cleavage rate between the two groups. The high-quality embryo rate in PCOS patients was significantly lower than that in the controls (P< 0.05).
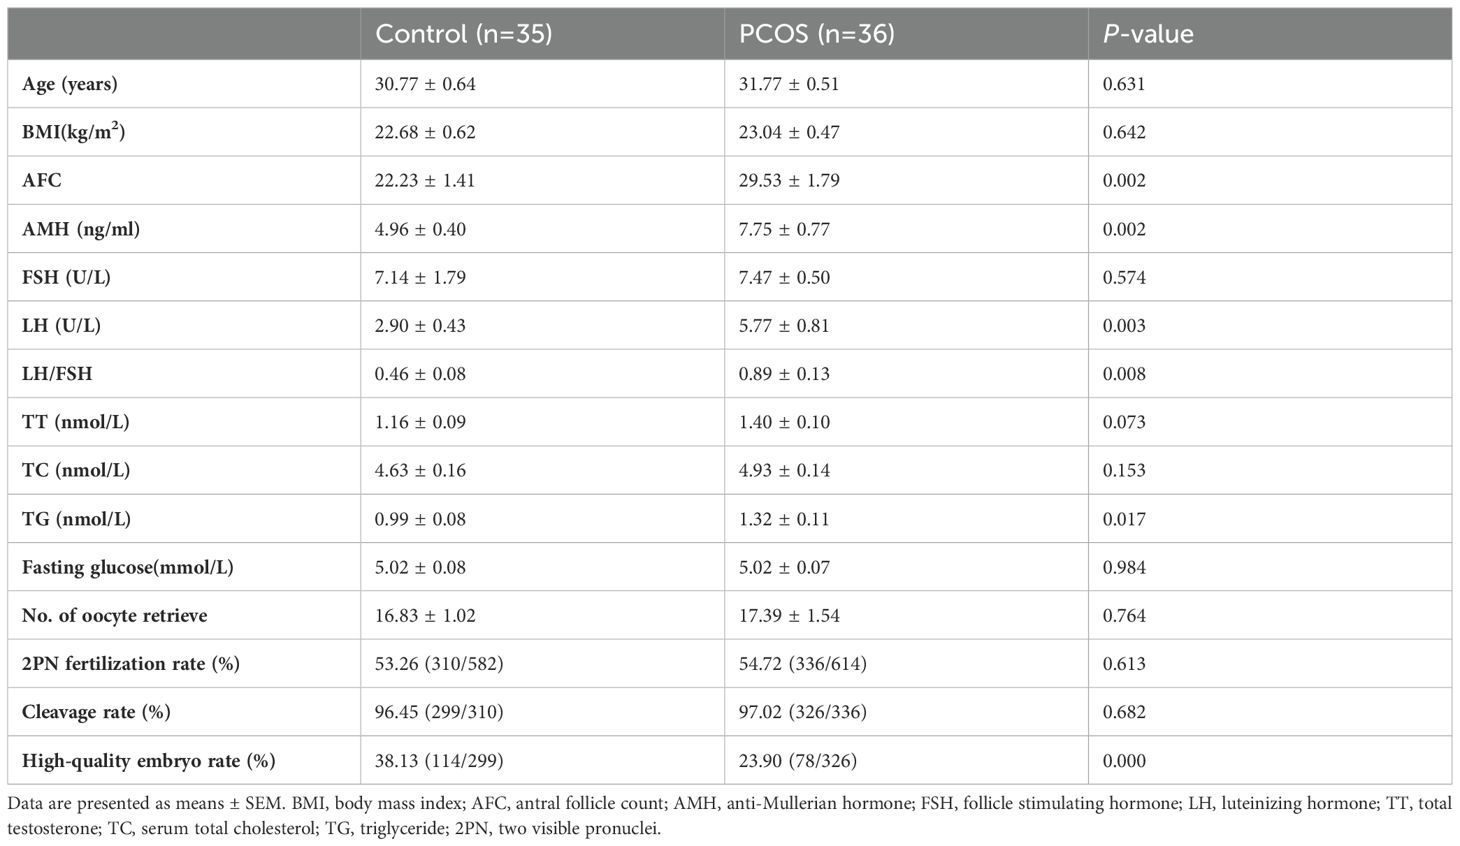
Table 1. Clinical information and ART results of PCOS patients and control subjects.
3.2 Identification of different metabolites and pathways associated with PCOSNon-targeted metabolic profiling of FF using UPLC-MS was conducted to provide an overview of metabolic changes in PCOS. The PCA and OPLS-DA models were employed to compare the metabolomic profiles of FF and assess the extent of diversity between PCOS patients and controls (Figure 1A). The PCA analysis revealed that this model could not distinguish between the control and PCOS groups. Supervised OPLS-DA was applied to the dataset to maximize group separation and identify discriminating metabolites, while eliminating factors unrelated to group differences. The OPLS-DA model resulted in a clearly discrimination between PCOS patients and healthy controls (R2X(cum) = 0.508, Q2(cum) = 0.626, Figure 1B). To prevent overfitting of the model, 7-fold cross-validation and 200 response permutation tests (RPT) were conducted to assess the model’s quality. With Q2 intercepting the y-axis at -0.662, the supervised model was effectively protected against overfitting (Figure 1C). The OPLS-DA results revealed significant metabolic differences between PCOS patients and healthy controls.
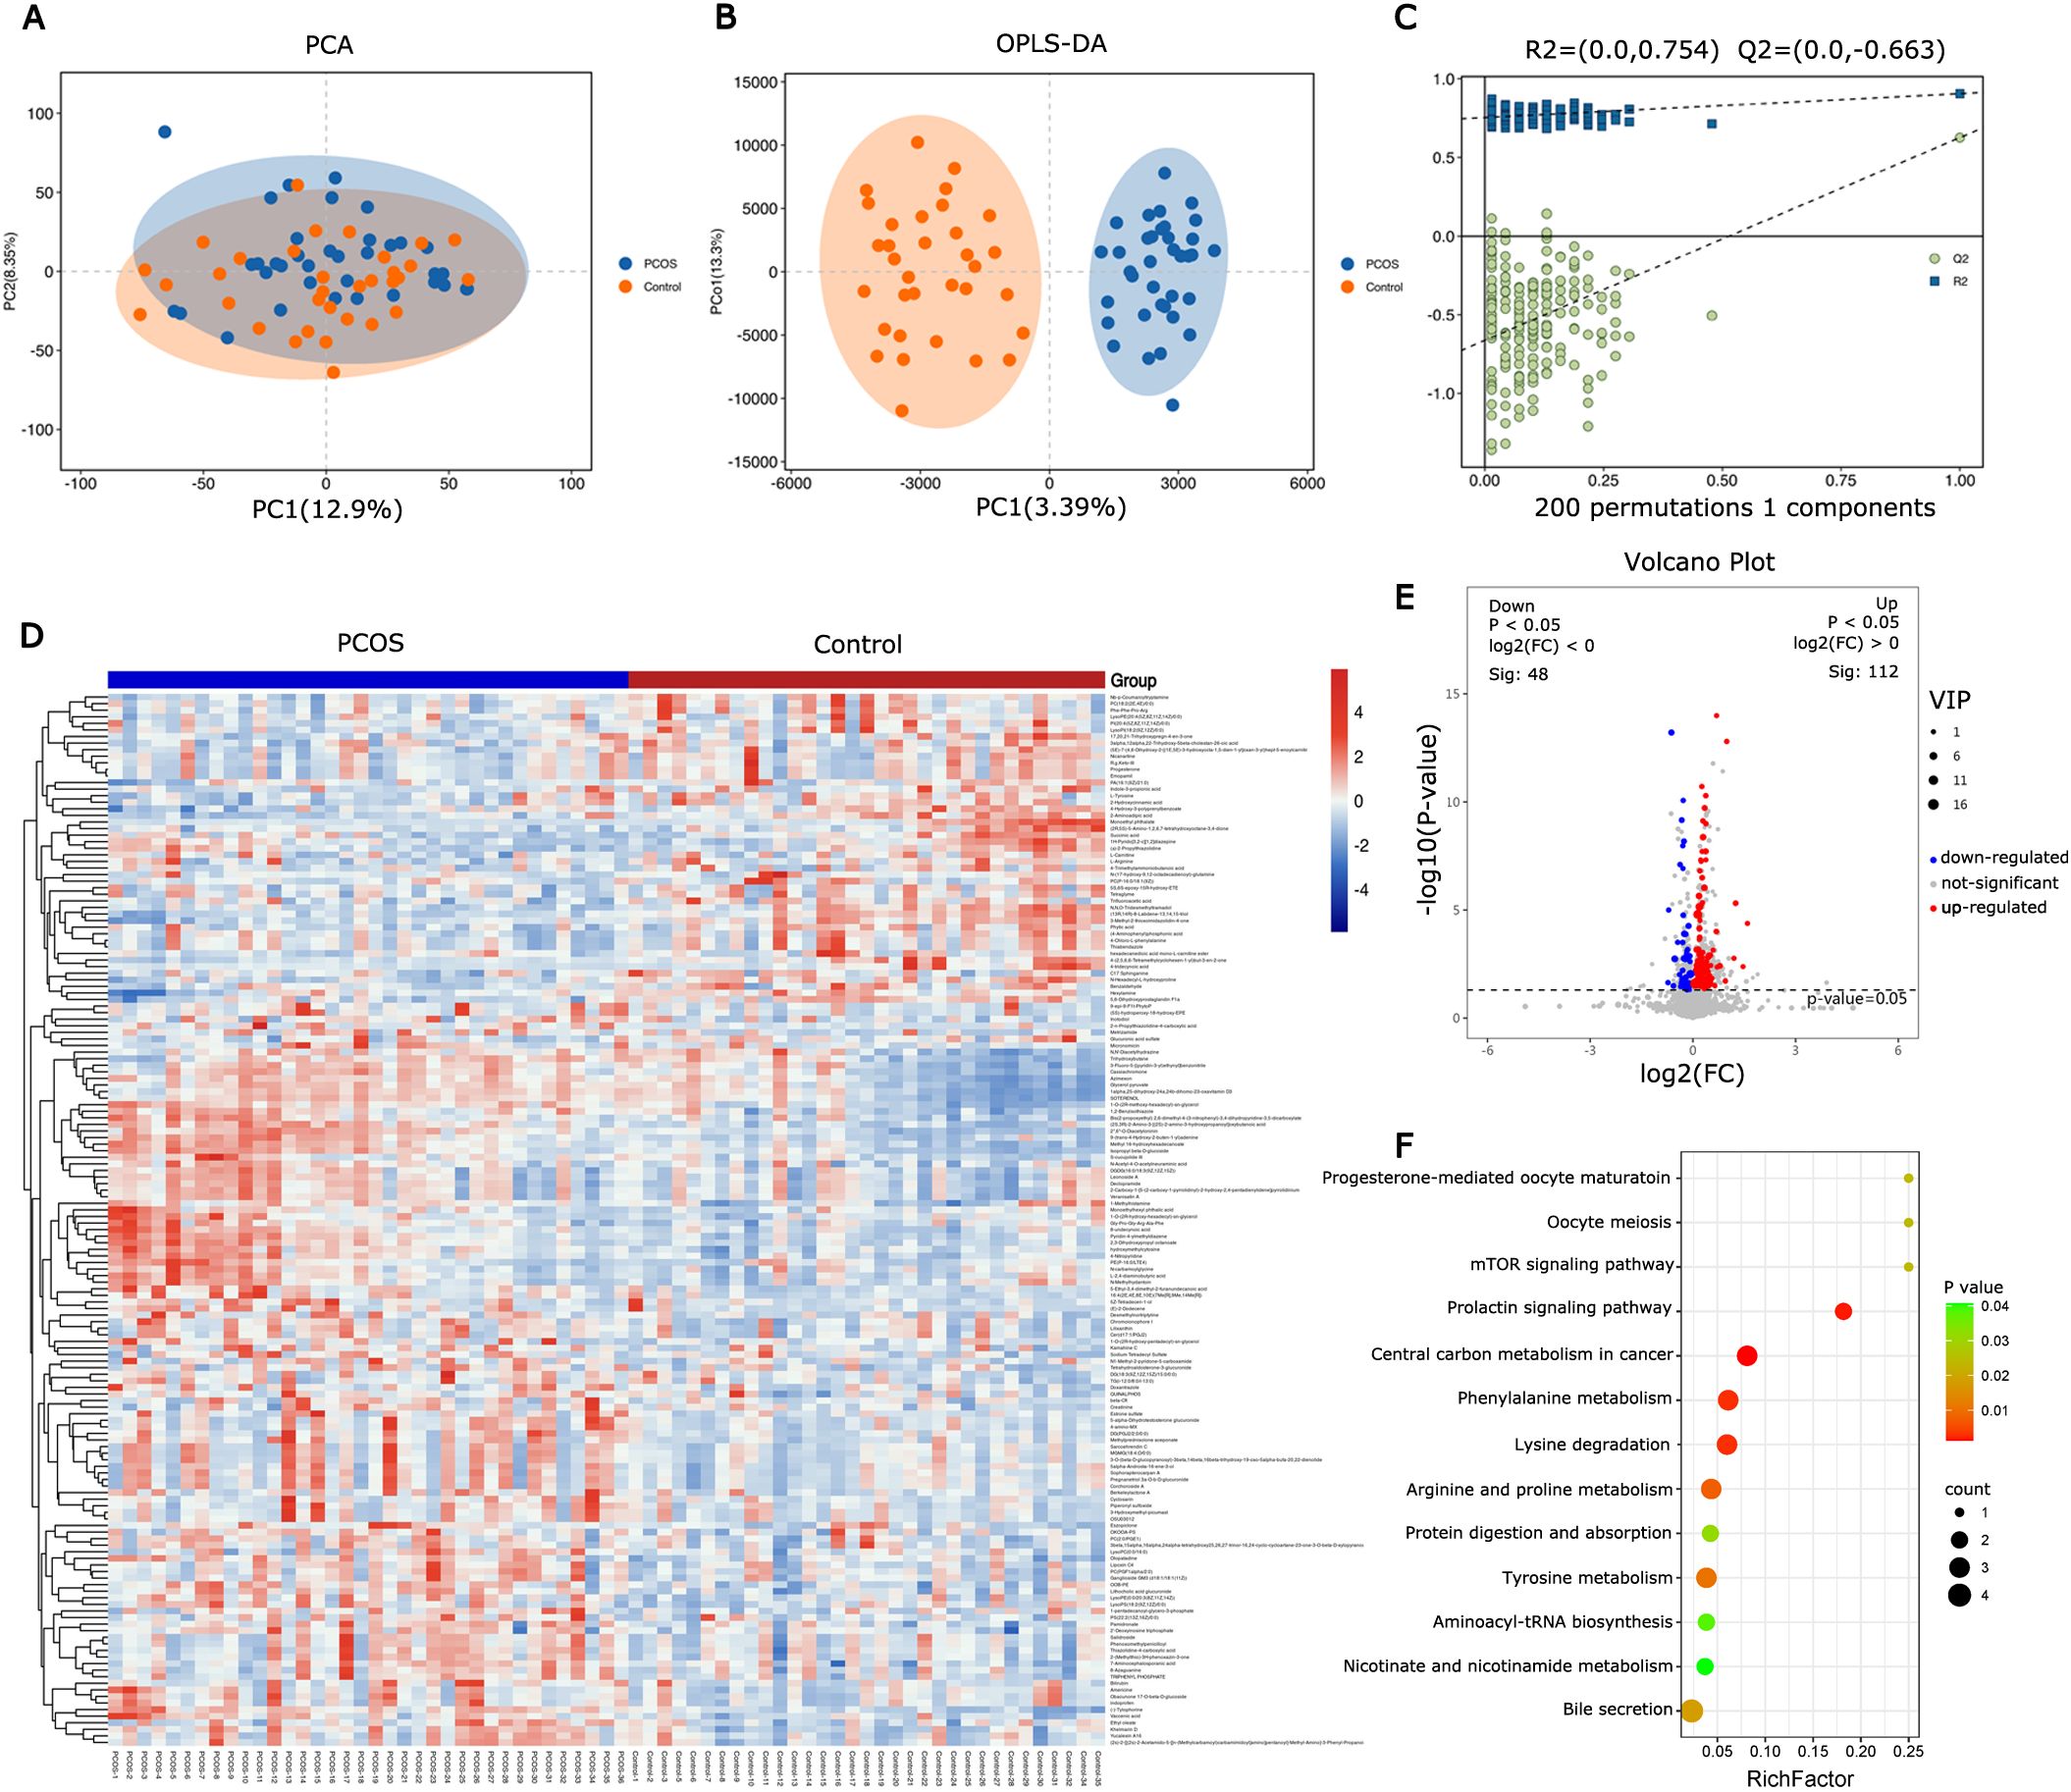
Figure 1. Metabolite and pathway changes in PCOS follicular fluid. (A) PCA scores plot and (B) orthogonal projections to latent structures-discriminant analysis (OPLS-DA) scores plot based on the metabolic profiling data obtained from follicular fluid of PCOS patients and control women. (C) OPLS-DA model was constructed and verified by the permutation test (R2 = 0.754, Q2 = -0.663). (D) Heatmap of differential metabolites from follicular fluid between PCOS and control. (E) Volcano map of differential metabolites. (F) Bubble chart of enriched KEGG pathway for the differential metabolites in follicular fluid from PCOS and control.
Hierarchical clustering was employed to analyze the expression levels of all significantly different metabolites (Figure 1D). Differential metabolites were screened using VIP≥ 1 and t-test P< 0.05 as the screening criteria. A total of 160 differential metabolites were identified between PCOS patients and controls, with 112 up-regulated and 48 down-regulated in PCOS follicular fluid (Figure 1E). KEGG analysis was conducted on the different metabolites, and metabolic pathways with a P value < 0.05 were selected. The results indicated that the metabolic pathways were predominantly enriched in amino acid metabolism and carbohydrate metabolism (Figure 1F).
3.3 Screening of DEGs in CCs and its functional analysisTranscriptional profiling of the corresponding cumulus cells (CCs) samples was conducted to trace upstream variations in the metabolome. In CCs of PCOS patients, 547 DEGs (|log2FC|>1, P<0.05, 395 up-regulated, 152 down-regulated) were identified compared to the control group (Figures 2A, B). Functional analysis of DEGs was conducted using GO and Kyoto Encyclopedia of Genes and Genomes (KEGG) enrichment analyses. The DEGs were co-enriched in 3371 GO terms, with biological process (BP) accounting for 2272/3371, molecular function (MF) accounting for 444/3371, and cell component (CC) 655/3371 (Figure 2C). A total of 362 GO terms were significantly enriched (P< 0.05). KEGG analysis of DEGs revealed significant enrichment in lipid metabolism, carbohydrate metabolism, amino acid metabolism, and signal transduction pathways (Figure 2D).
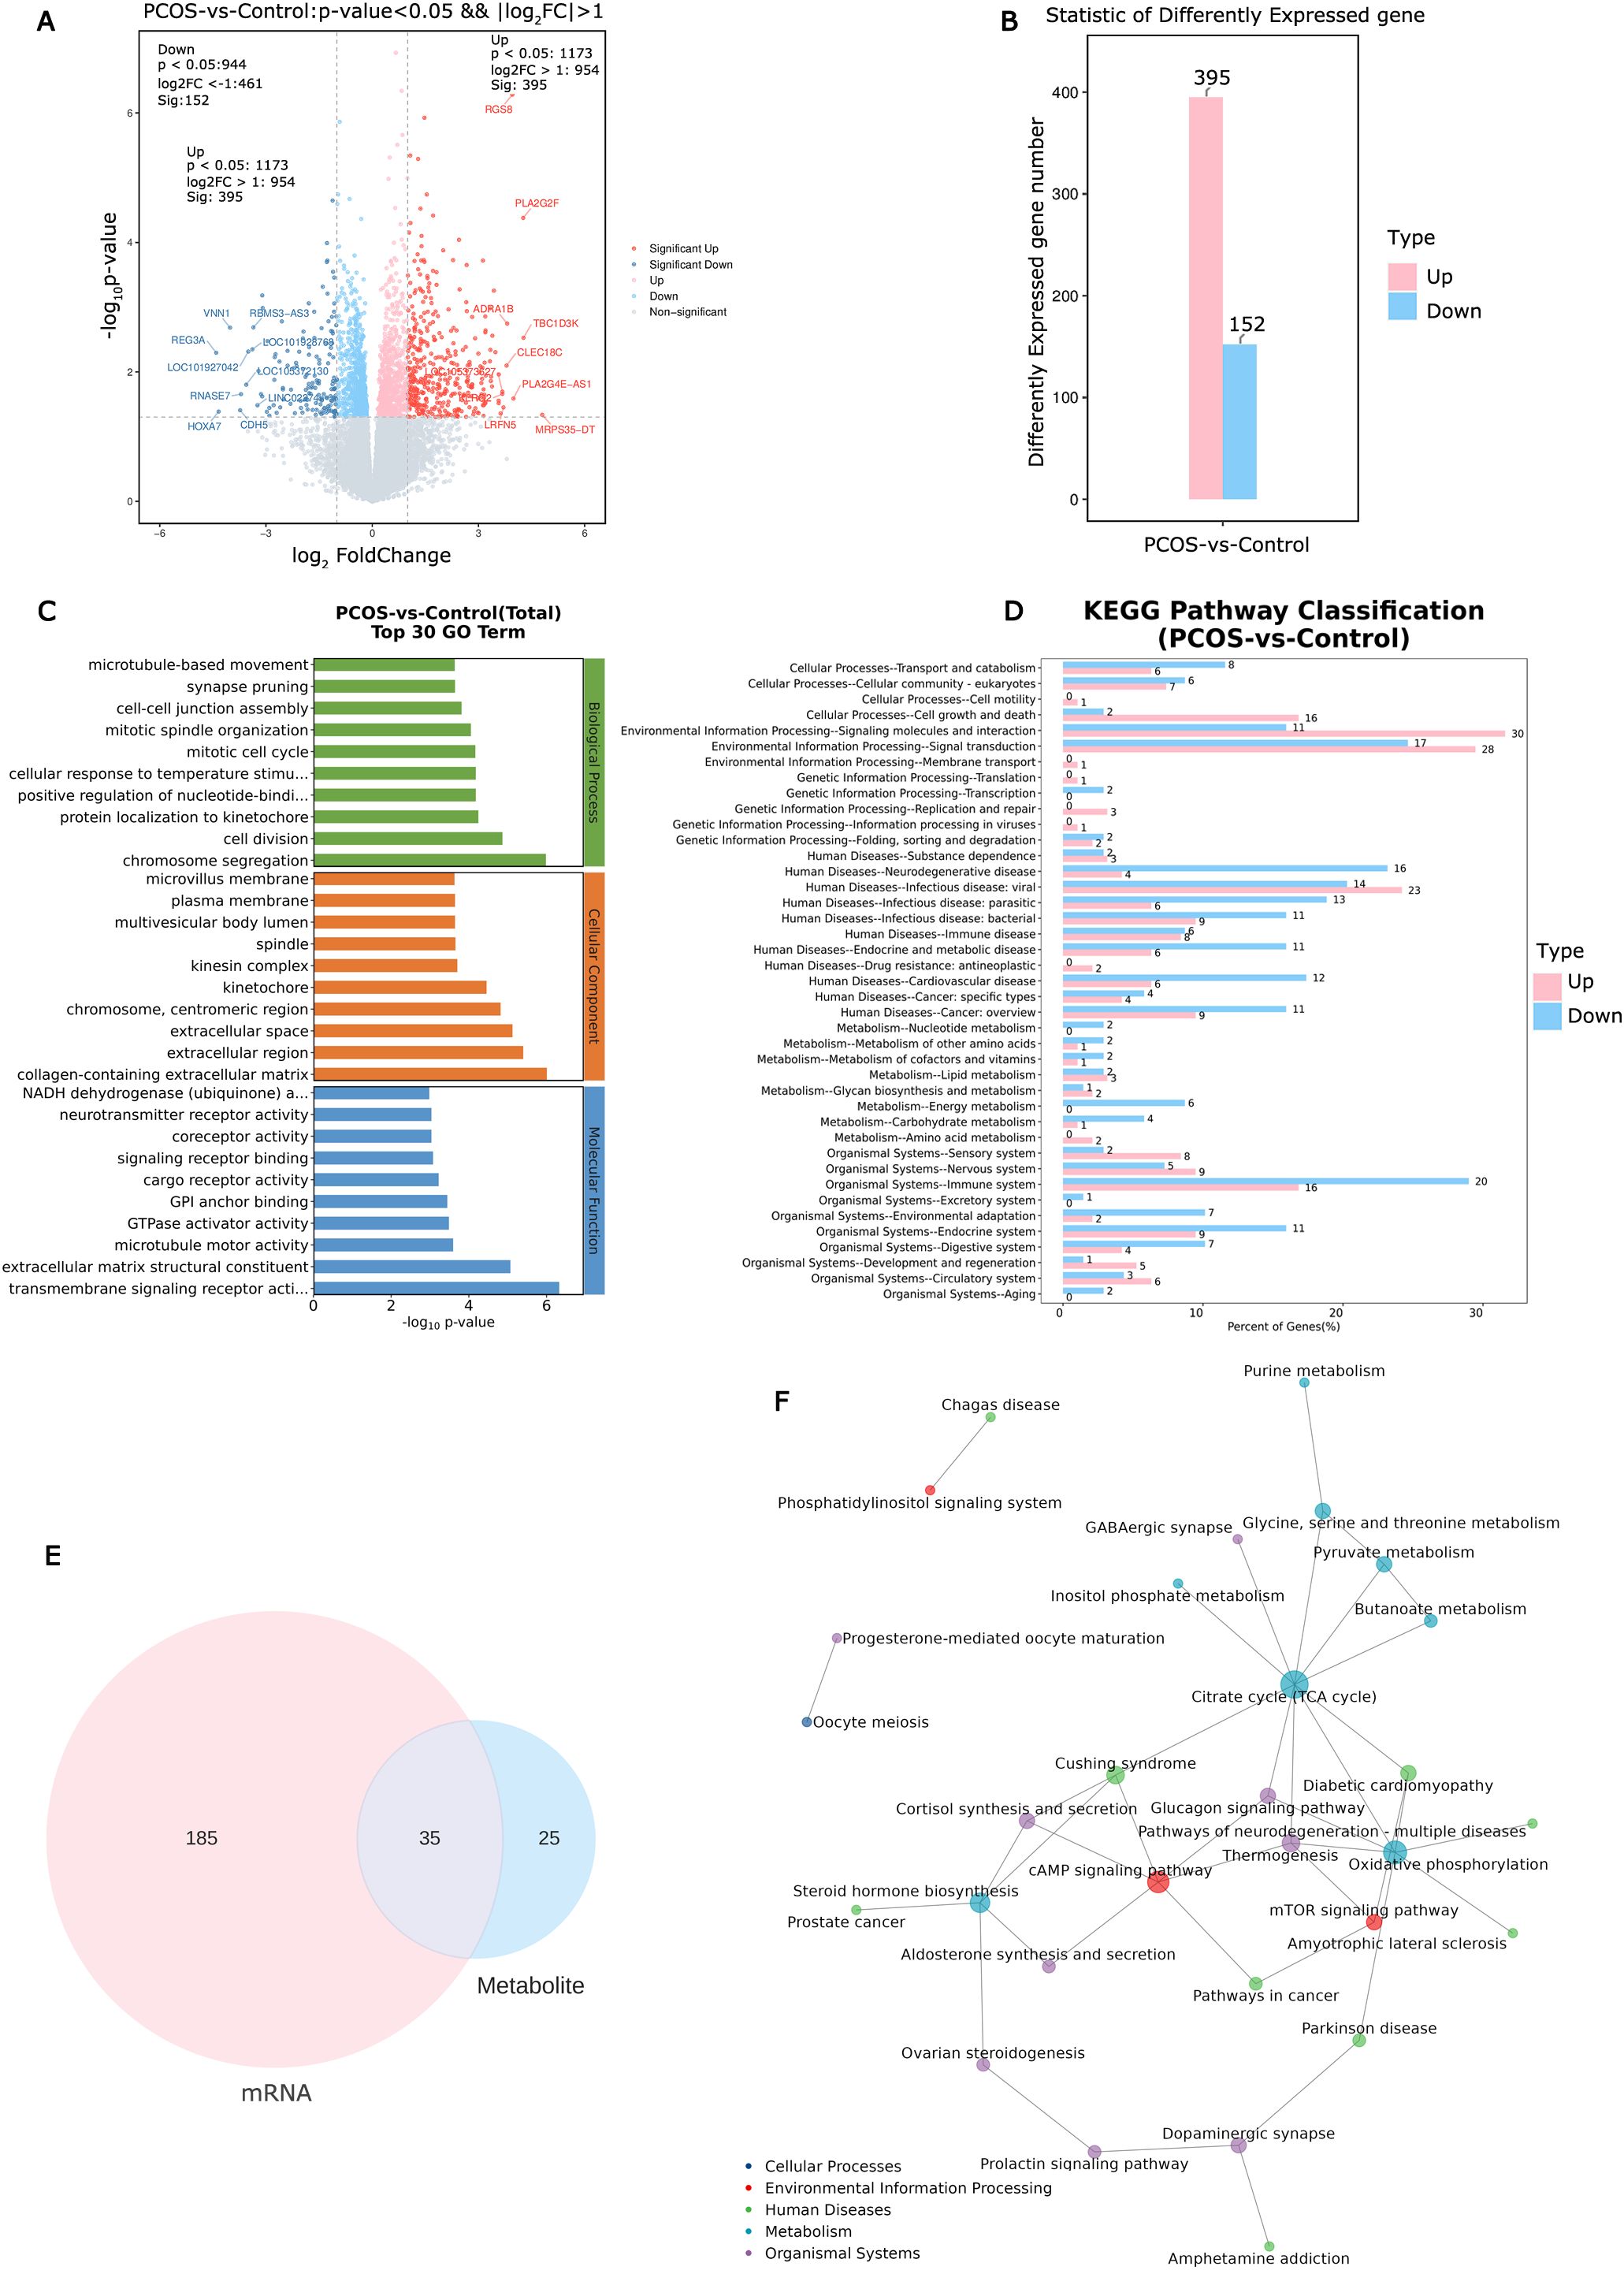
Figure 2. Identification and analysis of differential expression genes in cumulus cells and altered pathways in PCOS. (A) The volcano plot of differential expression genes in PCOS cumulus cells. (B) Statistic results of up- and down-regulated differential expression genes in PCOS cumulus cells. (C) Enriched top 30 GO terms of differential expression genes. (D) Enriched KEGG pathways of differential expression genes. (E) Metabolic and transcriptional analysis identified 35 pathways that were significantly altered in PCOS. (F) KGML network building based on the differential expression genes and differential metabolites to obtain the critical metabolism pathways.
3.4 Association analysis of metabolome and transcriptome reveals the altered pathways in CCsMetabolic pathway analysis and gene set enrichment analysis revealed 35 significantly altered pathways at both the metabolomic and mRNA expression levels (Figure 2E). These pathways include the citrate cycle (TCA cycle), oxidative phosphorylation, cAMP signaling pathway, mammalian target of rapamycin (mTOR) signaling pathway, and steroid hormone biosynthesis (Figure 2F). Of the 35 altered pathways, 10 metabolites exhibited significant differences based on metabolic profiling data (P< 0.05, Figure 3A).
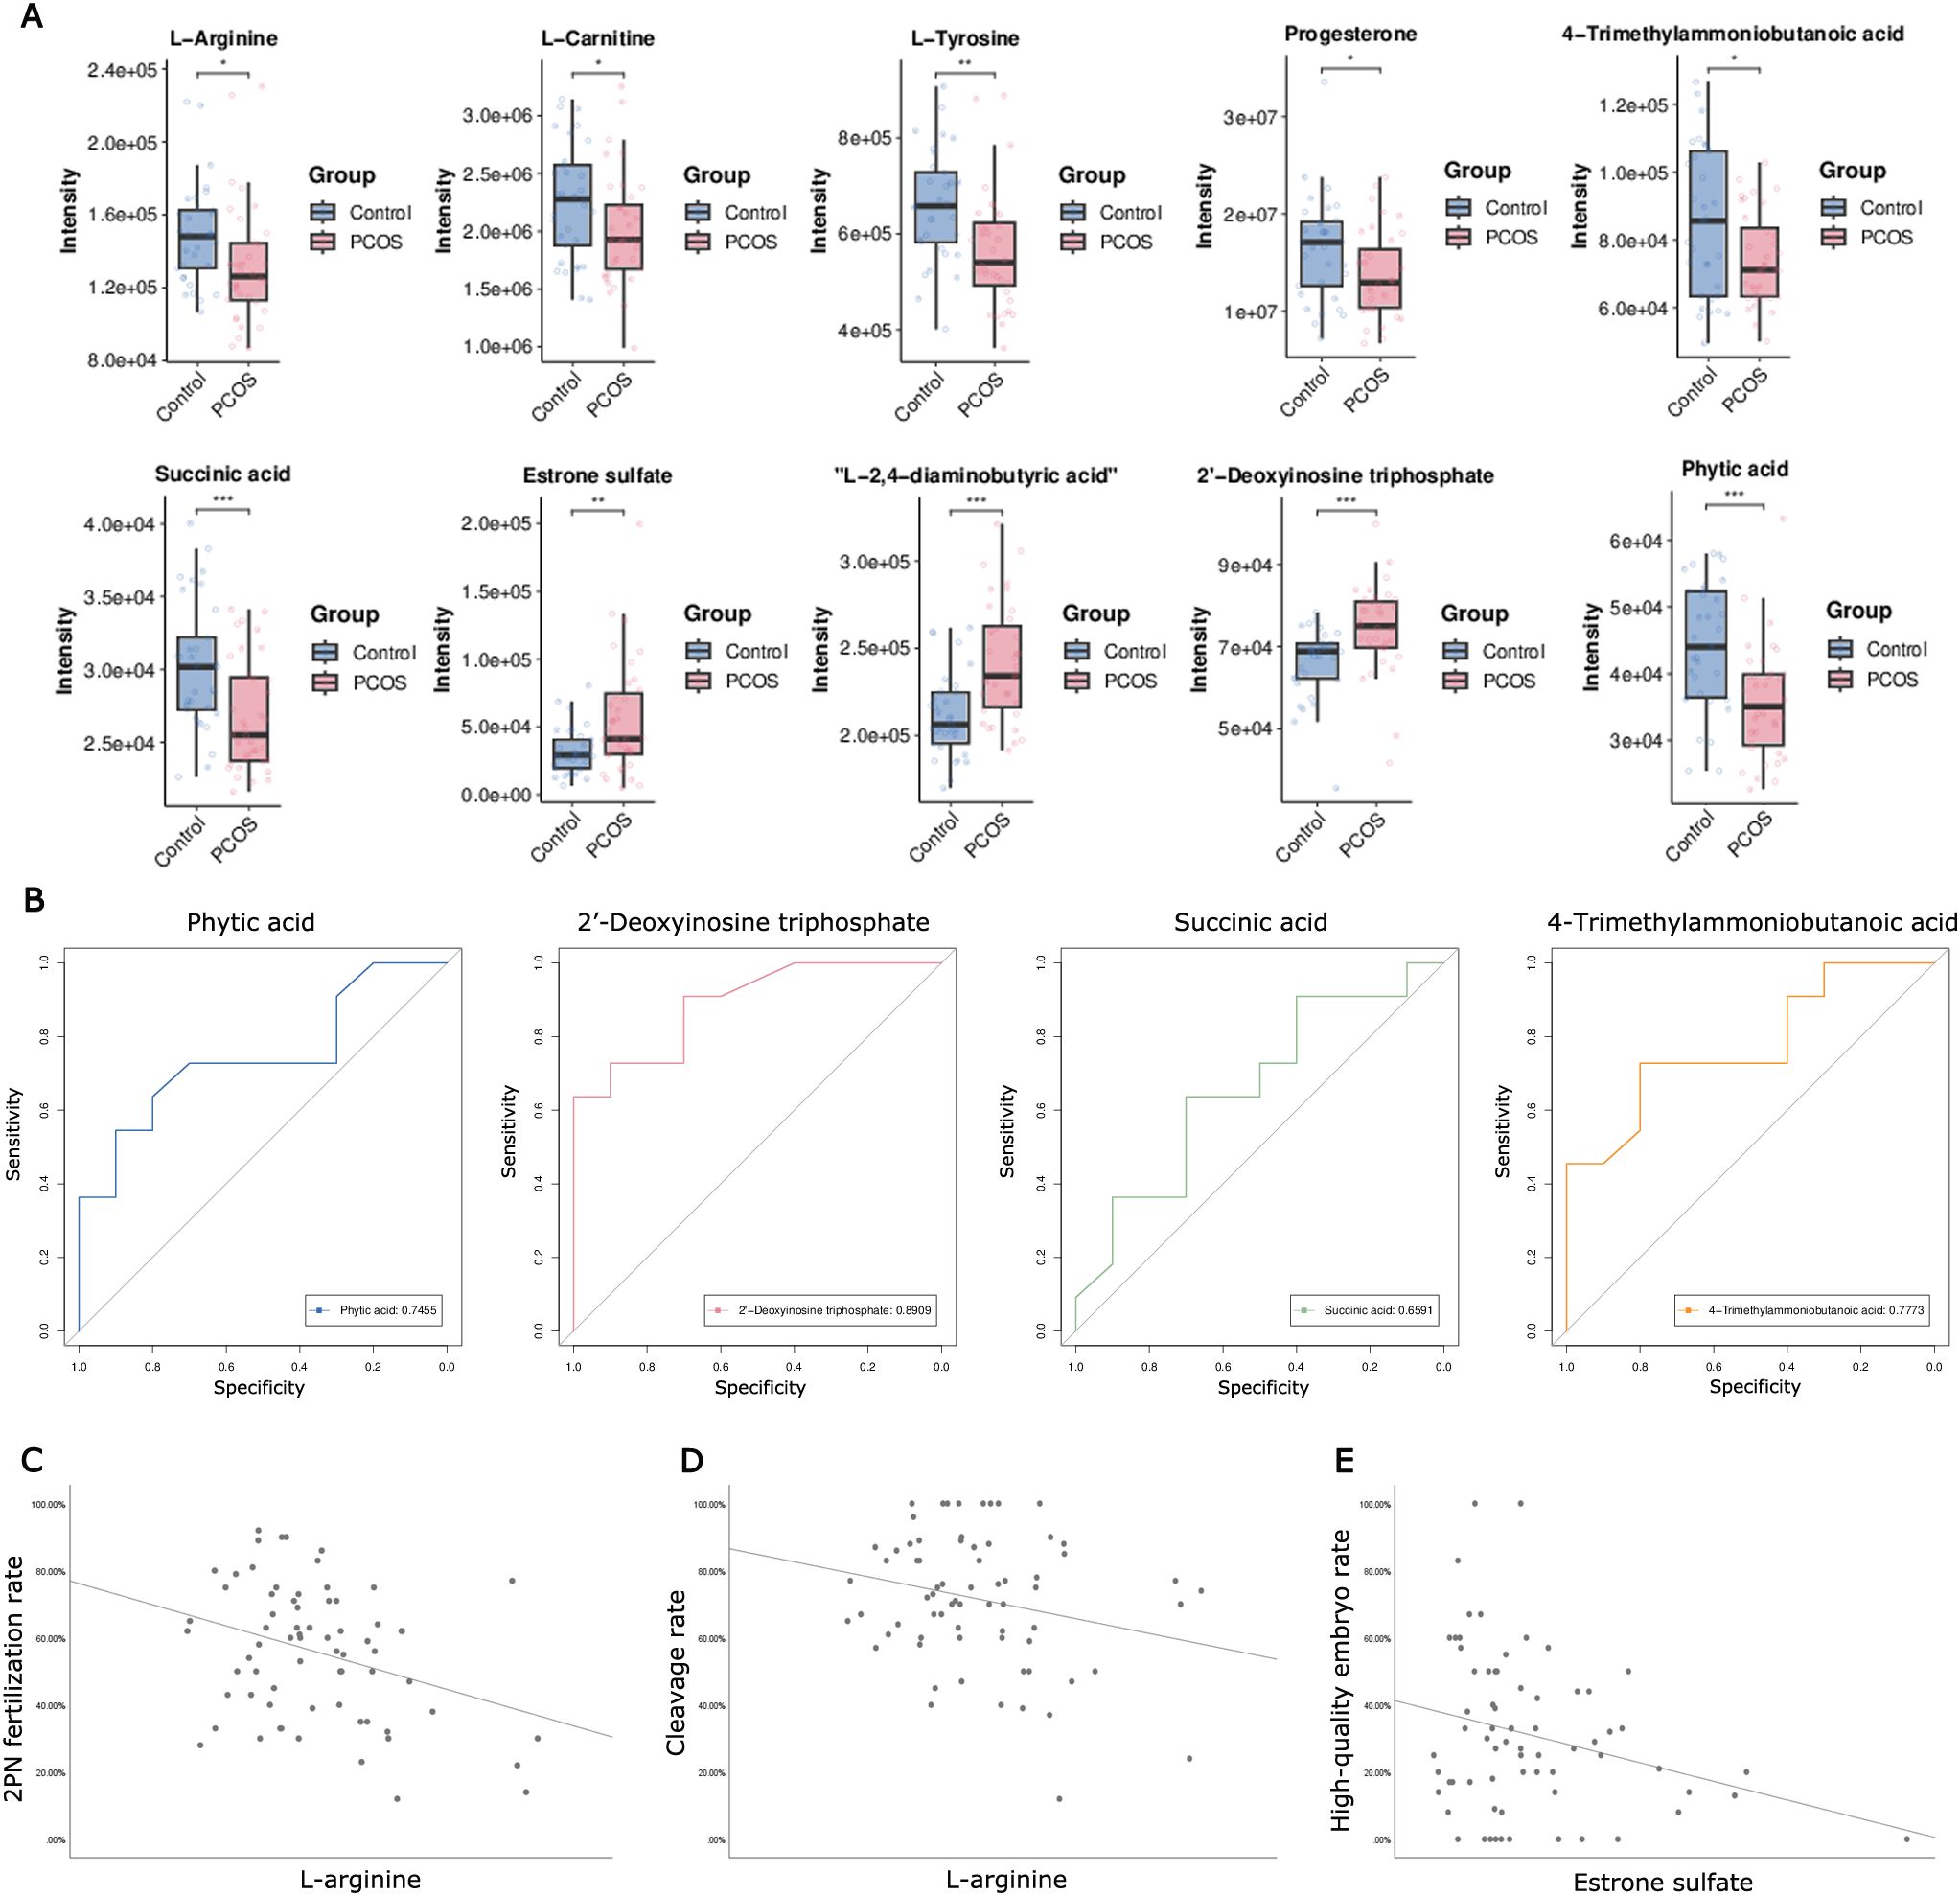
Figure 3. Metabolites analysis based on altered pathways at both the metabolomic and mRNA expression levels, and Pearson correlations analysis between candidate metabolites in FF and the parameters of oocyte competence. (A) The changes in relative levels of identified metabolites involved in the significant pathways (*P< 0.05; **P< 0.01; ***P< 0.001). (B) Receiver operating curves (ROC) of potential biomarkers for PCOS. (C) Scatter plot of 2PN fertilization rate and intrafollicular L-arginine level (P< 0.05). (D) Scatter plot of cleavage rate and intrafollicular L-arginine level (P< 0.05). (E) Scatter plot of high-quality embryo rate and estrone sulfate level (P< 0.05).
3.5 The candidate value of metabolites in FF for PCOSROC curve analysis was employed to determine the predictive value of 10 metabolites for PCOS, obtaining the AUC, 95% CI, specificity, and sensitivity. Typically, an area under the ROC (AUC) greater than 0.65 is considered indicative of better predictive performance; therefore, only results with an AUC greater than 0.65 are listed. As depicted in Figure 3B, the AUC values for phytic acid, succinic acid, 2’-deoxyinosine triphosphate, and 4-trimethylammoniobutanoic acid were 0.746 (0.525-0.966), 0.659 (0.414-0.904), 0.891 (0.756-1.000), and 0.777 (0.572-0.982), respectively (Figure 3B). Considering biological and statistical factors, phytic acid, succinic acid, 2’-deoxyinosine triphosphate, and 4-trimethylammoniobutanoic acid in FF may serve as potential biomarkers of PCOS.
3.6 Effects of metabolic perturbation on ART resultsTo investigate the metabolic effects on ART outcomes, Pearson correlations were calculated between 10 selected metabolites in FF and oocyte competence parameters. L-arginine showed a negative correlation with the 2PN fertilization rate and cleavage rate among these candidate FF metabolites (P< 0.05, Figures 3C, D). Estrone sulfate exhibited a negative correlation with the high-quality embryo rate in the overall sample cohort (P< 0.05, Figure 3E).
4 DiscussionIn this study, we integrated metabolomics and transcriptomics data, identifying 35 significantly altered pathways at both the metabolic and transcriptional levels, including the citrate cycle (TCA cycle), oxidative phosphorylation, cAMP signaling pathway, mTOR signaling pathway, and steroid hormone biosynthesis. Among these altered pathways, we identified 10 metabolites using metabolic profiling data. According to ROC analysis, phytic acid, succinic acid, 2’-deoxyinosine triphosphate, and 4-trimethylammoniobutanoic acid may serve as potential biomarkers of PCOS. Furthermore, we demonstrated that L-arginine and estrone sulfate were closely associated with the 2PN fertilization rate, cleavage rate, and high-quality embryo rate in the IVF cycle.
Metabolomic analysis of FF is a crucial method for elucidating the mechanisms underlying metabolic disorders associated with PCOS (9). Potential biomarkers and various pathways implicated in PCOS include those associated with glucose metabolism, amino acid metabolism, and lipid metabolism (7, 23). However, a single metabolomic change in follicular fluid cannot fully reflect the metabolic activity of specific cells (24). This is primarily because FF contains products from the microenvironment of follicle growth and oocyte development, including cumulus cells, granulosa cells, and oocytes (25). Thus, metabolomic analysis of follicular fluid can only offer limited insights into understanding the underlying pathological mechanism of PCOS. Considering that functional genes play a crucial role in cell metabolism, quantitative analysis of mRNA using high-throughput microarray analysis may also yield significant insights into cell metabolism. Therefore, a combined approach may offer a more comprehensive solution than either approach alone for understanding the pathological mechanisms of diseases (21). In this study, we integrated data from metabolomics and transcriptomics and identified 35 significantly altered pathways, including the citrate cycle (TCA cycle), oxidative phosphorylation, cAMP signaling pathway, mTOR signaling pathway, and steroid hormone biosynthesis. The results provided a comprehensive and updated understanding of the pathogenesis of PCOS.
The TCA cycle plays a central role in cellular metabolism and the regulation of energy homeostasis (26). Inactivation of the TCA cycle results in reduced intracellular levels of ATP and cAMP, thereby affecting the activation of the Ras1-regulated cAMP signaling pathway (27). Studies have identified the TCA cycle and glucose metabolism as the major pathways disrupted in PCOS, which have been proposed as possible links with adipokines (28, 29). Impaired oxidative phosphorylation reduces adenosine triphosphate (ATP) production, potentially contributing to the metabolic and hormonal dysregulation seen in PCOS (30). CCs from PCOS patients were found to have deficiencies in TCA cycle function (8). Succinate is an intermediate in the TCA cycle and plays a crucial role in mitochondrial ATP production. It may impact the developmental potential of oocytes from PCOS patients due to its inflammatory signaling role (31). In our study, the level of succinic acid was significantly reduced in PCOS patients. The decreased level of succinic acid may significantly contribute to the insufficient TCA cycle and abnormal cAMP signaling pathway in PCOS patients.
mTOR is a serine-threonine protein kinase situated downstream of the phosphatidylinositol 3-kinase (PI3K)-Akt pathway (32). This pathway regulates diverse processes, such as cell growth, proliferation, metabolism, and angiogenesis (33). The mTOR signaling cascade has been recently investigated in ovarian follicles, where it controls the proliferation and differentiation of granulosa cells (34). Several studies have proposed that the mTOR signaling system is implicated in the pathophysiological mechanisms of PCOS (35, 36). Overexpression of the mTOR pathway can disrupt cumulus cell interaction, induce insulin resistance, and directly impact follicle growth (37). Abnormalities in mTOR signaling during follicular development result in various pathologies, including premature ovarian insufficiency (POI) and infertility (33). Arginine serves as a direct activator of mTOR and promotes follicular development by stimulating the proliferation of granulosa cells (38). In our study, the arginine level in FF was significantly lower in PCOS women compared to the controls. This result was consistent with previous findings obtained from serum samples of PCOS patients (39). Furthermore, we found that the arginine level in FF correlated with the 2PN fertilization rate and cleavage rate. These findings suggest that the reduced arginine levels in FF might influence follicle development via the mTOR signaling pathway.
PCOS is the most prevalent endocrine disorder affecting female reproductive health, characterized by chronic low-level inflammation and hormone imbalances (40). Inflammation will impair meiotic and cytoplasmic maturation of the oocyte which damages its developmental competence for fertilization and embryo development (41). PCOS patients typically exhibit low levels of progesterone (42). Consequently, the reduced progesterone levels in PCOS lead to immune system overstimulation, thereby increasing estrogen production (40). Estrone sulfate is the predominant estrogen precursor present in the circulation of both women and men (43). Our findings revealed elevated levels of estrone sulfate and significantly reduced progesterone levels in the FF of PCOS patients. These findings align with prior research conducted on plasma samples from PCOS patients (44). Furthermore, estrone sulfate levels in FF exhibited a negative correlation with the rate of high-quality embryos. Discrepancies in estrone sulfate and progesterone levels between the control and PCOS groups suggest their potential involvement in PCOS development and oocyte quality.
PCOS is a complex disorder characterized by a lack of standardized diagnostic criteria, posing challenges for diagnosis (45). Metabolomics, the newest addition to the “omics” family, has been employed to discover potential biomarkers for PCOS (46, 47). Recent studies have identified novel potential FF biomarkers in PCOS patients using a metabolomic approach (11, 48). The ROC curve is commonly used to assess the diagnostic power of biomarkers. In this study, ROC analysis was conducted on differential candidate metabolites to explore their potential as biomarkers for PCOS diagnosis. The results revealed that the AUC values for phytic acid, succinic acid, 2’-deoxyinosine triphosphate, and 4-trimethylammoniobutanoic acid were 0.746, 0.659, 0.891, and 0.777, respectively. Studies have shown that phytic acid possesses antioxidant properties and can scavenge free radicals, which may be detrimental to follicular development (30, 49). 4-trimethylammoniobutanoic acid serves as a precursor to L-carnitine, which plays a crucial role in fatty acid metabolism and their transport across the mitochondrial membrane to the mitochondrial matrix, where β-oxidation of fatty acids (FAs) takes place. Studies have reported that decreased L-carnitine levels could lead to abnormalities in these processes in PCOS, and L-carnitine supplementation might positively impact fertility (9). These findings suggest that phytic acid, along with two other potential biomarkers, may provide valuable diagnostic insights into PCOS.
Although the integration of transcriptomics and metabolomics approaches has provided better insights into metabolic differences in the FF of PCOS and identified correlations between metabolites and ART outcomes, the study has some limitations that need to be addressed. Firstly, the relatively small sample size was a major limitation of the present study, potentially reducing statistical power to detect small changes in the multi-omics profile and occasionally leading to false positive results. Secondly, it is challenging to recruit a control group of patients with proven fertility who have experienced at least one uncomplicated term pregnancy and are undergoing in vitro fertilization (IVF) due to male factor infertility. Women with fallopian tube obstruction cannot be regarded as an ideal control group, as they remain part of the infertile population. Furthermore, a significant challenge in clinical sample research involving human matrices is the presence of inter-individual variability, especially pronounced in women with fluctuating hormone levels throughout the menstrual cycle. Despite variations in the ovarian stimulation protocols among study participants, our analysis revealed no statistically significant differences between the two sample groups.
In summary, our study connects alterations in the follicular microenvironment and oocyte development to metabolites in FF and the transcription of functional genes in CCs. Through comprehensive profiling, we identified several candidate metabolites that were altered in the FF of women with PCOS undergoing IVF treatment. These candidate metabolites could serve as potential biomarkers for distinguishing between individuals with PCOS and controls. The changes in these metabolites were closely correlated with the 2PN fertilization rate, cleavage rate, and the rate of high-quality embryos in the IVF cycle. Our findings support the adoption of an integrated multi-omics approach, which could offer deeper insights into understanding the etiology of PCOS and ultimately improve its diagnosis and management.
Data availability statementRNA-seq data are deposited in the NCBI Gene Expression Omnibus (GEO, accession number GSE277906). Metabolomics data have been deposited in the OMIX, China National Center for Bioinformation / Beijing Institute of Genomics, Chinese Academy of Sciences (https://ngdc.cncb.ac.cn/omix: accession number OMIX007557).
Ethics statementThe studies involving humans were approved by The local Ethics Committee of the Third Affiliated Hospital of Guangzhou Medical University. The studies were conducted in accordance with the local legislation and institutional requirements. The participants provided their written informed consent to participate in this study.
Author contributionsYC: Conceptualization, Data curation, Funding acquisition, Writing – original draft, Writing – review & editing. MX: Methodology, Resources, Writing – original draft. SW: Data curation, Resources, Writing – review & editing. ZD: Resources, Writing – review & editing. YT: Methodology, Resources, Writing – original draft. YG: Formal analysis, Visualization, Writing – review & editing. YY: Methodology, Resources, Writing – review & editing. QH: Investigation, Validation, Writing – original draft. LL: Project administration, Supervision, Writing – review & editing.
FundingThe author(s) declare financial support was received for the research, authorship, and/or publication of this article. Guangdong Basic and Applied Basic Research Foundation (2022A1515220206 to YC) and Science and Technology Projects in Guangzhou (SL2024A03J01056 to LL).
AcknowledgmentsWe are thankful to all the participants of the study. We thank the Shanghai Luming Biological Technology Co., LTD (Shanghai, China) for providing metabolomics services.
Conflict of interestThe authors declare that the research was conducted in the absence of any commercial or financial relationships that could be construed as a potential conflict of interest.
Publisher’s noteAll claims expressed in this article are solely those of the authors and do not necessarily represent those of their affiliated organizations, or those of the publisher, the editors and the reviewers. Any product that may be evaluated in this article, or claim that may be made by its manufacturer, is not guaranteed or endorsed by the publisher.
References1. Goodarzi MO, Dumesic DA, Chazenbalk G, Azziz R. Polycystic ovary syndrome: etiology, pathogenesis and diagnosis. Nat Rev Endocrinol. (2011) 7:219–31. doi: 10.1038/nrendo.2010.217
PubMed Abstract | Crossref Full Text | Google Scholar
3. Kotlyar AM, Seifer DB. Women with PCOS who undergo IVF: a comprehensive review of therapeutic strategies for successful outcomes. Reprod Biol Endocrinol. (2023) 21:70. doi: 10.1186/s12958-023-01120-7
PubMed Abstract | Crossref Full Text | Google Scholar
4. Singh S, Pal N, Shubham S, Sarma DK, Verma V, Marotta F, et al. Polycystic ovary syndrome: etiology, current management, and future therapeutics. J Clin Med. (2023) 12:1454. doi: 10.3390/jcm12041454
PubMed Abstract | Crossref Full Text | Google Scholar
5. Lanzone A, Fulghesu AM, Fortini A, Cutillo G, Cucinelli F, Di Simone N, et al. Effect of opiate receptor blockade on the insulin response to oral glucose load in polycystic ovarian disease. Hum Reprod. (1991) 6:1043–49. doi: 10.1093/oxfordjournals.humrep.a137482
PubMed Abstract | Crossref Full Text | Google Scholar
6. Bayasula, Iwase A, Kobayashi H, Goto M, Nakahara T, Nakamura T, et al. A proteomic analysis of human follicular fluid: comparison between fertilized oocytes and non-fertilized oocytes in the same patient. J Assist Reprod Genet. (2013) 30:1231–38. doi: 10.1007/s10815-013-0004-3
PubMed Abstract | Crossref Full Text | Google Scholar
7. Liu L, Yin TL, Chen Y, Li Y, Yin L, Ding J, et al. Follicular dynamics of glycerophospholipid and sphingolipid metabolisms in polycystic ovary syndrome patients. J Steroid Biochem Mol Biol. (2019) 185:142–49. doi: 10.1016/j.jsbmb.2018.08.008
PubMed Abstract | Crossref Full Text | Google Scholar
8. Zhao H, Zhao Y, Li T, Li M, Li J, Li R, et al. Metabolism alteration in follicular niche: The nexus among intermediary metabolism, mitochondrial function, and classic polycystic ovary syndrome. Free Radic Biol Med. (2015) 86:295–307. doi: 10.1016/j.freeradbiomed.2015.05.013
PubMed Abstract | Crossref Full Text | Google Scholar
9. Rajska A, Buszewska-Forajta M, Rachoń D, Markuszewski MJ. Metabolomic insight into polycystic ovary syndrome—An overview. Int J Mol Sci. (2020) 21:4853. doi: 10.3390/ijms21144853
PubMed Abstract | Crossref Full Text | Google Scholar
10. Feng Y, Qi J, Xue X, Li X, Liao Y, Sun Y, et al. Follicular free fatty acid metabolic signatures and their effects on oocyte competence in non-obese PCOS patients. Reproduction. (2022) 164:1–08. doi: 10.1530/REP-22-0023
PubMed Abstract | Crossref Full Text | Google Scholar
11. Chen X, Lu T, Wang X, Sun X, Zhang J, Zhou K, et al. Metabolic alterations associated with polycystic ovary syndrome: A UPLC Q-Exactive based metabolomic study. Clin Chim Acta. (2020) 502:280–86. doi: 10.1016/j.cca.2019.11.016
PubMed Abstract | Crossref Full Text | Google Scholar
12. Di Simone N, Riccardi P, Maggiano N, Piacentani A, D'Asta M, Capelli A, et al. Effect of folic acid on homocysteine-induced trophoblast apoptosis. Mol Hum Reprod. (2004) 10:665–69. doi: 10.1093/molehr/gah091
PubMed Abstract | Crossref Full Text | Google Scholar
13. Richani D, Dunning KR, Thompson JG, Gilchrist RB. Metabolic co-dependence of the oocyte and cumulus cells: essential role in determining oocyte developmental competence. Hum Reprod Update. (2021) 27:27–47. doi: 10.1093/humupd/dmaa043
PubMed Abstract | Crossref Full Text | Google Scholar
14. Li J, Chen H, Gou M, Tian C, Wang H, Song X, et al. Molecular features of polycystic ovary syndrome revealed by transcriptome analysis of oocytes and cumulus cells. Front Cell Dev Biol. (2021) 9:735684. doi: 10.3389/fcell.2021.735684
PubMed Abstract | Crossref Full Text | Google Scholar
15. Kenigsberg S, Bentov Y, Chalifa-Caspi V, Potashnik G, Ofir R, Birk OS. Gene expression microarray profiles of cumulus cells in lean and overweight-obese polycystic ovary syndrome patients. Mol Hum Reprod. (2009) 15:89–103. doi: 10.1093/molehr/gan082
PubMed Abstract | Crossref Full Text | Google Scholar
16. Zhao R, Jiang Y, Zhao S, Zhao H. Multiomics Analysis reveals molecular abnormalities in granulosa cells of women with polycystic ovary syndrome. Front Genet. (2021) 12:648701. doi: 10.3389/fgene.2021.648701
PubMed Abstract | Crossref Full Text | Google Scholar
17. Huang X, Hao C, Shen X, Liu X, Shan Y, Zhang Y, et al. Differences in the transcriptional profiles of human cumulus cells isolated from MI and MII oocytes of patients with polycystic ovary syndrome. Reproduction. (2013) 145:597–608. doi: 10.1530/REP-13-0005
PubMed Abstract | Crossref Full Text | Google Scholar
18. Hu Y, Zhang R, Zhang S, Ji Y, Zhou Q, Leng L, et al. Transcriptomic profiles reveal the characteristics of oocytes and cumulus cells at GV, MI, and MII in follicles before ovulation. J Ovarian Res. (2023) 16:225. doi: 10.1186/s13048-023-01291-2
PubMed Abstract | Crossref Full Text | Google Scholar
19. Lu X, Lv X, Dong X, Li Y, Turathum B, Liu S, et al. Increased serine synthesis in cumulus cells of young infertile women with diminished ovarian reserve. Hum Reprod. (2023) 38:1723–32. doi: 10.1093/humrep/dead155
PubMed Abstract | Crossref Full Text | Google Scholar
20. Ren S, Shao Y, Zhao X, Hong CS, Wang F, Lu X, et al. Integration of metabolomics and transcriptomics reveals major metabolic pathways and potential biomarker involved in prostate cancer. Mol Cell Proteomics. (2016) 15:154–63. doi: 10.1074/mcp.M115.052381
PubMed Abstract | Crossref Full Text | Google Scholar
21. Maan K, Baghel R, Dhariwal S, Sharma A, Bakhshi R, Rana P. Metabolomics and transcriptomics based multi-omics integration reveals radiation-induced altered pathway networking and underlying mechanism. NPJ Syst Biol Appl. (2023) 9:42. doi: 10.1038/s41540-023-00305-5
PubMed Abstract | Crossref Full Text | Google Scholar
22. Dai Y, Lin X, Liu N, Shi L, Zhuo F, Huang Q, et al. Integrative analysis of transcriptomic and metabolomic profiles reveals abnormal phosphatidylinositol metabolism in follicles from endometriosis-associated infertility patients. J Pathol. (2023) 260:248–60. doi: 10.1002/path.6079
PubMed Abstract | Crossref Full Text | Google Scholar
23. Hou E, Zhao Y, Hang J, Qiao J. Metabolomics and correlation network analysis of follicular fluid reveals associations between l-tryptophan, l-tyrosine and polycystic ovary syndrome. BioMed Chromatogr. (2021) 35:e4993. doi: 10.1002/bmc.4993
PubMed Abstract | Crossref Full Text | Google Scholar
24. Chen M, Yang W, Guo Y, Hou X, Zhu S, Sun H, et al. Multi-omics reveal the metabolic patterns in mouse cumulus cells during oocyte maturation. J Ovarian Res. (2023) 16:156. doi: 10.1186/s13048-023-01237-8
PubMed Abstract | Crossref Full Text | Google Scholar
25. Yang D, Yang H, Yang B, Wang K, Zhu Q, Wang J, et al. Embryological characteristics of human oocytes with agar-like Zona pellucida and its clinical treatment strategy. Front Endocrinol (Lausanne). (2022) 13:859361. doi: 10.3389/fendo.2022.859361
PubMed Abstract | Crossref Full Text | Google Scholar
27. Tao L, Zhang Y, Fan S, Nobile CJ, Guan G, Huang G. Integration of the tricarboxylic acid (TCA) cycle with cAMP signaling and Sfl2
留言 (0)