
記住我


Between June 2023 and December 2023, the consecutive patients with confirmed or suspected coronary heart disease (CHD) who underwent MPI-MMI at our hospital to evaluate myocardial viability were retrospectively analyzed. The exclusion criteria were: (1) patients with severe arrhythmia; (2) patients with diabetes that leads to poor myocardial 18F-FDG uptake; (3) patients with motion artifacts caused by physical movement during the acquisition. Finally, a total of 41 patients were enrolled. Patient characteristics were collected, including age, gender, body mass index (BMI), smoking history, hypertension, diabetes, hyperlipidemia, myocardial infarction and coronary revascularization history.
Image acquisition and reconstructionAmong 41 patients, 17 patients underwent 99mTc-MIBI SPECT MPI, while 24 patients underwent 13N-NH3 PET/CT MPI. SPECT MPI scans (Discovery 670, GE Healthcare, USA) were performed at 120 min after patients were intravenously injected with approximately 740 MBq (20 mCi) 99mTc-MIBI, and images were constructed by ordered subset expectation maximization (OSEM, 8 subsets, 4 iterations) algorithm. Besides, 10-min continuous PET/CT MPI scans (uEXPLORER, United Imaging Healthcare, Shanghai, China) were performed in patients immediately after the bolus injection of approximately 370–555 MBq (10–15 mCi) 13N-NH3, and images were constructed using OSEM (20 subsets, 3 iterations, FWHM = 3.0 mm) algorithm.
For MMI, all patients fasted for at least 6 h, and the standard protocol of oral glucose load and insulin injection was applied based on diabetic status and blood glucose level. 18F-FDG was intravenously injected at a dose of 3.7 MBq/kg (0.1 mCi/kg) after the blood glucose level was ≤ 7.8 mmol/L. Approximately 90 min after injection, the patients underwent MMI for 600 s on the total-body PET/CT scanner. PET images were reconstructed using the OSEM (20 subsets, 3 iterations, matrix: 192 × 192, pixel size: 2.34 × 2.34 × 2.89 mm3, FWHM = 3.0 mm) algorithm and CT-based attenuation correction was applied. From the beginning of acquisition, all 600-s MMI list-model data were trimmed and reconstructed to simulate images of 600-s, 300-s, 120-s, 60-s, and 30-s acquisition time, which were defined as G600, G300, G120, G60, and G30, respectively. G600 served as the reference and was compared with other groups, with inter-frame co-registration performed.
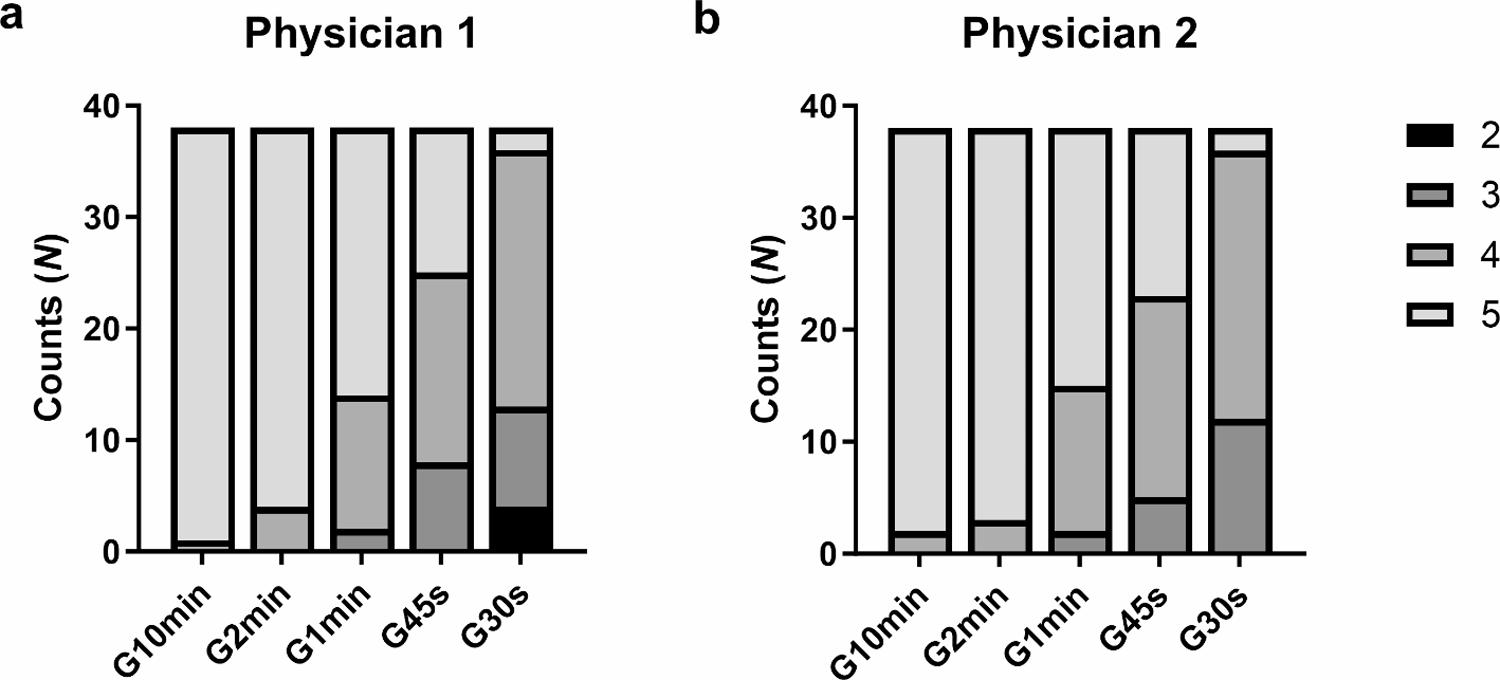
Subjective visual evaluationThe image quality of MMI was subjectively and independently evaluated by two experienced nuclear medicine physicians (XC Zhang and H Yuan), each with a minimum of ten years of experience. A 5-point Likert scale was used for evaluating overall impression of the image quality, image noise, and conspicuity of lesions [14, 15]. Scores of 5 to 1 that were defined as follows: 5-excellent: conspicuity of lesions was clearly defined and noise was almost imperceptible; 4-good: conspicuity of lesions was fairly defined and noise was lower than the regular image of daily practice; 3-average: conspicuity of lesions and noise were equivalent to the regular image of daily practice obtained using conventional PET/CT scanner in our hospital; 2-poor: conspicuity of lesions was ill defined and noise was worse than the regular image of daily practice; and 1-very poor: conspicuity of lesions was un-recognizable and noise was excessive. Images with score 5 to 3 could meet the needs of clinical diagnosis. Specifically, image noise and lesion visibility were not further scored separately, as it simplifies the research process, makes the results more clinically applicable, reduces the collinearity, and exhibits high inter-observer consistency. Additionally, any disagreement between two physicians was resolved by consensus.
Semi-quantitative evaluationThe LV myocardium was automatically segmented using Carimas v 2.10 software (Turku PET Centre, Finland) to obtain volume of interest (VOI), and the VOI of LV blood pool was also semi-automatically delineated (manually adjusted to avoid the myocardial wall and papillary muscles) [16]. All VOIs were drawn on G600 images and applied to G300, G120, G60, and G30 images to ensure consistency in the location and size of VOIs among different groups (Fig. 1). The following standardized uptake values (SUVs) were measured using LIFEx software: SUVmax, SUVmean, and SUVSD of the LV myocardium (SUVmaxMYO, SUVmeanMYO, and SUVSDMYO), and SUVmax, SUVmean, and SUVSD of the LV blood pool (SUVmaxLV, SUVmeanLV, and SUVSDLV) [17]. Subsequently, the indexes of myocardial to background activity ratio (M/B), signal to noise ratio (SNR), contrast to noise ratio (CNR), contrast ratio (CR), and coefficient of variation (CV) were calculated as [18]: M/B = SUVmaxMYO/SUVmaxLV, SNR = SUVmeanMYO/SUVSDLV, CNR=(SUVmeanMYO-SUVmeanLV)/SUVSDLV, CR = SUVmeanMYO/SUVmeanLV, and CV = SUVSDMYO/SUVmeanMYO.
Fig. 1
Flowchart of segmentation of the left ventricular myocardium using Carimas software
Myocardial viability analysisAccording to the American Heart Association (AHA) standards, the LV myocardium in MPI and MMI was displayed in polar maps and segmented into three coronary segments for analysis using the commercial specialized QGS + QPS software package (Cedars-Sinai Medical Center, USA). If the pixel value of the myocardial image was higher than 80% of the maximum perfusion or metabolism activity, it was defined as normal, otherwise, it was defined as abnormal [19]. Total perfusion defect (TPD) (%) was generated by the MPI polar map, representing the extent and severity of the hypoperfused myocardium. Then, pixel-by-pixel comparison was performed between the MPI polar map and the MMI polar map to generate polar maps of Mismatch and Scar. Mismatch (%) was the percentage of the LV myocardium with abnormal perfusion and normal metabolism, representing the amount of the mismatched (viable) myocardium. Scar (%) was the percentage of the LV myocardium both with abnormal perfusion and metabolism, representing the amount of the matched (scarred) myocardium.
Statistical analysisStatistical analysis was performed using SPSS 26.0 software (IBM SPSS Inc, USA). Continuous variables were expressed as mean ± standard deviation (SD) or median (range) upon the normality, while count variables were expressed in numbers or percentages. The agreement of image scores between two physicians was measured with the kappa test, and a kappa value ≥ 0.81 was considered excellent agreement. The subjective image quality between acquisition time groups (G300-G30 vs. G600) was compared using Kruskal Wallis rank sum test and Dunn’s post hoc test. The objective image quality between groups was compared using paired t-test or Wilcoxon test. Mismatch and Scar indexes among groups were analyzed using intra class correlation coefficient (ICC) and Bland-Altman plot. All statistical tests were two-tailed, with P < 0.05 indicating statistical significance.
留言 (0)