
記住我


Kidney stone disease is a highly prevalent urinary system disorder that affects approximately 10% of the population (1). Kidney stones typically result in acute attacks characterized by renal colic, urinary obstruction, urinary tract infections, and, in severe cases, kidney failure or life-threatening conditions (2). Despite advancements in minimally invasive and non-invasive lithotripsy techniques, up to 50% of patients post-surgery still experience kidney stone recurrence, significantly increasing both physiological and economic burdens (3). The rising incidence and recurrent nature of kidney stone disease contributed to substantial healthcare expenditures and diminished quality of life, underscoring the significance of identifying modifiable risk factors for early targeted interventions (4). It is important to identify individuals with high kidney stone risk using simple and effective diagnostic indicators (5, 6).
Emerging evidence underscored metabolic abnormalities as pivotal in the pathogenesis of kidney stones (7). Kidney stone disease may be a renal manifestation of systemic diseases such as metabolic syndrome rather than an isolated disorder caused by disturbances in urine composition (8, 9). Some studies revealed a correlation between obesity, lipid metabolic disturbances, and the occurrence of kidney stone (10, 11). Furthermore, the distribution of body fat, particularly the increase in visceral adiposity, was closely related to the metabolic risk factors for kidney stones (12, 13). Due to the complexity and systemic nature of kidney stones, multidimensional assessment is particularly important (14, 15). The Cardiometabolic Index (CMI) is a novel anthropometric index calculated by Triglyceride (TG)/High-density lipid cholesterol (HDL-c) × waist-to-height ratio (WHtR) (16). WHtR was deemed a more precise indicator of certain health risks compared to body mass index (BMI), due to its focus on the distribution of body fat (17). Additionally, the TG/HDL-c ratio became a commonly acknowledged indicator of lipid metabolism disorders (18). Integrating these two indices effectively, CMI was suggested as a more comprehensive assessment of abdominal obesity and dyslipidemia, thereby providing a more holistic approach to evaluating metabolic health (19). Several studies indicated that CMI was a promising indicator of diabetes, cardiovascular disease, metabolic syndrome, and renal dysfunction (20–23).
To our knowledge, the relationship between CMI level and kidney stone risk is still unclear. Therefore, our study aimed to systematically investigate the relationship between CMI and kidney stones based on the National Health and Nutrition Examination Survey (NHANES) database, potentially paving the way for novel preventative strategies and early screening methods for kidney stone disease.
2 Materials and methods2.1 Data sourceThis population-based study utilized data from the NHANES, which aimed to assess the health and nutritional status of the US population. NHANES was a randomized, stratified, multi-stage survey design, providing a nationally representative sample with detailed demographic, socioeconomic, and health information (24). The study protocol for the NHANES database received approval from the Ethics Review Board of the National Center for Health Statistics. We included participants with complete data on kidney stones from 2011 to 2018. Participants below 20 years, those pregnant, and individuals without complete CMI data or questionnaire records about kidney stones were excluded. Adhering to these criteria, 9,177 patients were eligible for our study.
2.2 Exposure and outcome definitionsThe CMI was calculated as the TG/HDL-c × WHtR (25). The primary outcome for our analysis was the participants’ response to the question “Have you or the sample person ever had a kidney stone?” during the medical questionnaire (26, 27). The participants who reported “yes” to the question were considered as having kidney stones, while those answering “no” were classified as not. The reliability of self-reported kidney stone conditions has been validated in prior studies (28–32).
2.3 Covariate definitionsBased on existing literature and clinical experience, confounding factors covering demographics, lifestyle habits, and health indicators were selected. Previous studies have confirmed these variables to have a significant association with kidney stones risk (33–38): demographic data (age, gender, race), annual household income, education level, physical activity level, smoking status, diabetes prevalence, hypertension prevalence, cardiovascular disease prevalence, BMI, alanine aminotransferase (ALT), aspartate aminotransferase (AST), gamma-glutamyl transferase (GGT), albumin, fasting plasma glucose (FPG), glycated hemoglobin A1c (HbA1c), total cholesterol (TC), low-density lipoprotein cholesterol (LDL-c), blood urea nitrogen (BUN), serum creatinine (Scr), serum uric acid (SUA), and estimated glomerular filtration rate (eGFR). BMI was categorized into three groups: < 25 kg/m2 (normal weight), 25 - 29.9 kg/m2 (overweight), and ≥ 30 kg/m2 (obese). eGFR was calculated according to the CKD Epidemiology Collaboration creatinine equation, which incorporates factors including age, gender, race, and Scr (39). Additionally, self-reported diabetes and hypertension were identified, and cardiovascular disease presence was assessed through self-reports of coronary artery disease, angina, heart attack, congestive heart failure, or stroke (40). Comprehensive details of study variables are publicly available in the NHANES database (https://www.cdc.gov/nchs/nhanes/).
2.4 Statistical analysisAll statistical analyses were conducted following the guidelines set forth by the Centers for Disease Control and Prevention, incorporating a complex, multistage cluster survey design (41). Continuous variables were expressed as mean with standard deviation, and categorical parameters were presented as proportions. Student’s t-test and chi-squared test were used to compare baseline variable differences. The Inverse probability of treatment weighting (IPTW) was used to control for confounders among the three exposure groups (according to the tertiles of CMI). Standardized mean difference (SMD) was used to assess the variation of CMI tertiles, with an SMD < 0.1 indicating a better equilibrium. To explore the relationship between CMI tertiles and the risk of kidney stones, odds ratio (OR) and IPTW-adjusted OR with 95% confidence interval (CI) were reported using Logistic Regression Models (Model 1, no covariate was adjusted; Model 2, adjusted for age, gender, and race; Model 3, further adjusted for annual household income, education level, physical activity level, smoking status, diabetes prevalence, hypertension prevalence, cardiovascular disease prevalence, BMI class, ALT, AST, GGT, albumin, TC, LDL-c, FPG, HbA1c, SUA, Scr, BUN and eGFR class). To investigate potential non-linear relationships, we employed a restricted cubic splines (RCS) analysis using the ‘rms’ R package (version 6.7.1) with four knots. Additionally, subgroup analyses were conducted using logistic regression models stratified by age (< 60/≥ 60 years), gender (female/male), BMI (normal weight/overweight/obese), diabetes (yes/no), hypertension (yes/no), cardiovascular disease (yes/no), and eGFR (< 60/60-90/≥ 90ml/min/1.73m2). All statistical analyses were performed using R software and the Empower software (http://www.empowerstats.com), with ‘dplyr’ package (version 1.1.4) for data manipulation and preprocessing, ‘ggplot2’ package (version 3.5.0) for plots and visualizations. A two-sided P value < 0.05 was considered statistically significant.
3 Results3.1 Baseline characteristics of the study populationA total of 9,177 individuals were included (48.75% male) with a mean age of 49.63 years in this study. Among the total participants, 908 individuals (9.89%) had kidney stones, which corresponded with the estimated prevalence rates in the general population (3). Compared with those without kidney stones, participants with kidney stones tend to be male, older and have a higher BMI, waist circumference (WC), FPG, HbA1c, TG, smoking rates, diabetes prevalence, hypertension prevalence, and cardiovascular disease prevalence (P < 0.05) (Table 1). Conversely, HDL-c, albumin, and impaired kidney function (characterized by elevated SUA, Scr, BUN, and reduced eGFR), were evident in the kidney stone group (P < 0.05). Racial disparity was observed in kidney stones (P < 0.001). Specifically, the Non-Hispanic White group exhibited the highest risk of developing kidney stones, while the Non-Hispanic Black group demonstrated the lowest risk (P < 0.001). However, there were no significant differences in annual household income (P = 0.741), education level (P = 0.706), physical activity level (P = 0.257), height (P = 0.627), ALT (P = 0.081), AST (P = 0.15), GGT (P = 0.858), TC (P = 0.143), and LDL-c (P = 0.303). It was noted that CMI levels were higher in the kidney stone group than in the non-kidney stone group (0.71 ± 0.98 vs. 0.88 ± 1.08, P < 0.001).
Table 1. Baseline characteristics of the study population in NHANES from 2011 to 2018.
3.2 Clinical features of the participants according to the tertiles of CMIBased on the CMI levels, participants were categorized into three groups: tertile I (CMI ≤ 0.332), tertile II (0.332 < CMI ≤ 0.693), and tertile III (CMI > 0.693) (Table 2). Compared with the tertile I of CMI, tertile II and tertile III had a higher percentage in male proportion, smoking rates, diabetes prevalence, hypertension prevalence, cardiovascular disease prevalence, and higher levels of age, BMI, height, WC, ALT, AST, GGT, FPG, HbA1c, TG, TC, LDL-c, BUN, Scr, and SUA (P < 0.01). Conversely, it had a lower level of HDL-c, eGFR, albumin, education level, and annual household income (P < 0.01). Upon IPTW adjustment, most baseline characteristics were well balanced among three groups (SMD < 0.1), except for race, ALT, SUA, BMI, WC, FPG, HbA1c, HDL-c, TG, and the prevalence of diabetes (Table 2 and Figure 1).
Table 2. Baseline characteristics of the study population according to the tertiles of CMI.
Figure 1. Standardized mean difference between the unmatched model and the IPTW-adjusted model: The red vertical dotted line represents the threshold for acceptable balance, with a standardized mean difference (SMD) < 0.1 indicating a better equilibrium.
3.3 Association between CMI and kidney stonesLogistic regression analysis showed a positive association between CMI and kidney stones in model 3, after adjusting for multiple covariates (OR: 1.30, 95%CI: 1.04 to 1.61, P = 0.021) (Table 3). According to the IPTW-multivariable logistic analysis, a similar result was observed in model 3 after adjusting for multiple covariates (OR: 1.31, 95%CI: 1.17 to 1.47, P < 0.001). Furthermore, RCS analysis indicated a linear relationship between CMI levels and kidney stone risk (P for nonlinear = 0.168, P for linear = 0.021) (Figure 2).
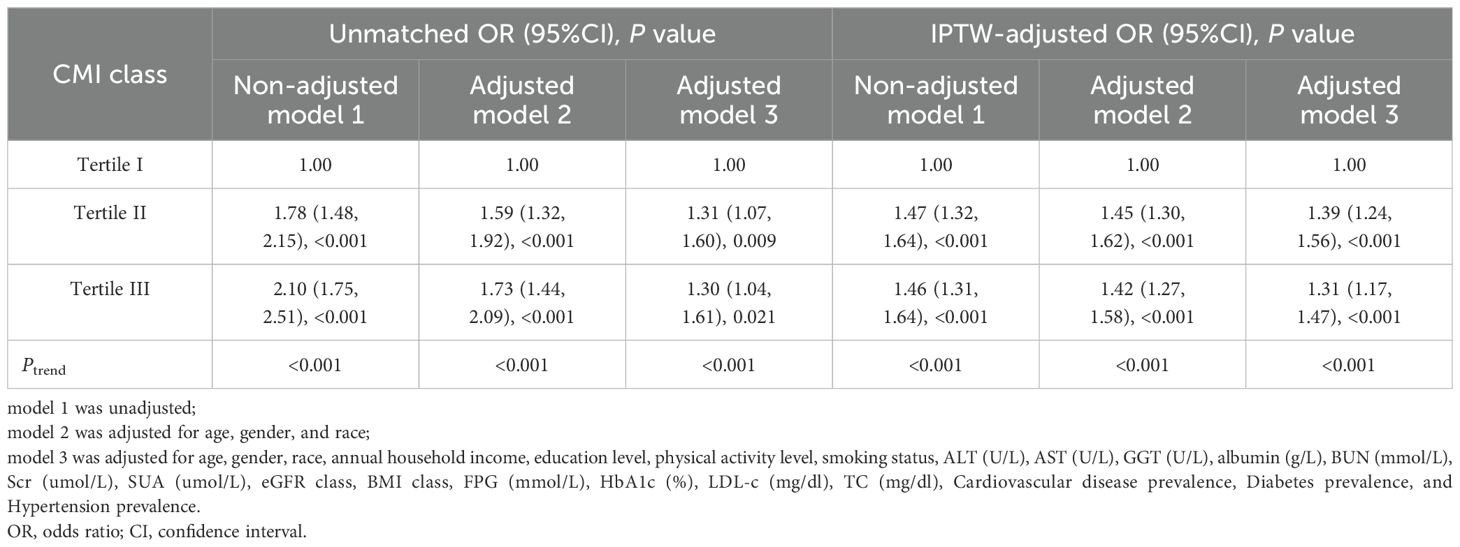
Table 3. Logistic regression analysis results of CMI and kidney stone.
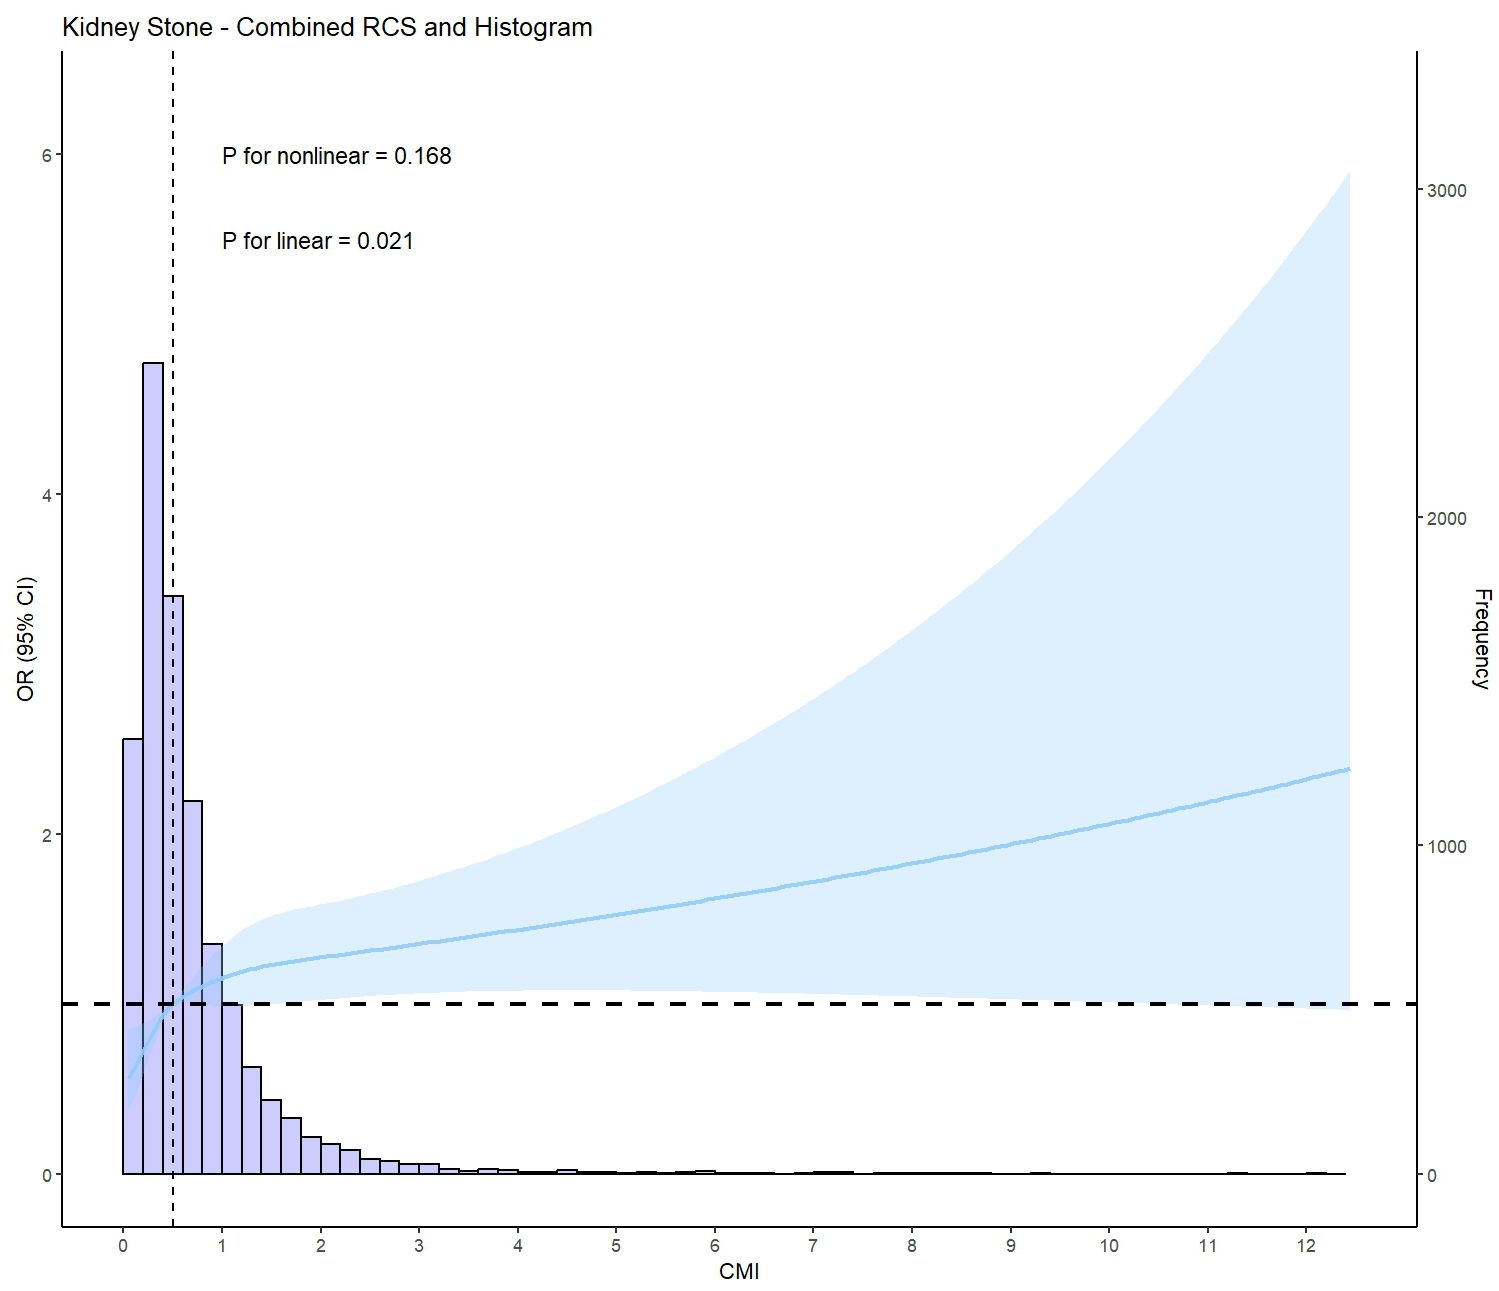
Figure 2. Restricted cubic spline plot (RCS) of CMI and kidney stone (based on model 3, adjusted for age, gender, race, annual household income, education level, physical activity level, smoking status, ALT(U/L), AST(U/L), GGT(U/L), albumin(g/L), BUN(mmol/L), Scr(umol/L), SUA(umol/L), eGFR class, BMI class, FPG(mmol/L), HbA1c(%), LDL-c(mg/dl), TC(mg/dl), Cardiovascular disease prevalence, Diabetes prevalence, and Hypertension prevalence).
3.4 Subgroup analysisSubgroup analysis stratified by age (< 60/≥ 60 years), gender (female/male), BMI (normal weight/overweight/obese), diabetes (yes/no), hypertension (yes/no), cardiovascular disease (yes/no), and eGFR (< 60/60-90/≥ 90 ml/min/1.73m2) were used to further assess the relationship between CMI levels and kidney stone risk. According to the IPTW-multivariate adjusted model, the relationship between CMI levels and kidney stone risk was stable by subgroups (Table 4 and Figure 3).
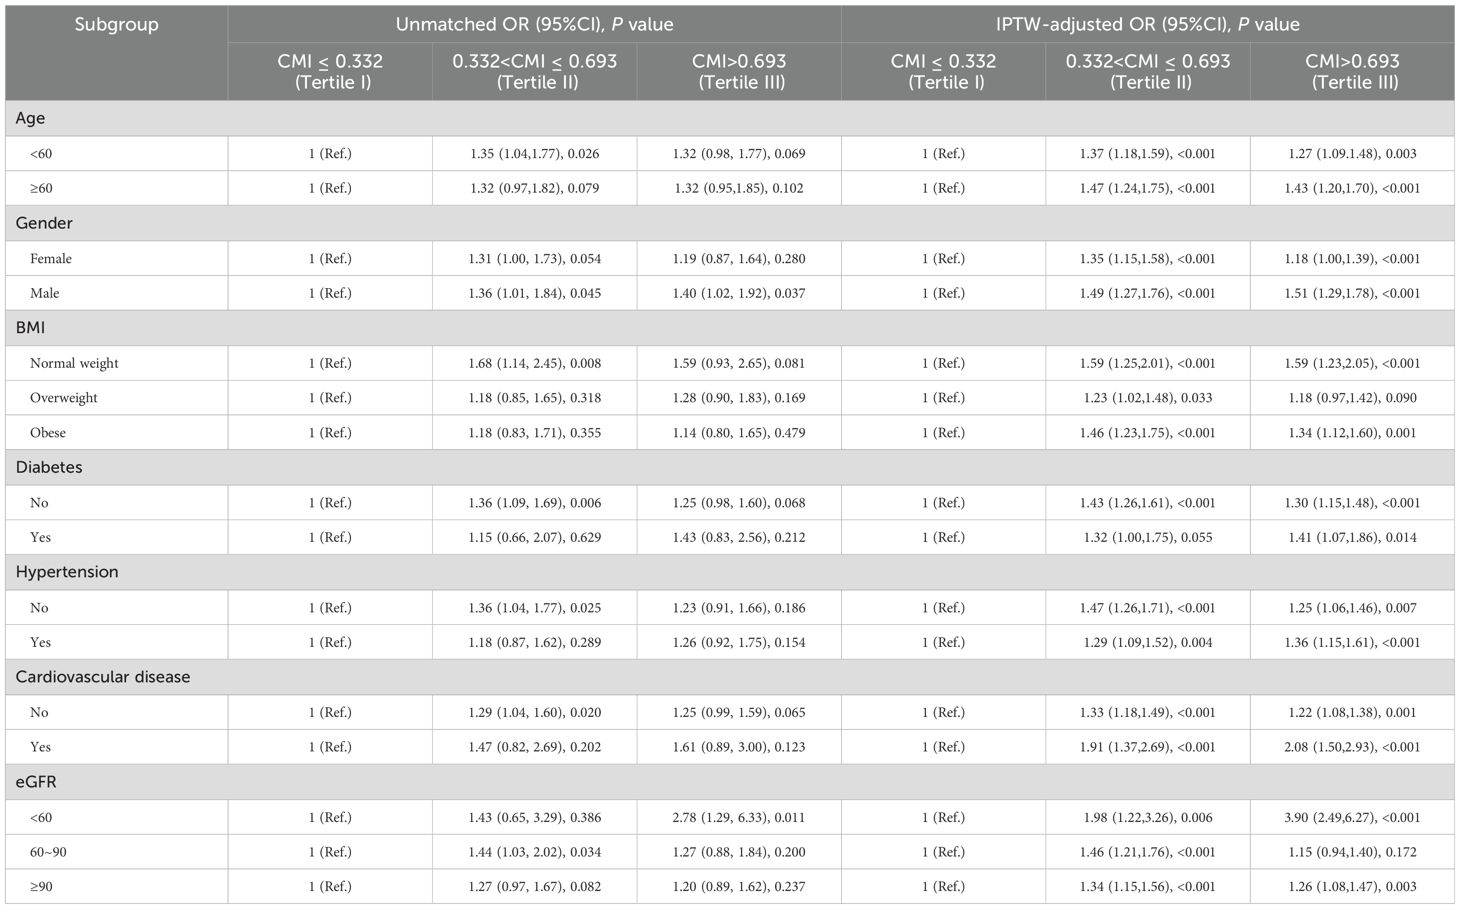
Table 4. Association of CMI and kidney stone in different subgroups.
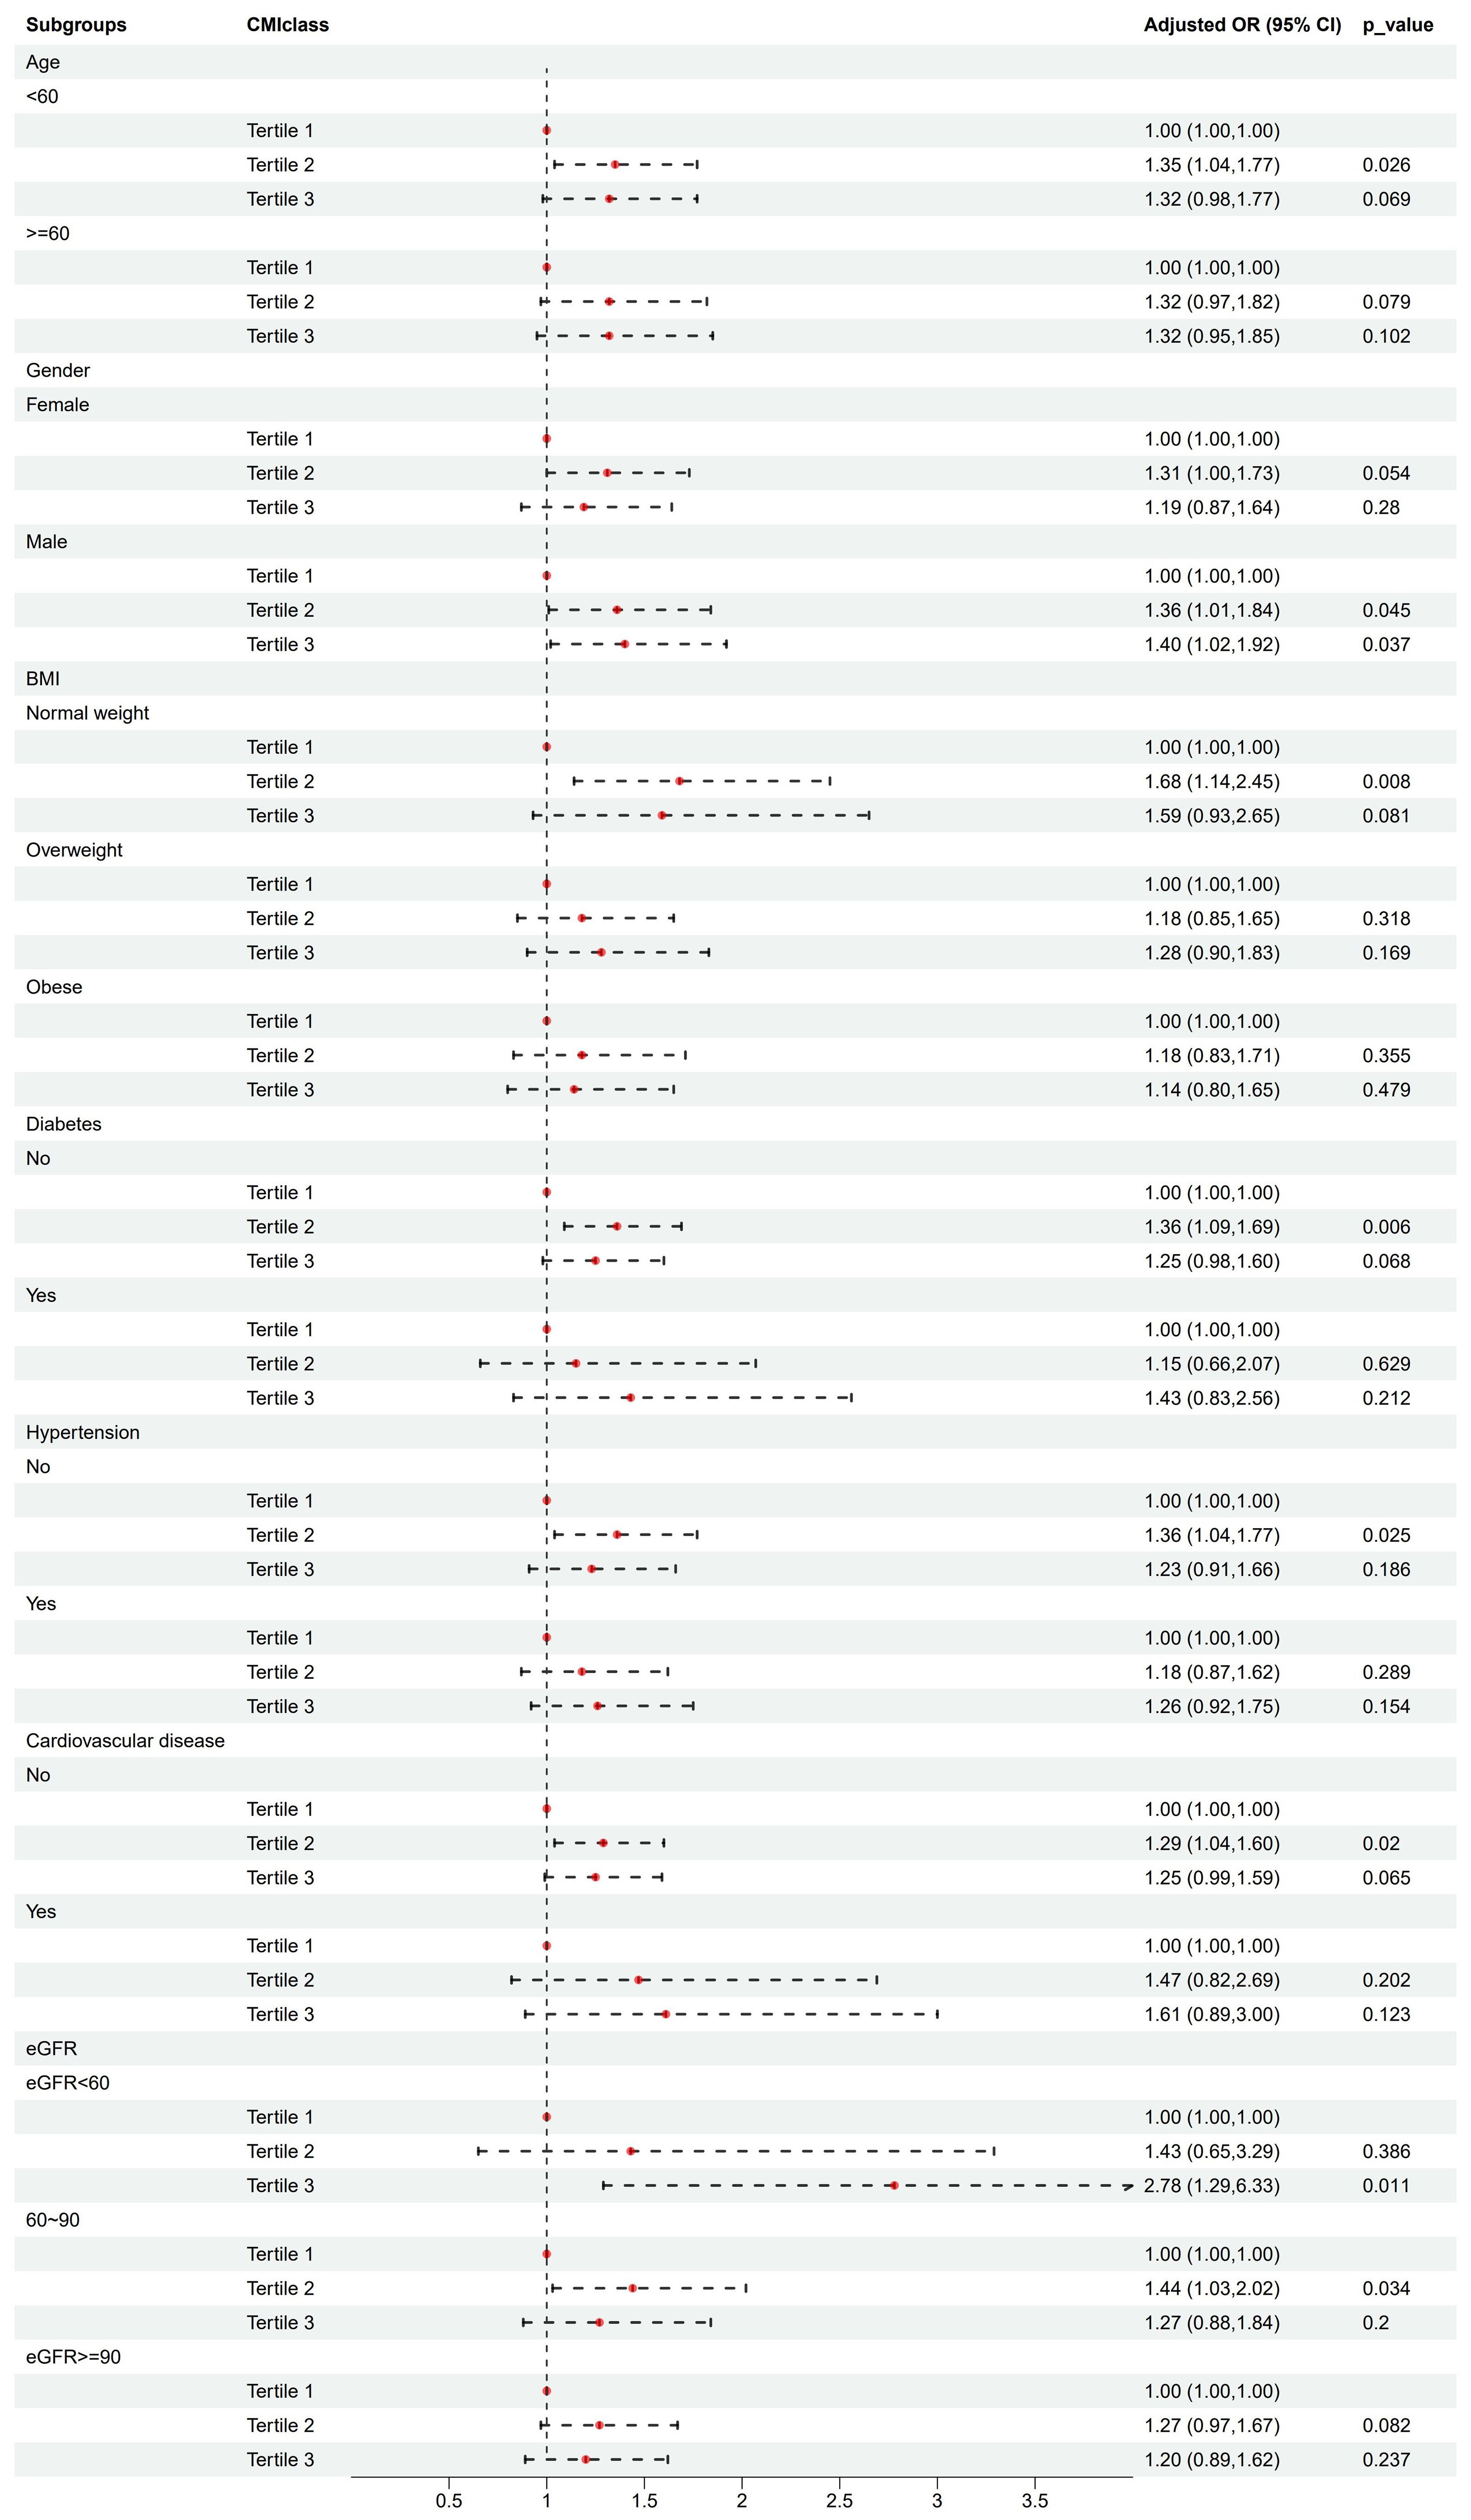
Figure 3. Association analysis of CMI with kidney stones in different subgroups.
4 DiscussionTo our knowledge, this is the first population-based study to investigate the relationship between CMI level and kidney stone risk. Our study revealed that CMI level was an independent risk factor for kidney stone risk.
The growing interest in CMI stems from its novel combination of TG/HDL-c ratio and WHtR, offering a unified measure that captures aspects of dyslipidemia and central obesity (25). Prior studies implicated CMI in various metabolic disorders, such as atherosclerosis, cardiovascular disease, non-alcoholic fatty liver disease, and diabetes (42, 43). Our findings indicated a significantly higher CMI level among individuals with a history of kidney stones. Furthermore, CMI elevation was associated with a decline in hepatic and renal function, and an increase in BMI, blood glucose, and lipid levels. Current research has linked the incidence of kidney stones to metabolic factors like dyslipidemia, abdominal obesity, hypertension, and diabetes (11). Lee and colleagues identified a correlation between stone risk and several obesity-related measures, such as BMI, WC, WHtR, waist-to-hip ratio, abdominal volume index, and body roundness index (10). In a community cohort study of 121,579 individuals, a significant association was found between kidney stones and metabolic syndrome, with a higher risk of developing kidney stones in participants with metabolic syndrome at baseline (11). Novel indices for assessing visceral obesity, such as the Visceral Adiposity Index and weight-adjusted waist index, have been demonstrated to correlate with the risk of kidney stones, offering a novel perspective in the identification of potential risk factors for kidney stone development (13, 44). Our study effectively integrated the characters of visceral obesity and dyslipidemia, and used IPTW to equilibrate intergroup differences, thereby enhancing the stability and reliability of the analysis results. CMI is a promising tool for identifying kidney stone risk, offering significant clinical and translational value. Firstly, CMI enables rapid and cost-effective assessment of patients’ metabolic health, helping to identify individuals with high risk for kidney stones. This is particularly crucial in primary care settings and resource-limited healthcare systems (45, 46). Secondly, integrating CMI into the risk assessment process for kidney stones may facilitate the implementation of nutritional guidance, exercise programs, and other lifestyle interventions, which can help improve long-term health outcomes for high-risk groups.
The interconnections between obesity, metabolic syndrome, and dyslipidemia underscored the systemic nature of kidney stone disease. The precise mechanisms by which CMI influences stone formation are yet to be fully delineated. Our findings suggested that the dysregulated lipid metabolism associated with elevated CMI levels may contribute to this process. Oxidative stress plays a key role in metabolic disorder onset, with escalating levels of it in obesity and dyslipidemia (47). Hyperlipidemia, through oxidative stress, can trigger glomerulosclerosis and tubulointerstitial damage, serving as a critical precursor for kidney stone formation (48). Emerging evidence from previous studies suggested a significant association between serum lipids and urinary metabolite profiles, which may influence nephrolithiasis stone composition (49, 50). Dyslipidemia, particularly hypertriglyceridemia, has been identified as a contributing factor in the formation and recurrence of kidney stones (51). Notably, patients with low HDL-c or elevated TG levels demonstrate markedly increased urinary sodium, oxalate, and uric acid concentrations, along with decreased urinary pH values (52). The use of lipid-lowering medications, notably atorvastatin, has been observed to significantly alter urinary biochemical profiles (53). Metabolic syndrome, often characterized by central adiposity, was implicated in kidney stone pathology due to its association with altered urinary excretion patterns of lithogenic substances like calcium, uric acid, oxalate, and citrate. Furthermore, oxidative stress induced by visceral fat may contribute to renal impairment through increased production of inflammatory cytokines like interleukin-6, C-reactive protein, and reactive oxygen species, which could facilitate stone formation (54).
One of the primary strengths of our study lies in its large sample size, which is representative of the general U.S. adult population. The comprehensive adjustment for a multitude of potential confounders ensured the robustness of the CMI-nephrolithiasis association. Nevertheless, our study’s interpretive potential is tempered by its inherent limitations. The cross-sectional design may hinder our ability to establish causality, and our reliance on self-reported history of kidney stones may introduce bias. However, the credibility of the NHANES database in reflecting public health concerns in the U.S., including the epidemiology of stone disease, substantiates our methodology (29–31, 55). The lack of detailed typological data on kidney stones in our dataset may preclude a more nuanced stone composition analysis. Although full adjustments were made for common confounding factors, potential residual confounders such as lipid-lowering medications or specific dietary habits were not accounted for, which may introduce bias. We recommend prospective, multi-center studies to further elucidate and confirm the prognostic utility of CMI in kidney stone risk evaluation.
5 ConclusionIn conclusion, our study found a significant association between CMI level and the risk of kidney stones after adjusting for potential confounders. CMI could be utilized as an effective tool for identifying individuals at high risk of kidney stones during routine health examinations.
Data availability statementThe datasets presented in this study can be found in online repositories. The names of the repository/repositories and accession number(s) can be found in the article/Supplementary Material.
Ethics statementThe studies involving humans were approved by Ethics Review Board of the National Center for Health Statistics. The studies were conducted in accordance with the local legislation and institutional requirements. The participants provided their written informed consent to participate in this study.
Author contributionsQW: Conceptualization, Data curation, Investigation, Writing – original draft, Writing – review & editing. ZW: Data curation, Formal Analysis, Methodology, Project administration, Supervision, Validation, Writing – review & editing. ZT: Conceptualization, Data curation, Funding acquisition, Investigation, Methodology, Supervision, Writing – review & editing. CL: Formal Analysis, Methodology, Writing – review & editing. YP: Formal Analysis, Resources, Validation, Visualization, Writing – review & editing. SZ: Formal Analysis, Funding acquisition, Methodology, Resources, Supervision, Validation, Visualization, Writing – original draft, Writing – review & editing.
FundingThe author(s) declare that financial support was received for the research, authorship, and/or publication of this article. This study was supported by the Suzhou Science and Technology Planning Project (STL2021006, SKY2022025), the National Natural Science Foundation of China (82373688, 81773541), and Jiangsu Key Laboratory of Preventive and Translational Medicine for Geriatric Diseases (KJS2222). The funding body did not play any role in the design or conduct of this research.
AcknowledgmentsThe authors thank all participants of this study and the support provided by Jiangsu University.
Conflict of interestThe authors declare that the research was conducted in the absence of any commercial or financial relationships that could be construed as a potential conflict of interest.
Publisher’s noteAll claims expressed in this article are solely those of the authors and do not necessarily represent those of their affiliated organizations, or those of the publisher, the editors and the reviewers. Any product that may be evaluated in this article, or claim that may be made by its manufacturer, is not guaranteed or endorsed by the publisher.
Supplementary materialThe Supplementary Material for this article can be found online at: https://www.frontiersin.org/articles/10.3389/fendo.2024.1408781/full#supplementary-material
Supplementary Figure 1 | Distribution of CMI data.
Supplementary Figure 2 | Presentation of the Restricted cubic spline (RCS) analysis of the complete dataset, with the x-axis displaying the full range of CMI values (based on model 3, adjusted for age, gender, race, annual household income, education level, physical activity level, smoking status, ALT (U/L), AST (U/L), GGT (U/L), albumin (g/L), BUN (mmol/L), Scr (umol/L), SUA (umol/L), eGFR class, BMI class, FPG (mmol/L), HbA1c (%), LDL-c (mg/dl), TC(mg/dl), Cardiovascular disease prevalence, Diabetes prevalence, and Hypertension prevalence).
References1. Miller AW, Penniston KL, Fitzpatrick K, Agudelo J, Tasian G, Lange D. Mechanisms of the intestinal and urinary microbiome in kidney stone disease. Nat Rev Urol. (2022) 19(12):695–707. doi: 10.1038/s41585-022-00647-5
PubMed Abstract | Crossref Full Text | Google Scholar
2. Ganesan C, Holmes M, Liu S, Montez-Rath M, Conti S, Chang TC, et al. Kidney stone events after kidney transplant in the United States. Clin J Am Soc Nephrol. (2023) 18(6):777–84. doi: 10.2215/cjn.0000000000000176
PubMed Abstract | Crossref Full Text | Google Scholar
4. Dhondup T, Kittanamongkolchai W, Vaughan LE, Mehta RA, Chhina JK, Enders FT, et al. Risk of ESRD and mortality in kidney and bladder stone formers. Am J Kidney Dis. (2018) 72(6):790–7. doi: 10.1053/j.ajkd.2018.06.012
PubMed Abstract | Crossref Full Text | Google Scholar
7. Zhang XZ, Lei XX, Jiang YL, Zhao LM, Zou CY, Bai YJ, et al. Application of metabolomics in urolithiasis: the discovery and usage of succinate. Signal Transduct Target Ther. (2023) 8(1):41. doi: 10.1038/s41392-023-01311-z
PubMed Abstract | Crossref Full Text | Google Scholar
8. Qiu F, Xu Y, Ji X, Pu J, Zhou J, Huang Y. Incidence and correlation of metabolic syndrome and kidney stones in a healthy screening population. Trans Androl Urol. (2021) 10(9):3646–55. doi: 10.21037/tau-21-689
Crossref Full Text | Google Scholar
10. Lee MR, Ke HL, Huang JC, Huang SP, Geng JH. Obesity-related indices and its association with kidney stone disease: a cross-sectional and longitudinal cohort study. Urolithiasis. (2022) 50(1):55–63. doi: 10.1007/s00240-021-01288-w
PubMed Abstract | Crossref Full Text | Google Scholar
11. Chang CW, Ke HL, Lee JI, Lee YC, Jhan JH, Wang HS, et al. Metabolic syndrome increases the risk of kidney stone disease: A cross-sectional and longitudinal cohort study. J Pers Med. (2021) 11(11). doi: 10.3390/jpm11111154
Crossref Full Text | Google Scholar
12. Lovegrove CE, Bešević J, Wiberg A, Lacey B, Littlejohns TJ, Allen NE, et al. Central adiposity increases risk of kidney stone disease through effects on serum calcium concentrations. J Am Soc Nephrol. (2023) 34(12):1991–2011. doi: 10.1681/asn.0000000000000238
PubMed Abstract | Crossref Full Text | Google Scholar
13. Wang J, Yang Z, Bai Y, Yin S, Cui J, Xiao Y, et al. Association between visceral adiposity index and kidney stones in American adults: A cross-sectional analysis of NHANES 2007-2018. Front Nutr. (2022) 9:994669. doi: 10.3389/fnut.2022.994669
PubMed Abstract | Crossref Full Text | Google Scholar
14. Hsi RS, Yan PL, Maalouf NM, Best SL, Asplin JR, Shahinian V, et al. Thiazide dose, urine calcium, and symptomatic kidney stone events. JAMA Netw Open. (2024) 7(8):e2428953. doi: 10.1001/jamanetworkopen.2024.28953
PubMed Abstract | Crossref Full Text | Google Scholar
15. Hawkins-Van Der Cingel G, Walsh SB, Eckardt KU, Knauf F. Oxalate metabolism: from kidney stones to cardiovascular disease. Mayo Clin Proc. (2024) 99(7):1149–61. doi: 10.1016/j.mayocp.2024.02.006
PubMed Abstract | Crossref Full Text | Google Scholar
16. Wakabayashi I, Sotoda Y, Hirooka S, Orita H. Association between cardiometabolic index and atherosclerotic progression in patients with peripheral arterial disease. Clin Chim Acta. (2015) 446:231–6. doi: 10.1016/j.cca.2015.04.020
PubMed Abstract | Crossref Full Text | Google Scholar
17. Orsi E, Solini A, Penno G, Bonora E, Fondelli C, Trevisan R, et al. Body mass index versus surrogate measures of central adiposity as independent predictors of mortality in type 2 diabetes. Cardiovasc Diabetol. (2022) 21(1):266. doi: 10.1186/s12933-022-01706-2
PubMed Abstract | Crossref Full Text | Google Scholar
18. Hajian-Tilaki K, Heidari B. Variations in the pattern and distribution of non-obese components of metabolic syndrome across different obesity phenotypes among Iranian adults’ population. Diabetes Metab Syndr. (2019) 13:2419–24. doi: 10.1016/j.dsx.2019.06.003
PubMed Abstract | Crossref Full Text | Google Scholar
19. Li FE, Luo Y, Zhang FL, Zhang P, Liu D, Ta S, et al. Association between cardiometabolic index and stroke: A population- based cross-sectional study. Curr Neurovasc Res. (2021) 18(3):324–32. doi: 10.2174/1567202618666211013123557
PubMed Abstract | Crossref Full Text | Google Scholar
20. Duan S, Yang D, Xia H, Ren Z, Chen J, Yao S. Cardiometabolic index: A new predictor for metabolic associated fatty liver disease in Chinese adults. Front Endocrinol. (2022) 13:1004855. doi: 10.3389/fendo.2022.1004855
Crossref Full Text | Google Scholar
21. Merkin SS, Karlamangla A, Elashoff D, Grogan T, Seeman T. Change in cardiometabolic score and incidence of cardiovascular disease: the multi-ethnic study of atherosclerosis. Ann Epidemiol. (2015) 25(12):912–7.e1. doi: 10.1016/j.annepidem.2015.09.006
PubMed Abstract | Crossref Full Text | Google Scholar
22. Zha F, Cao C, Hong M, Hou H, Zhang Q, Tang B, et al. The nonlinear correlation between the cardiometabolic index and the risk of diabetes: A retrospective Japanese cohort study. Front Endocrinol (Lausanne). (2023) 14:1120277. doi: 10.3389/fendo.2023.1120277
PubMed Abstract | Crossref Full Text | Google Scholar
23. Miao M, Deng X, Wang Z, Jiang D, Lai S, Yu S, et al. Cardiometabolic index is associated with urinary albumin excretion and renal function in aged person over 60: Data from NHANES 2011-2018. Int J Cardiol. (2023) 384:76–81. doi: 10.1016/j.ijcard.2023.04.017
PubMed Abstract | Crossref Full Text | Google Scholar
24. Du YZ, Dong QX, Hu HJ, Guo B, Li YH, Zhang J, et al. A cross-sectional analysis of the relationship between the non-high density to high density lipoprotein cholesterol ratio (NHHR) and kidney stone risk in American adults. Lipids Health Dis. (2024) 23(1):158. doi: 10.1186/s12944-024-02150-9
PubMed Abstract | Crossref Full Text | Google Scholar
25. Wakabayashi I, Daimon T. The “cardiometabolic index” as a new marker determined by adiposity and blood lipids for discrimination of diabetes mellitus. Clin Chim Acta. (2015) 438:274–8. doi: 10.1016/j.cca.2014.08.042
PubMed Abstract | Crossref Full Text | Google Scholar
26. Hill AJ, Basourakos SP, Lewicki P, Wu X, Arenas-Gallo C, Chuang D, et al. Incidence of kidney stones in the United States: the continuous national health and nutrition examination survey. J Urol. (2022) 207(4):851–6. doi: 10.1097/ju.0000000000002331
PubMed Abstract | Crossref Full Text | Google Scholar
27. Abufaraj M, Siyam A, Xu T, Imm K, Cao C, Waldoer T, et al. Association between body fat mass and kidney stones in US adults: analysis of the national health and nutrition examination survey 2011-2018. Eur Urol Focus. (2022) 8(2):580–7. doi: 10.1016/j.euf.2021.03.010
PubMed Abstract | Crossref Full Text | Google Scholar
28. Ye Z, Xiao H, Liu G, Qiao Y, Zhao Y, Ji Z, et al. Subcutaneous adipose tissue accumulation is an independent risk factor of urinary stone in young people. Front Endocrinol (Lausanne). (2022) 13:865930. doi: 10.3389/fendo.2022.865930
PubMed Abstract | Crossref Full Text | Google Scholar
29. Wu M, Liu M, Zhang Y, Wu J, Gao M, Huang F, et al. Serum HDL partially mediates the association between exposure to volatile organic compounds and kidney stones: A nationally representative cross-sectional study from NHANES. Sci Total Environ. (2024) 907:167915. doi: 10.1016/j.scitotenv.2023.167915
PubMed Abstract | Crossref Full Text | Google Scholar
30. Zhao H, Fang L, Chen Y, Ma Y, Xu S, Ni J, et al. Associations of exposure to heavy metal mixtures with kidney stone among U.S. adults: A cross-sectional study. Environ Sci pollut Res Int. (2023) 30(42):96591–603. doi: 10.1007/s11356-023-29318-7
PubMed Abstract | Crossref Full Text | Google Scholar
31. Wang M, Jian Z, Ma Y, Jin X, Li H, Wang K. Depression increases the risk of kidney stone: Results from the National Health and Nutrition Examination Survey 2007-2018 and Mendelian randomization analysis. J Affect Disord. (2022) 312:17–21. doi: 10.1016/j.jad.2022.06.008
PubMed Abstract | Crossref Full Text | Google Scholar
32. Zhu Z, Liu M, Zhang Y, Wu J, Gao M, Lei T, et al. Risk factors for the comorbidity of osteoporosis/osteopenia and kidney stones: a cross-sectional study. Arch Osteoporos. (2023) 18(1):128. doi: 10.1007/s11657-023-01338-3
PubMed Abstract | Crossref Full Text | Google Scholar
33. Wang Z, Zhao G, Cao Y, Gu T, Yang Q. Association between monocyte to high-density lipoprotein cholesterol ratio and kidney stone: insights from NHANES. Front Endocrinol (Lausanne). (2024) 15:1374376. doi: 10.3389/fendo.2024.1374376
PubMed Abstract | Crossref Full Text | Google Scholar
34. Abufaraj M, Xu T, Cao C, Waldhoer T, Seitz C, D'andrea D, et al. Prevalence and trends in kidney stone among adults in the USA: analyses of national health and nutrition examination survey 2007-2018 data. Eur Urol Focus. (2021) 7(6):1468–75. doi: 10.1016/j.euf.2020.08.011
PubMed Abstract | Crossref Full Text | Google Scholar
35. Ke R, He Y, Chen C. Association between oxidative balance score and kidney stone in United States adults: analysis from NHANES 2007-2018. Front Physiol. (2023) 14:1275750. doi: 10.3389/fphys.2023.1275750
留言 (0)