
記住我


In recent years, the incidence of neurodegenerative diseases has continued to increase globally with age, and is now one of the leading causes of death (1, 2). Neurodegenerative disease is a brain dysfunction caused by the loss of neurons and/or their myelin sheaths which includes both acute and chronic, and this article focuses on chronic neurodegenerative diseases, including Alzheimer’s, Parkinson’s, frontotemporal dementia, and multiple sclerosis. Patients often have lesions of hallmark amyloid deposits in the brain (3), and this pathologic change in the brain is often progressive and irreversible (4). As a result of the direct or indirect effects of altered protein conformation in the brain, patients often experience neurological abnormalities such as cognitive deficits and ataxia, which in turn affects the normal functioning of the patient’s other organ systems (5, 6). Another pathological feature of neurodegenerative diseases is neuronal inflammation, a complex process that involves the lesion and influence between various types of nerve cells, such as microglia and astrocytes (7, 8). In different regions of the brain, neurons will be selectively lost (9). The mechanism may be related to the protein conformational changes mentioned above or excitability downstream of neurotransmitter signaling and so on (10, 11). Therefore, in studies targeting the pathogenesis of neurodegenerative disorders, the application of single-cell multiomics can detect the single-cell multiomics features of neurons that are specifically sensitive to neurodegenerative disease and obtain the specific information of the affected neuronal subtypes, which will provide an invaluable reference for future basic and translational research on cellular heterogeneity in neurodegenerative disease (7, 12). Single-cell multiomics technology is a cellular sequencing method, including single-cell transcriptomics, proteomics, genomics and so on, whose research has increasing popularity in the field of neurodegenerative disease in recent years (13). Through statistics and sequencing of cytogenetic data, methods such as cellular mapping and genealogical analysis are utilized at the cellular level to perform disease studies with greater accuracy (14). Notably, single-cell sequencing is now playing an important role in the analysis of molecular subtypes of susceptible neurons in neurodegenerative diseases as well as the identification of novel mechanisms and therapeutic targets (15). It has also identified changes in the expression of disease-specific genes in certain diseases (16), such as amyotrophic lateral sclerosis which are advancing the course of clinical treatments (17). For the study of various diseases in the field of neuroscience, it is indispensable to explore the lesions at the cellular level. Thus, single-cell genomics has the obvious advantage of precise measurements, so the choice of single-cell sequencing method can undoubtedly complement the existing shortcomings of the research, especially in the context of the current increasing sophistication of single-cell multiomics technologies (18, 19).
The concern in neurodegenerative diseases continues to rise, therefore, there is a need to do a visual data statistical analysis, also known as bibliometric analysis, of existing studies on neurodegenerative diseases using single-cell sequencing. Bibliometric analysis is a method of assessing scholarly outcomes using statistics to quantitatively analyze information from purposeful literature, which includes but not limited to citations, journals, authors, and research institutions (20). The value of bibliometric methods is demonstrated in medical research (21). By fully utilizing the efficacy of bibliometric analysis, we can gain a more comprehensive understanding of the trends in the field of purposeful research (22). In this study, we used CiteSpace and VOSviewer to count the studies on the association between neurodegenerative diseases and single-cell genomics in recent years, aiming to analyze the research trends and hotspots of the related studies through bibliometric methods, and the overall analysis obtained can also be used as a reference for related researchers.
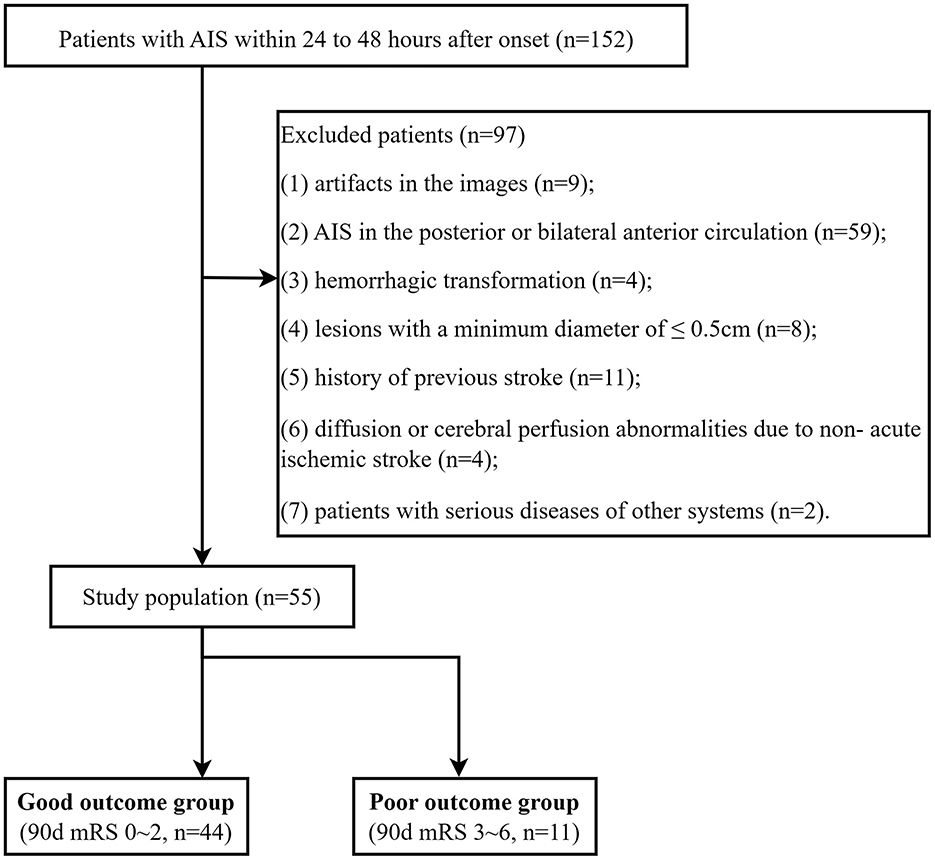
2 Methods 2.1 Data sourcesWeb of Science is a powerful citation search database founded in 1985 which contains a large number of interdisciplinary high-quality literature, providing a platform for researchers around the world to retrieve academic information (23). The search formula chosen for this study was set to TS = (“Single-cell transcriptome” OR “Single-cell RNA-seq” OR “Single-cell transcriptomic” OR “single-cell transcriptomics” OR “Single-Cell RNA sequencing” OR “single-cell multiomics sequencing” OR “Single-cell multiomics” OR “single-cell multiomics” OR “Single-cell genome” OR “Single-cell epigenome” OR “Single-cell epitranscriptome” OR “Single-cell proteome” OR “Single-cell metabolome” OR “scRNA-seq”) AND TS = (Alzheimer’s Disease OR Parkinson’s Disease OR Frontotemporal Dementia OR Multiple Sclerosis OR Neurodegenerative Disease OR Neurodegenerative Disorder OR Neuro-degenerative disease OR Neuro-Degenerative Disorder OR Huntington’s Disease OR Amyotrophic Lateral Sclerosis OR Alzheimers Disease OR Parkinsons Disease OR Huntingtons Disease). We searched all relevant literature between 2015 and 2024, limiting the type of literature to ARTICLE and REVIEW and the language to English during the screening process, thus excluding other types or languages, and retrieved a total of 596 articles. For a more in-depth study of single-cell sequencing, we manually screened a total of 267 articles in the field of ND that were sequenced by the authors themselves and their specific sequencing methods. To prevent data bias due to database updates, all articles in this study were collected and downloaded on June 8, 2024.
2.2 Data analysis and visualizationCiteSpace is a citation visualization and analysis software. Through proper use of CiteSpace, it can assist in the processing of article information and obtain an all-round and in-depth view of the cutting-edge hotspots, key information, potential trends and dynamic changes in a specific research field (24). Under the technical premise of scientometrics and data visualization, CiteSpace can also provide researchers with a diversified perspective for revealing the different fields of citation crossover, knowledge intersection and so on, providing diversified perspectives (25). CiteSpace focuses on the knowledge mapping analysis of literature to reveal the development history and research trends of literature, which helps researchers to have a more in-depth understanding of the past foundations of the research and the emerging hotspots (26). VOSviewer is a JAVA-based literature tracking software for all kinds of web data or literature data for visual analysis. VOSviewer can analyze different indicators of the literature such as the number of citations to the literature, the frequency of keywords, etc. one by one, and generate visual relationship diagrams to help researchers assess the impact of the literature and facilitate their intuitive understanding and analysis. VOSviewer focuses more on cluster analysis of the cited literature, showing the network of relationships between the literature, and is also capable of constructing a collaborative network of authors or institutions, which helps the researcher to understand the competitive or collaborative relationships in the process of research scholarship (27). In our study, we used CiteSpace to analyze reference bursts, keyword bursts, citation authors, journal bi-graph overlays, and reference collaborations and distributions. Meanwhile, we use VOSviewer to analyze country/region and institutional distribution, author distribution and collaboration, and keyword distribution and collaboration.
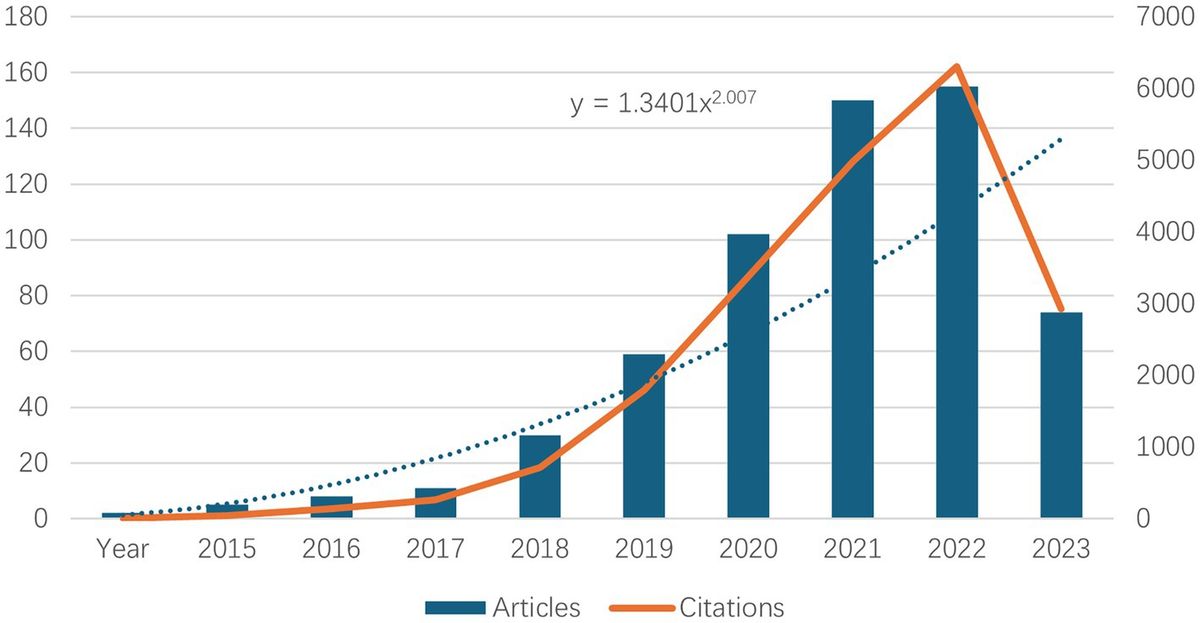
3 Results 3.1 Annual publications and citation trendsThe number of literature publications can reflect directly the scientific activity and process development in a given field. Similarly, the trend in the number of citations can be used to indicate the increase in academic communication. Figure 1 show the number of publications and their corresponding citation trends from 2015 to 2024. It can be seen that the first literature on neurodegenerative disease was published in 2015. Between 2015 and 2023, the number of literature publications about neurodegenerative disease increased annually. The growth rate accelerated significantly between 2019 and 2022, with the highest number of literature publications about neurodegenerative disease in 2023, which was as high as 155. The data for 2024 were not yet available at the time of writing, but it is anticipated that the number of literature publications will continue to increase at a substantial rate, in line with the growth trend observed in Table 1. Concurrently, the number of citations has also risen significantly, indicating that research on neurodegenerative disease is gradually maturing and developing.

Figure 1. Top 10 annual neurodegenerative disease-related publications and number of related citations.
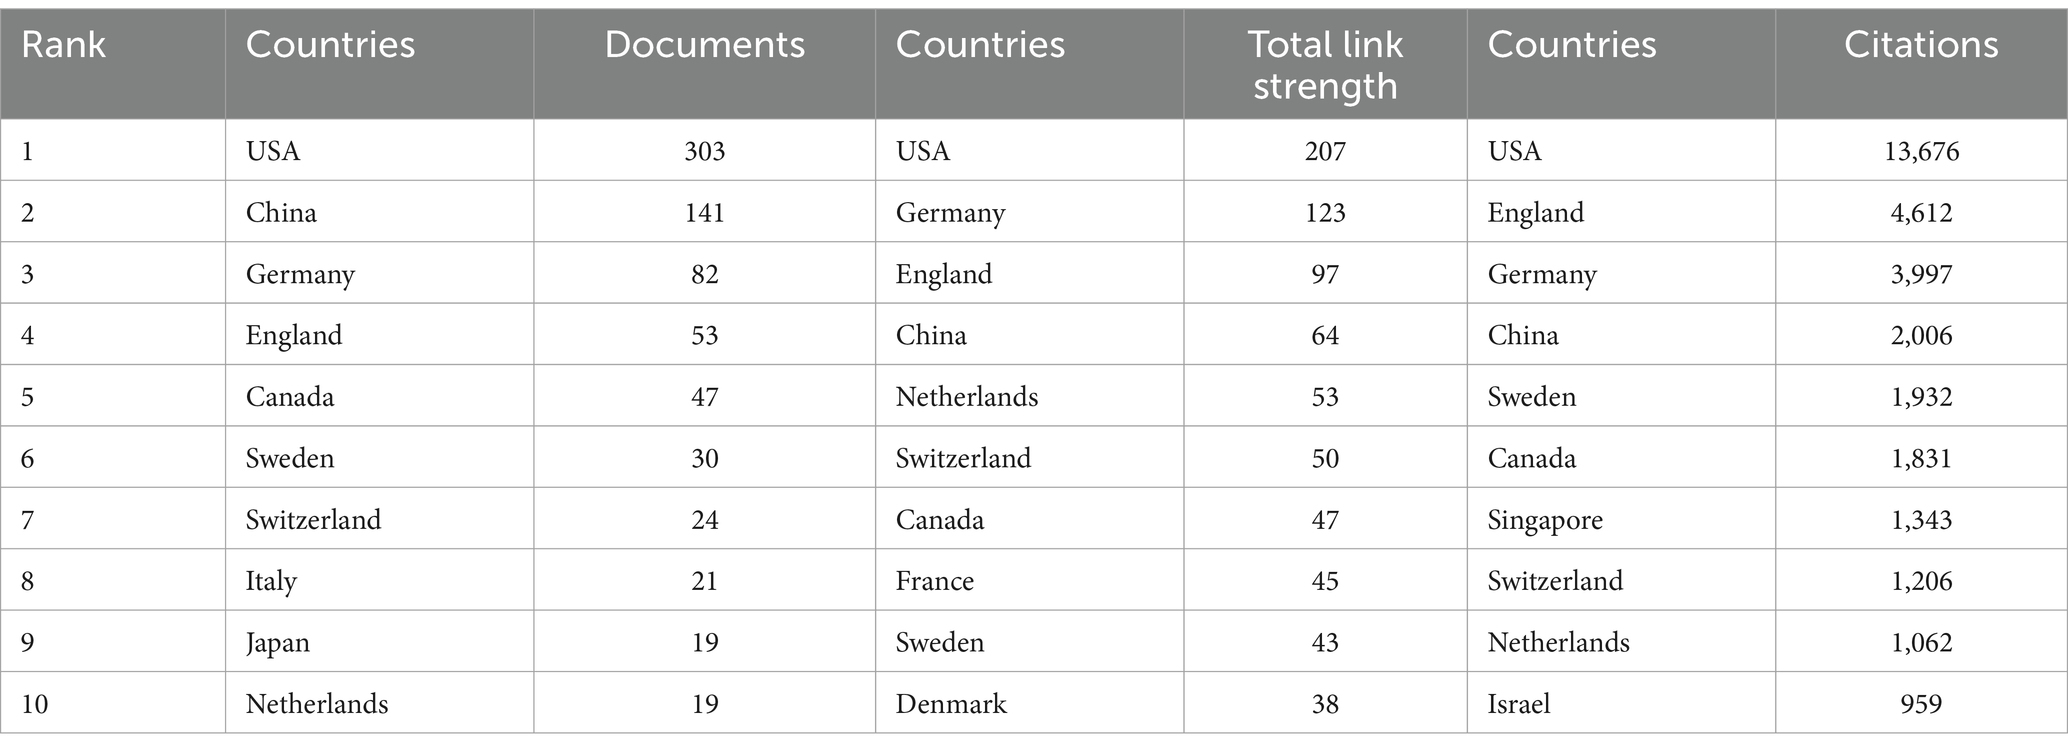
Table 1. Top 10 countries/regions in terms of number of articles published and number of citations accordingly.
3.2 Distribution of country/regionThe geographical nature of literature publication reflects to some extent the contribution of the country or region to the field. Currently, country/regional independent or collaborative research takes place mainly in the Northern Hemisphere. Table 1 shows the top 10 countries/regions, along with their total connection strength and citation frequency. The country/regional distribution of our publications is based on the units of all authors. As can be seen from the table, the country with the highest number of articles published in the field is the United States (303), followed by China (141), Germany (82), and the United Kingdom (53). For citations to the literature, the US has the highest cumulative number of citations (13,676), followed by the UK (4,612), Germany (3,997) and China (2,006), with the cumulative number of citations in the US being almost three times that of the UK. In terms of overall connection strength, the US remains in first place, followed closely by Germany, the UK and China. In all three evaluation dimensions, the United States ranked first, and the role and status it plays in this field is evident. This may be due to the fact that there are many research institutes, associations, and universities in the U.S. that are well funded in the field of ND. At the same time, the United States has accumulated a large number of publications because of the early start of research in ND (28). Meanwhile, the number of publications from the UK is only 53, yet the number of citations is as high as 4,612, indicating that the overall quality of the literature published in the UK in this field is high and the recognition of the academic achievements is high.
As can be seen from Figure 2A, we used Charticulator to perform the data processing and visual analysis, and counted the countries/regions with more than 5 publications in this field and visualized the frequency of their collaborations. Figure 2A shows the cooperation between countries/regions in the field of using single-cell omics to study neurodegenerative disease with the United States and China cooperating most closely, followed by the United States and Germany. Countries/regions with collaborative relationships can support each other in this field of research, promote each other’s academic research process and maximize research efficiency. Figure 2B presents a map of the cooperation between countries and regions. It can be observed that North America, Europe, and East Asia in northern hemisphere are the most active in this field while Russia, Saudi Arabia and India are also involved in research in this direction. In conjunction with Figure 2A, it can be discerned that China and the United States are in frequent contact with Europe.
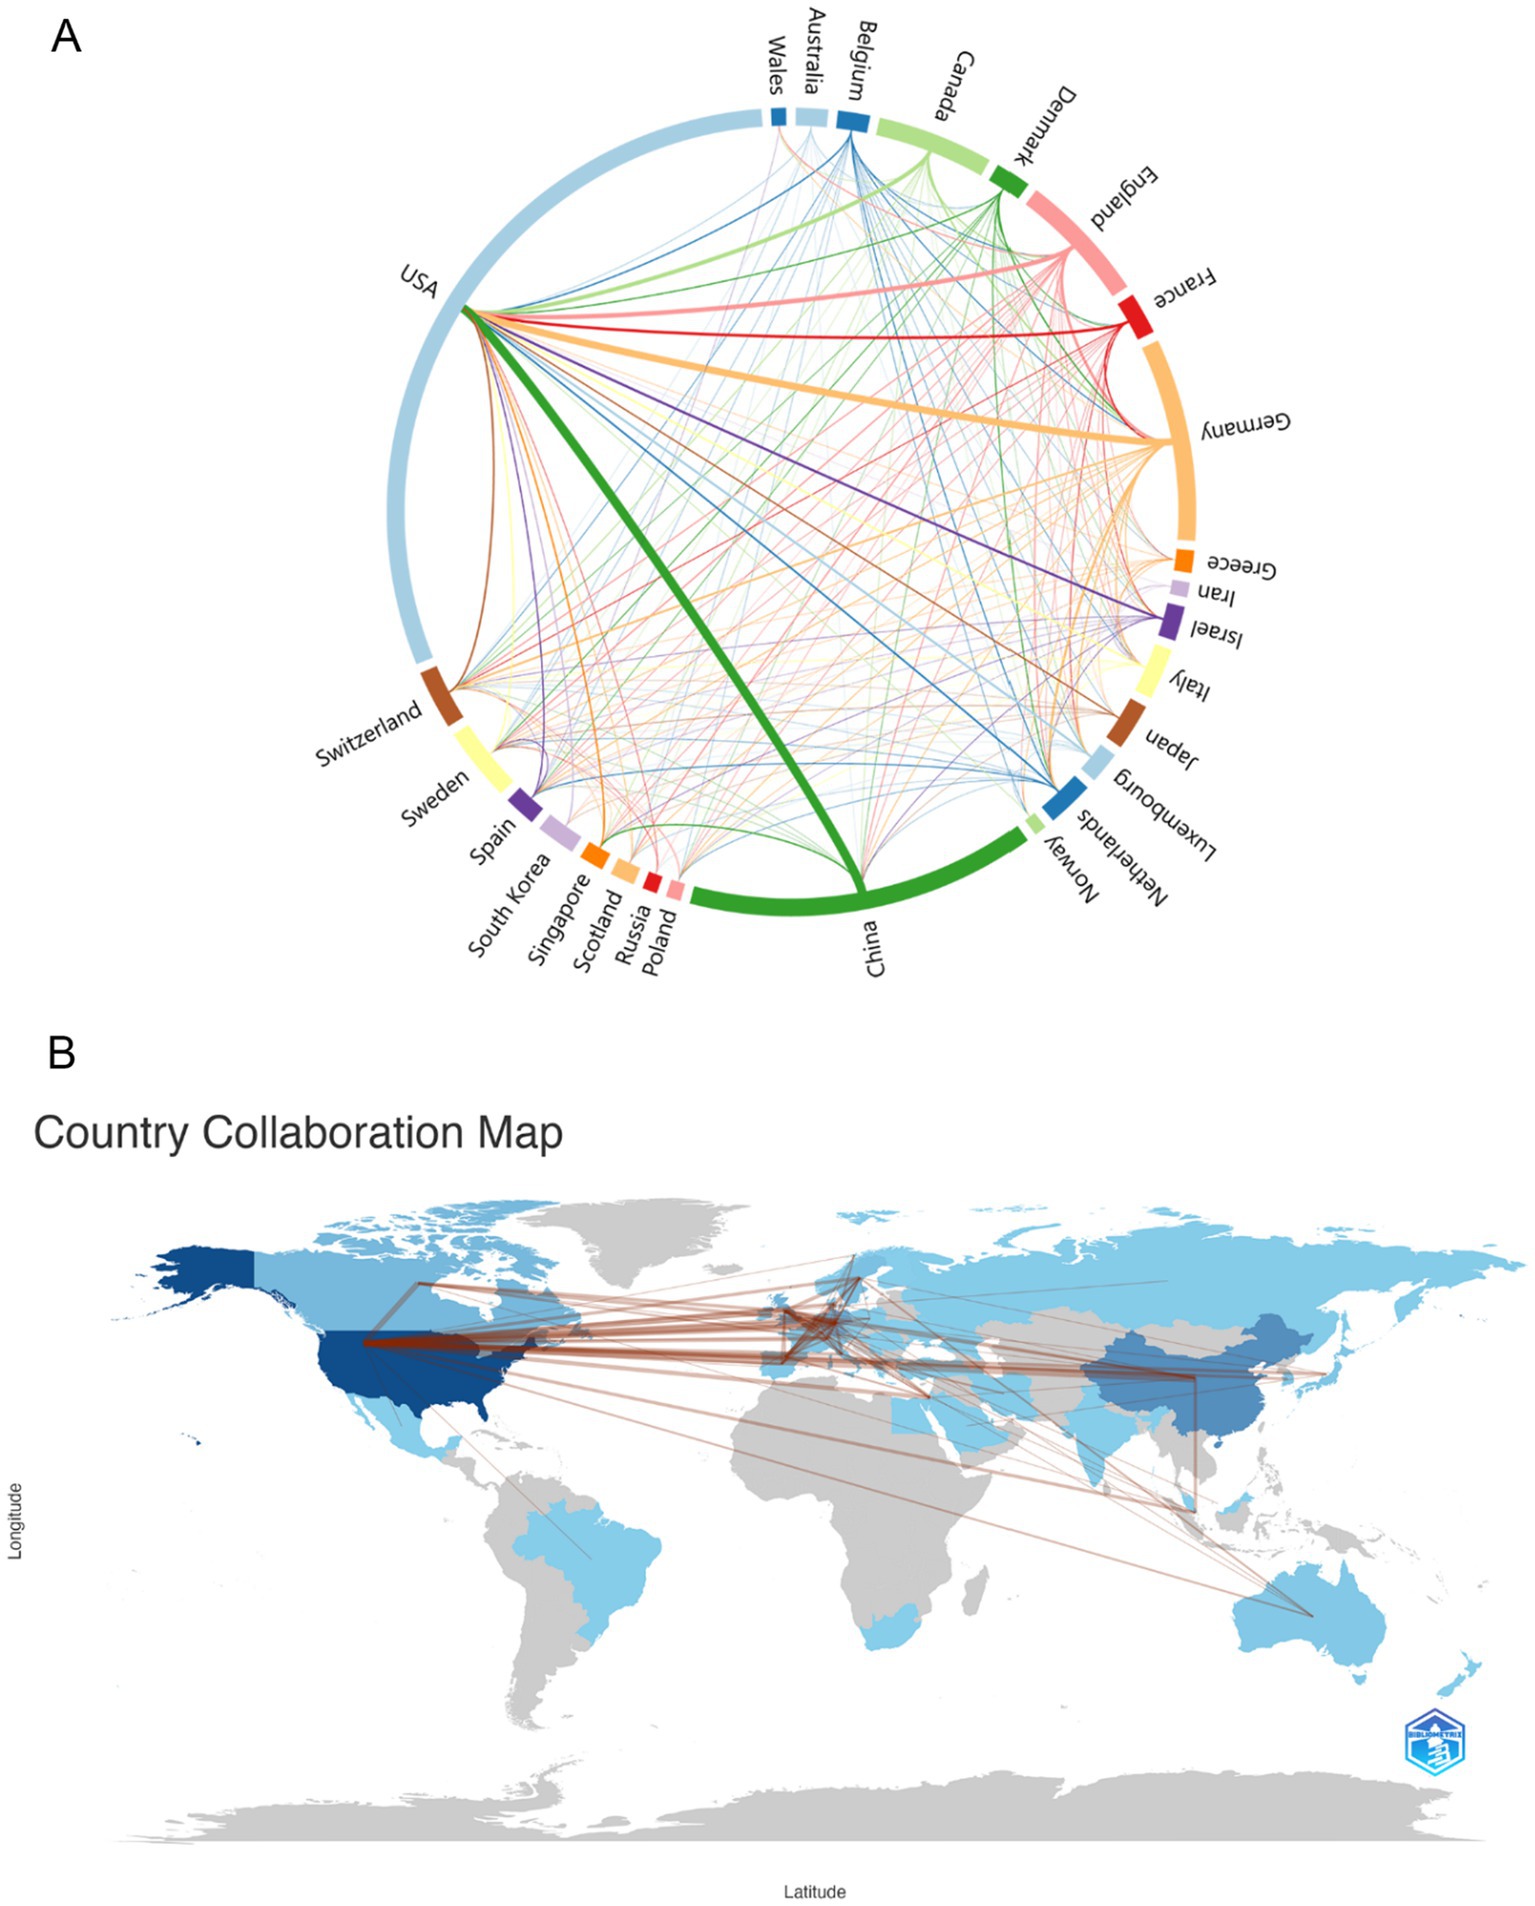
Figure 2. (A) Country/regions that have cooperation. The thickness of the lines reflects the frequency of cooperation, with thicker lines indicating more frequent cooperation. (B) Map of the geographic location of global collaboration. The darker the blue color in the map, the more the country/region collaborates with other countries/regions.
3.3 Distribution by institutionsTable 2 shows the top 10 institutions in terms of number of publications and citations related to single-cell multiomics in the neurodegenerative disease research area. The institution with the highest number of publications was Havard Med Sch (29), followed by Broad Inst MIT & Havard (23), Univ Calif San Diego (23), and Univ Calif San Francisco (22). In terms of the number of citations in the literature, the institution with the highest number of citations was Broad Inst MIT & Havard (4,175), followed by Havard Med Sch (3,018) and MIT (2,568). Most of the top 10 institutions are from the United States, which means that the United States has a significant presence and contribution in this field. The leading status of Havard Med Sch and Broad Inst MIT & Havard among these agencies suggests that these two agencies play a significant role in this regard.
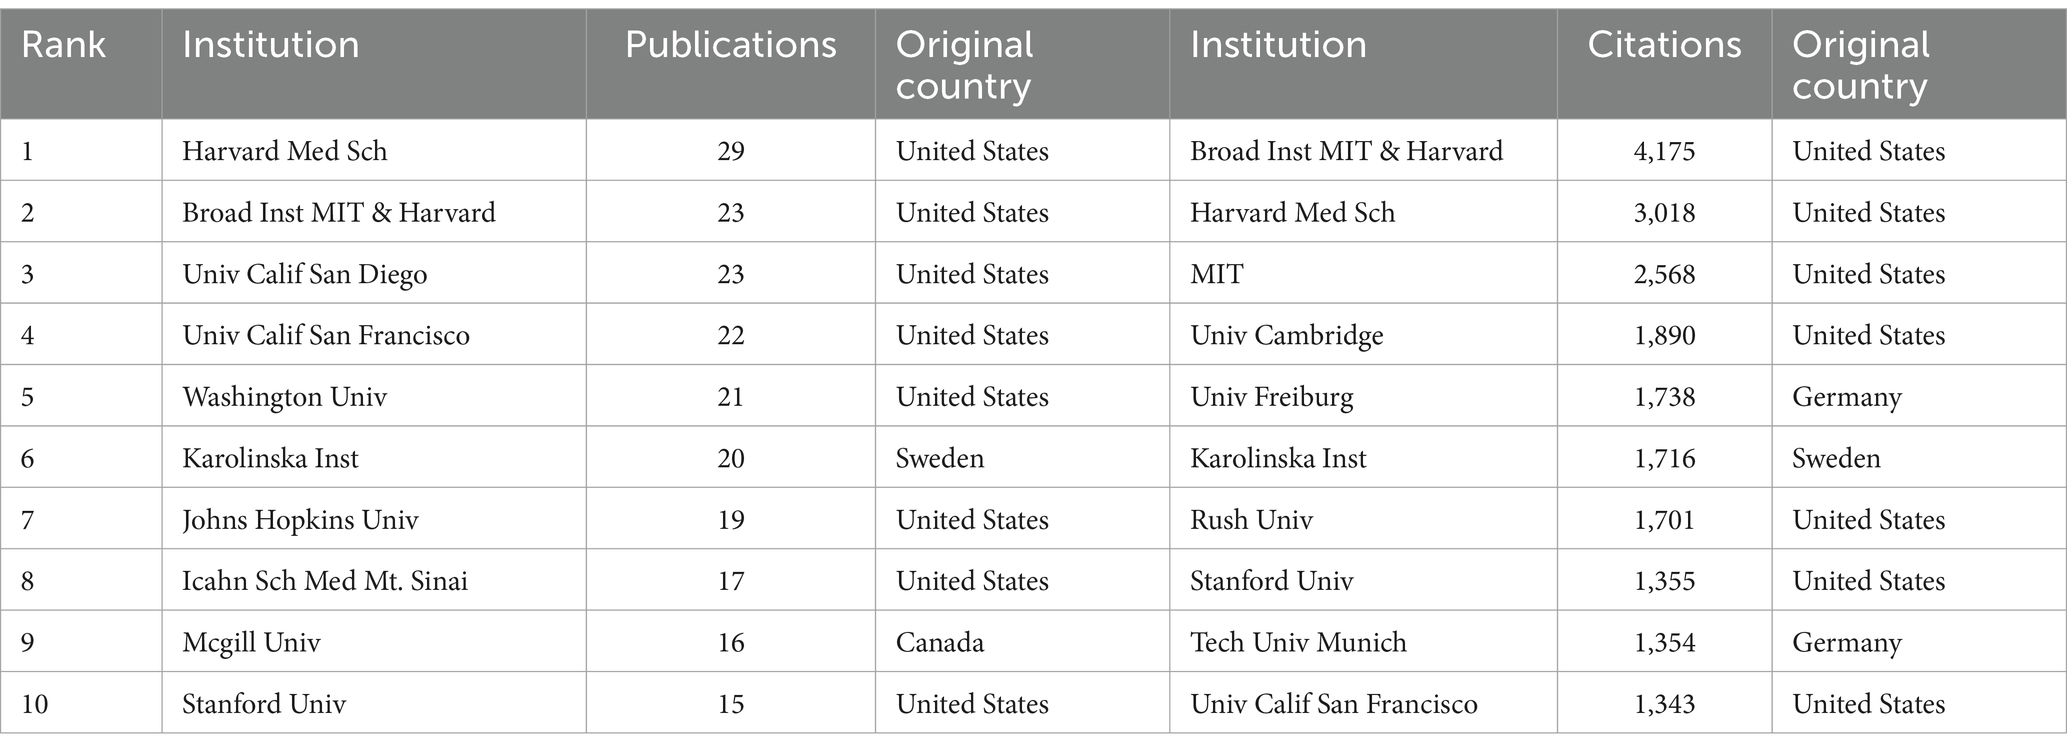
Table 2. Top 10 institutions in neurodegenerative disease related to single cell omics.
Figure 3A, generated by VOSviewer, screens for collaborating institutions with more than 5 publications, revealing the distribution of institutional collaborations in studies related to single-cell multiomics in neurodegenerative disease. The collaborative relationships between institutions are grouped into eight tightly knit clusters, which are differentiated by color in the figure. The network of lines formed by Broad Inst MIT & Havard and Havard Med Sch can be seen to be very densely distributed and occupies a central position in the cooperation map, reflecting the close cooperation and influence of the two. Furthermore, the Stanford University, Chinese Academy of Sciences, and other institutions in the red group, as well as the Johns Hopkins University, University of Pittsburgh, and other institutions in the blue group, engage in close collaboration with the Karolinska Institute and the University of Cambridge, which are included in the purple group. Figure 3B, generated by VOSviewer, shows the average posting time for organizations from 2020.5 to 2022.5. Institutional nodes such as Havard Med Sch & Washington Univ are mainly indicated by light red color, indicating relatively new involvement in this direction but a high number of publications. Some institutions such as Broad Inst MIT & Havard and Karolinska Inst have larger blue nodes, indicating that they have been involved in the field earlier to conduct research. The remaining organizations with smaller nodes with red color, such as Shanghai Jiao Tong Univ and Sun Yat Sen Univ, participated in the study later and published little literature, but may play a leading role in future studies.
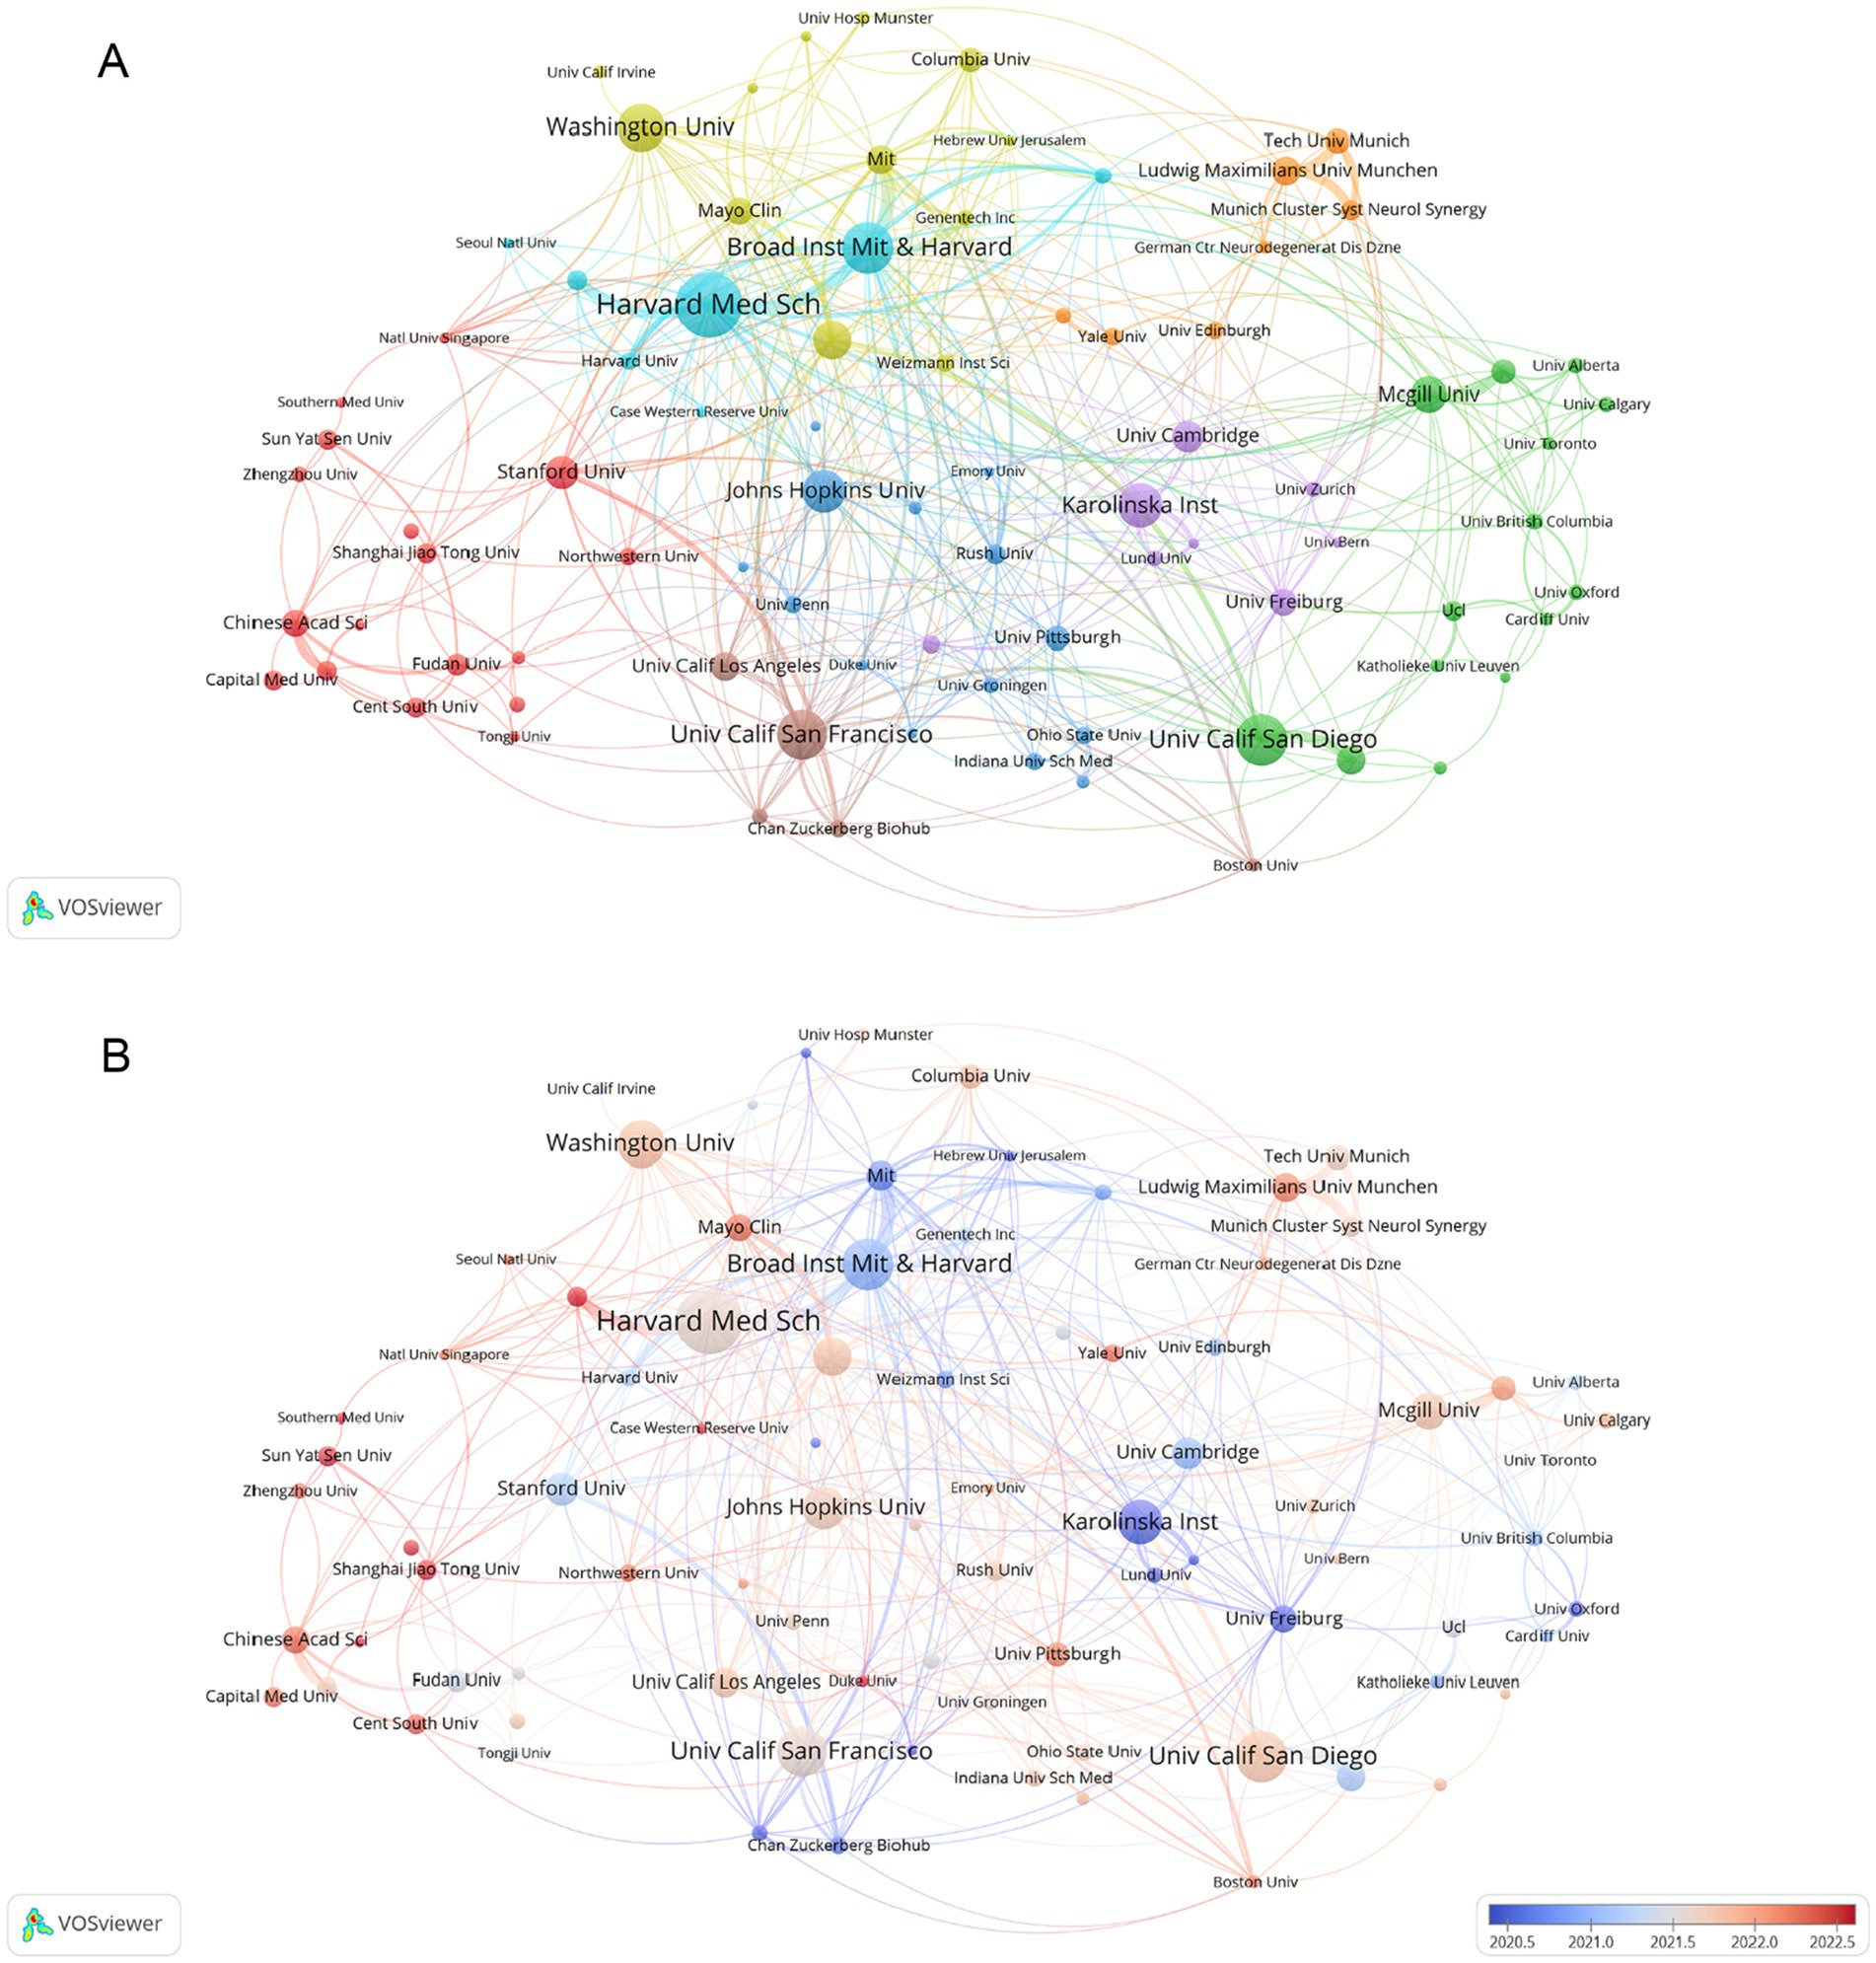
Figure 3. (A) Analysis of collaborative network visualization of different institutions in VOSviewer. The figure shows the collaborative institutions with more than 1 number of documents. The nodes of different colors represent the collaborative relationships between institutions with different clusters, and the size of the nodes indicates their number of publications. (B) The average publication time of the institution is indicated by the color of the node. Blue indicates an earlier average publication time, while red indicates a later average publication time. The size of the node is proportional to the number of articles published by the partner institution.
3.4 Distribution of authorsA co-cited author is a co-cited relationship between two authors when a third author cites both authors. A higher frequency of common citations indicates a closer academic interest and research density (29). Table 3 shows the number of publications, co-citations, affiliation, corresponding country/region, and total link strength for the top 10 authors. Most published authors are Skupin, Alexander (Luxembourg Institute of Health) are Wiendl, Heinz (Universitätsklinikum Münster), both of which have published seven articles. It shows that these two authors have contributed more in this domain. The author with the highest total number of co-citations regarding this line of research is Mathys, H from University of Pittsburgh, with a cumulative total of 185 citations and a total connection strength of 2,654. It is noteworthy that half of the authors who ranked in the top 10 in respect of co-citations in this field were from the United States, reflecting the larger impact and academic credibility of the United States in using single-cell multiomics to study neurodegenerative disease.
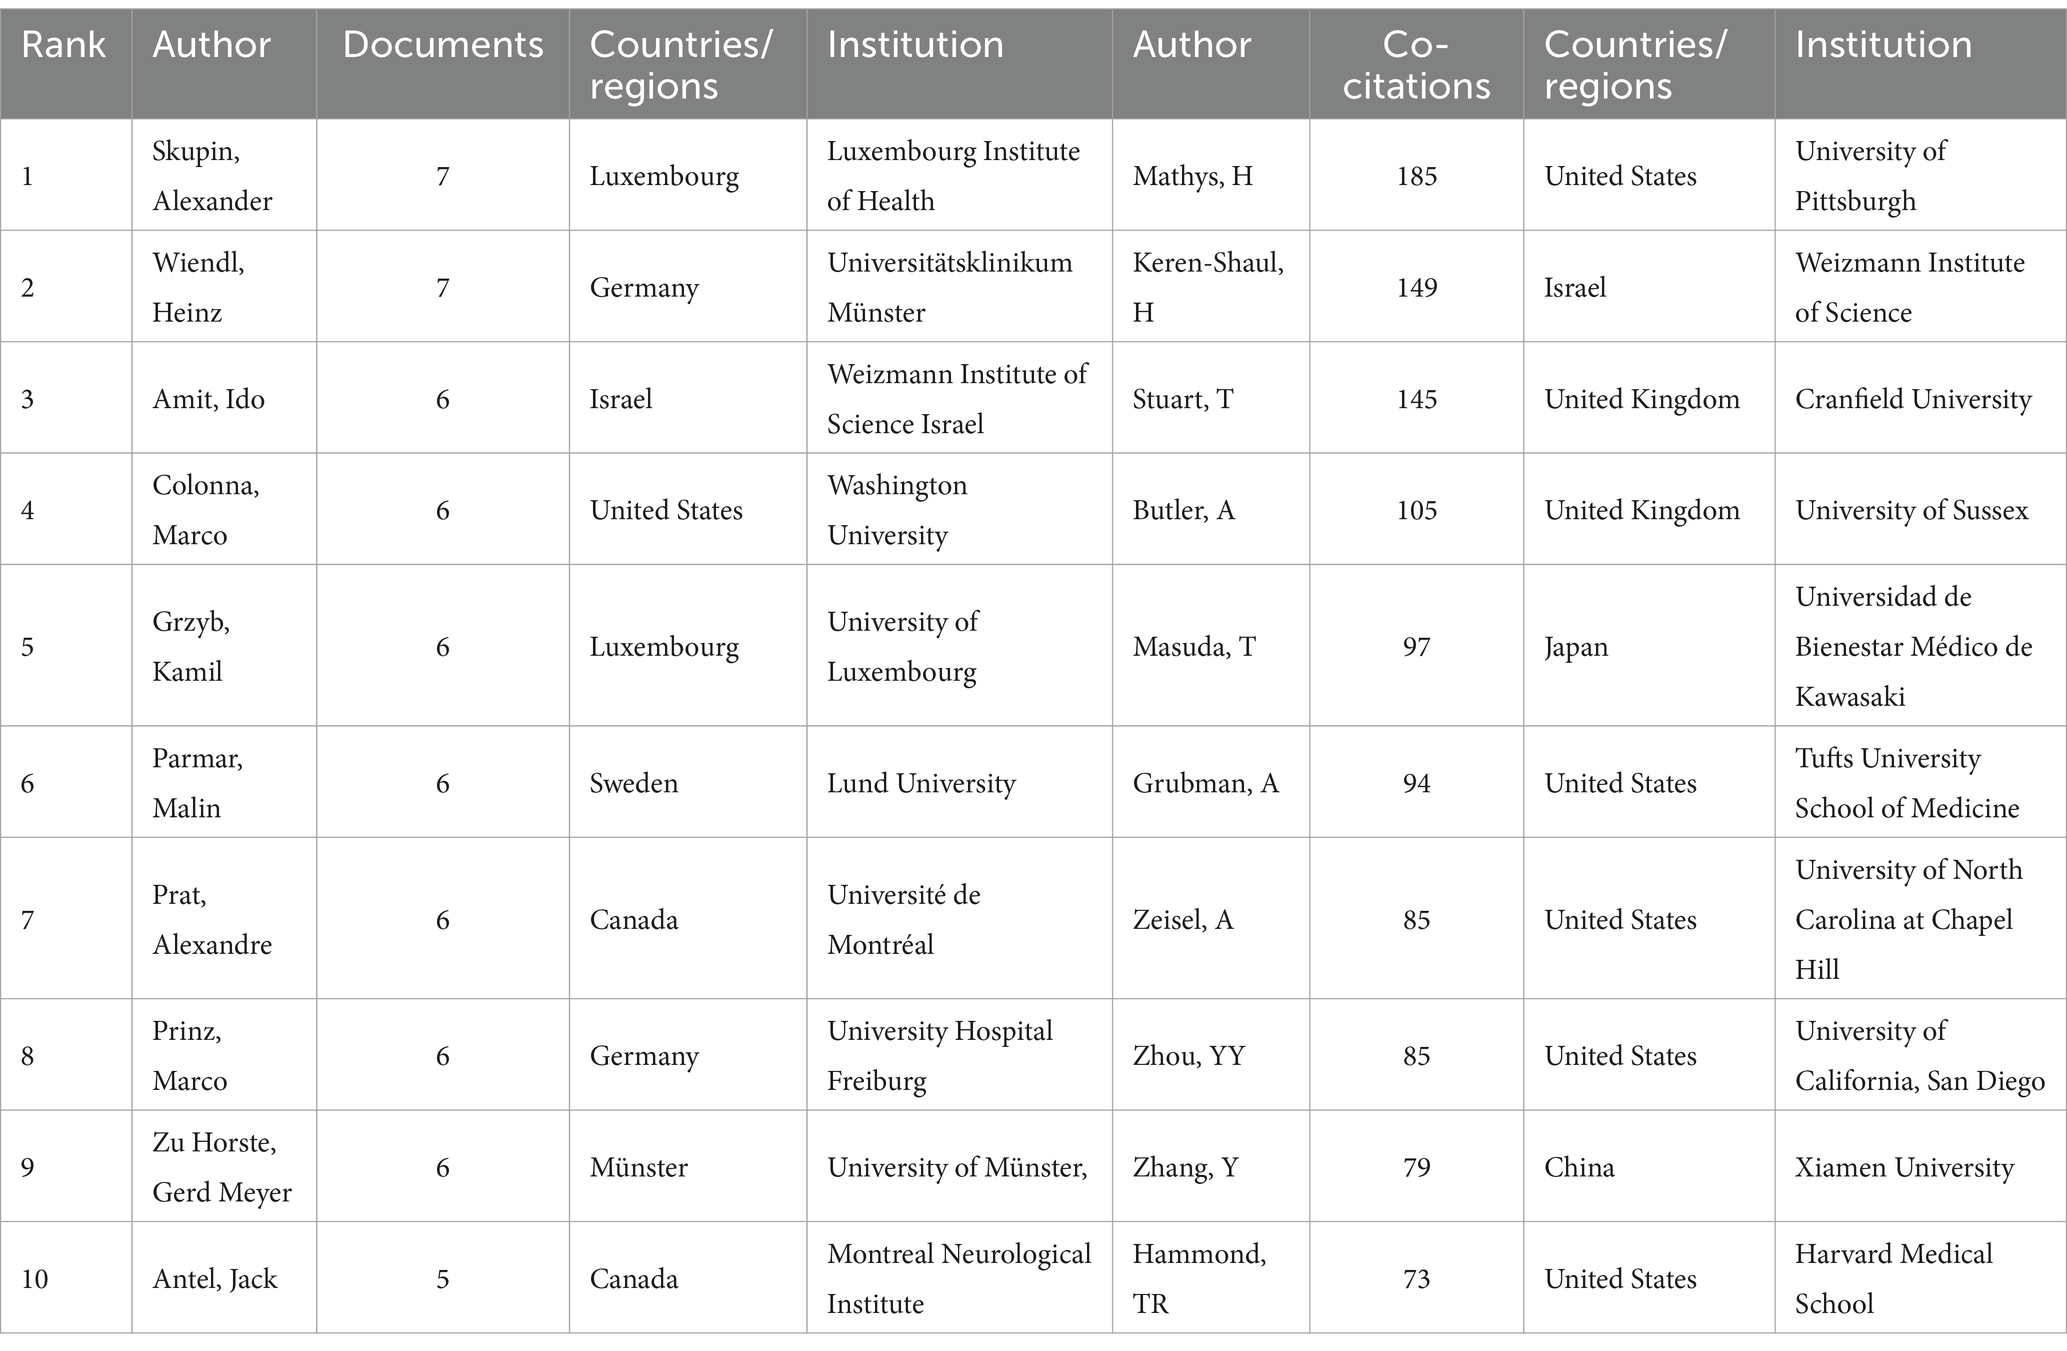
Table 3. Top 10 authors and co-cited authors in neurodegenerative disease related to single-cell multiomics.
We screened co-authors with more than 3 publications and visualized them with VOSviewer. Figure 4A depicts the clusters of co-authors’ collaborations. The more connected group, led by Prat, Alexandre (including Antel, Jack and Zandee, Stephanie et al.), is represented by red, which symbolizes their more frequent collaborations. Next came the yellow-green group (including Skupin, Alexander, and Grzyb et al.) and the green group (including Parmar, Malin, and Gillberg, Linda et al.) In addition, other cluster authors have some collaborations, such as the brown group (including Zu Horste, Gerd Meyer and Wiendl, Heinz et al.) and the light blue group (including Yao, Lifen and Wang Pingping et al.). Figure 4B represents the number of documents produced by co-authors, again, Prat, Alexandre and his co-authors have the larger red nodes, indicating that Prat, Alexandre and Zandee, Stephanie et al. are the core force in this research area and play an significant role in the current research process. In addition, two clusters of co-cited authors, Skupin, Alexander and Colonna, Marco, have published more articles. We also analysed the co-cited-authors of articles in the ND field that were sequenced by the authors themselves, which are pictured in Supplementary Figure S8. By comparing Supplementary Figure S8 with Figure 4B, we found an emerging cluster (in yellow) that consists of Keren-Shaul H and his other co-authors. It indicates that Keren-Shaul H, Wang, Ym, and Krasemann, S et al. have made more use of single-cell sequencing methods in ND research, and have provided helpful databases for single-cell studies in ND. Based on the timeline plot of the authors’ outputs (Supplementary Figure S3) we can see that Amit, Ido and Zhang, Bin published their articles earlier, suggesting that they were early adopters of single-cell multiomics approaches in the field of neurodegenerative disease research. Meanwhile, all authors on the 2021 graph have published relevant literature, indicating that a trend toward applying single-cell multiomics to neurodegenerative disease research arose during this period. As illustrated in the graph of the distribution of corresponding authors by country (Supplementary Figure S2), China and the United States continue to occupy the top positions, with the majority of them exhibiting a greater number of transnational co-authorships than domestic co-authorships. Germany, Canada, the United Kingdom and Sweden followed.
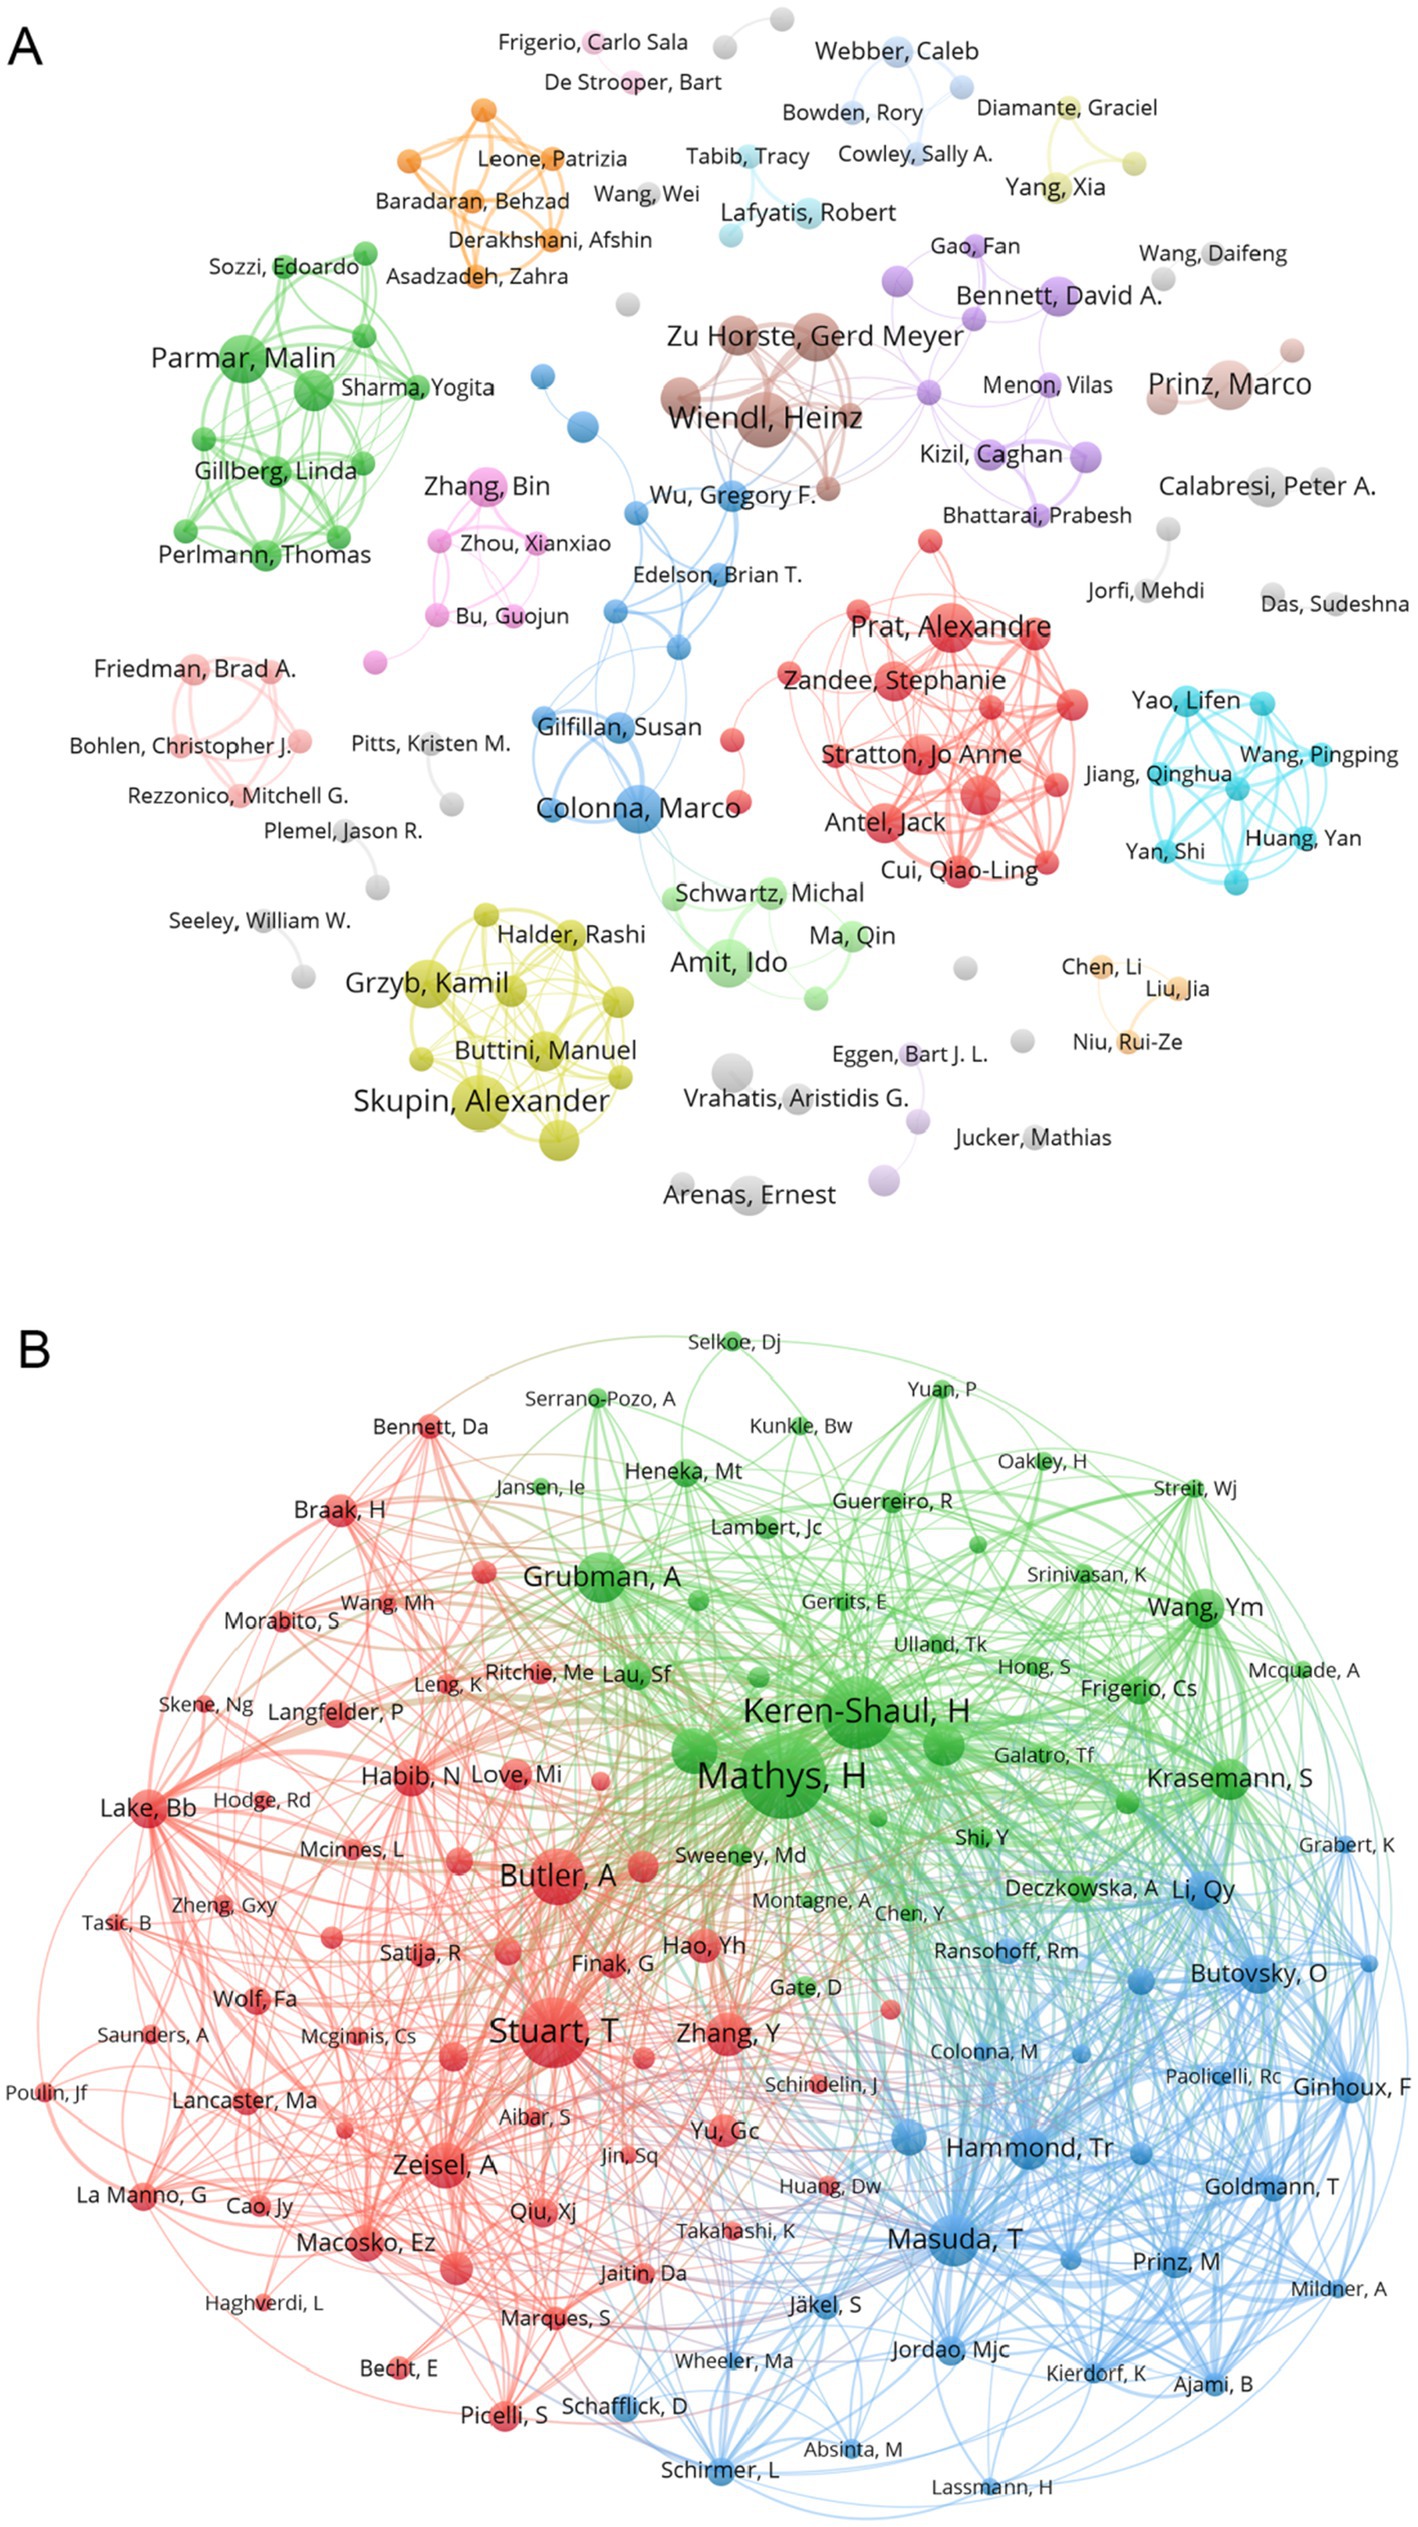
Figure 4. (A) Collaborative network of authors associated with single-cell multiomics in ND. Different colour clusters represent different author collaborations. (B) Co-cited authors in neurodegenerative disease related to single-cell polyomics. Different node colors represent authors in different clusters, with larger nodes representing stronger co-authorship links or a higher number of published articles.
3.5 Distribution of journalWe identified a total of 596 articles on Alzheimer’s disease microglia published in 201 journals. Through the application of VOSviewer, we visualized the number of journal publications and clustering collaboration. As shown in Table 4, the journal with the highest number of relating publications was Nature Communications (29), followed by Frontiers in Immunology (27), Cell Reports (17) and Cells (17). Among the top 10 journals by number of publications, five journals have an IF value of 10 or more. Among the top 10 journals in terms of co-citation frequency, eight journals have an IF value of 10 or more. The most cited journals were Nature (2,021) and Cell (1,770), reflecting the overall high quality of research in the field in these journals. The top 10 journals in terms of publications and the top 10 journals with regard to citations are all from the Q1 division, indicating that journals from the Q1 division are more inclined to be regarded as reliable sources of citations and have a more influential impact. Figure 5A presents the results of the clustering analysis of journals. It is evident that the clustering network diagram of journals is centered on Nature Communications. The journals in the red group are the primary sources of literature in the field, including Nature Communications, Cell Reports, and others. The green group comprises journals that are also highly regarded, such as Frontiers in Immunology and the Journal of Neuroinflammation. The blue group includes journals such as Cells and Scientific Reports, which are also considered to be of significant importance. Among all these groups, red and green groups take center stage. These journals that dominate the field have a higher impact factor and greater authority in their own right. In the field of neuroscience, the Journal of Neuroinflammation is a specialised journal and is therefore favoured by authors. In Supplementary Figure S4, we can see intuitively that the journals with more publications, such as Nature Communications, Cell Reports and Nature, etc. published the relevant literature earlier, indicating that they have made many prospective studies, laying a solid foundation for the subsequent research process. While Brain, International Journal of Molecular Science and Journal of Neuroinflammation are late in publishing relevant literature. As Table 4 and Figure 5B illustrate, the collaborating journals have been classified into four primary clusters. The red cluster encompasses journals such as J. Neuroscience, Glia, and Brain, which concentrate on the neurological aspects of the brain. The blue group encompasses a number of highly regarded scientific journals, including Nature, Neuron, Cell, and Science. These journals cover a diverse range of content and exert a considerable influence within the pharmaceutical field. The green group includes journals such as Nature Methods, Nature Genetics, and Bioinformatics, which focus on bioinformatics. The light green group Includes journals such as Immunity, J Exp Med, and J Immunol, which focus on bioimmunity-related content. Similarly, we analysed the co-cited journals for articles in the field of ND whose authors had performed single-cell sequencing (Supplementary Figure S9). We found some adjustments in the clustering of co-cited journals compared to Figure 5B. The clustering of some of the articles changed, e.g., Nat Neurosci is now grouped with journals such as Neuro and J Neruo. It may indicate that citations to journals categorised according to specialisation are more frequent in articles where single-cell sequencing has been performed.
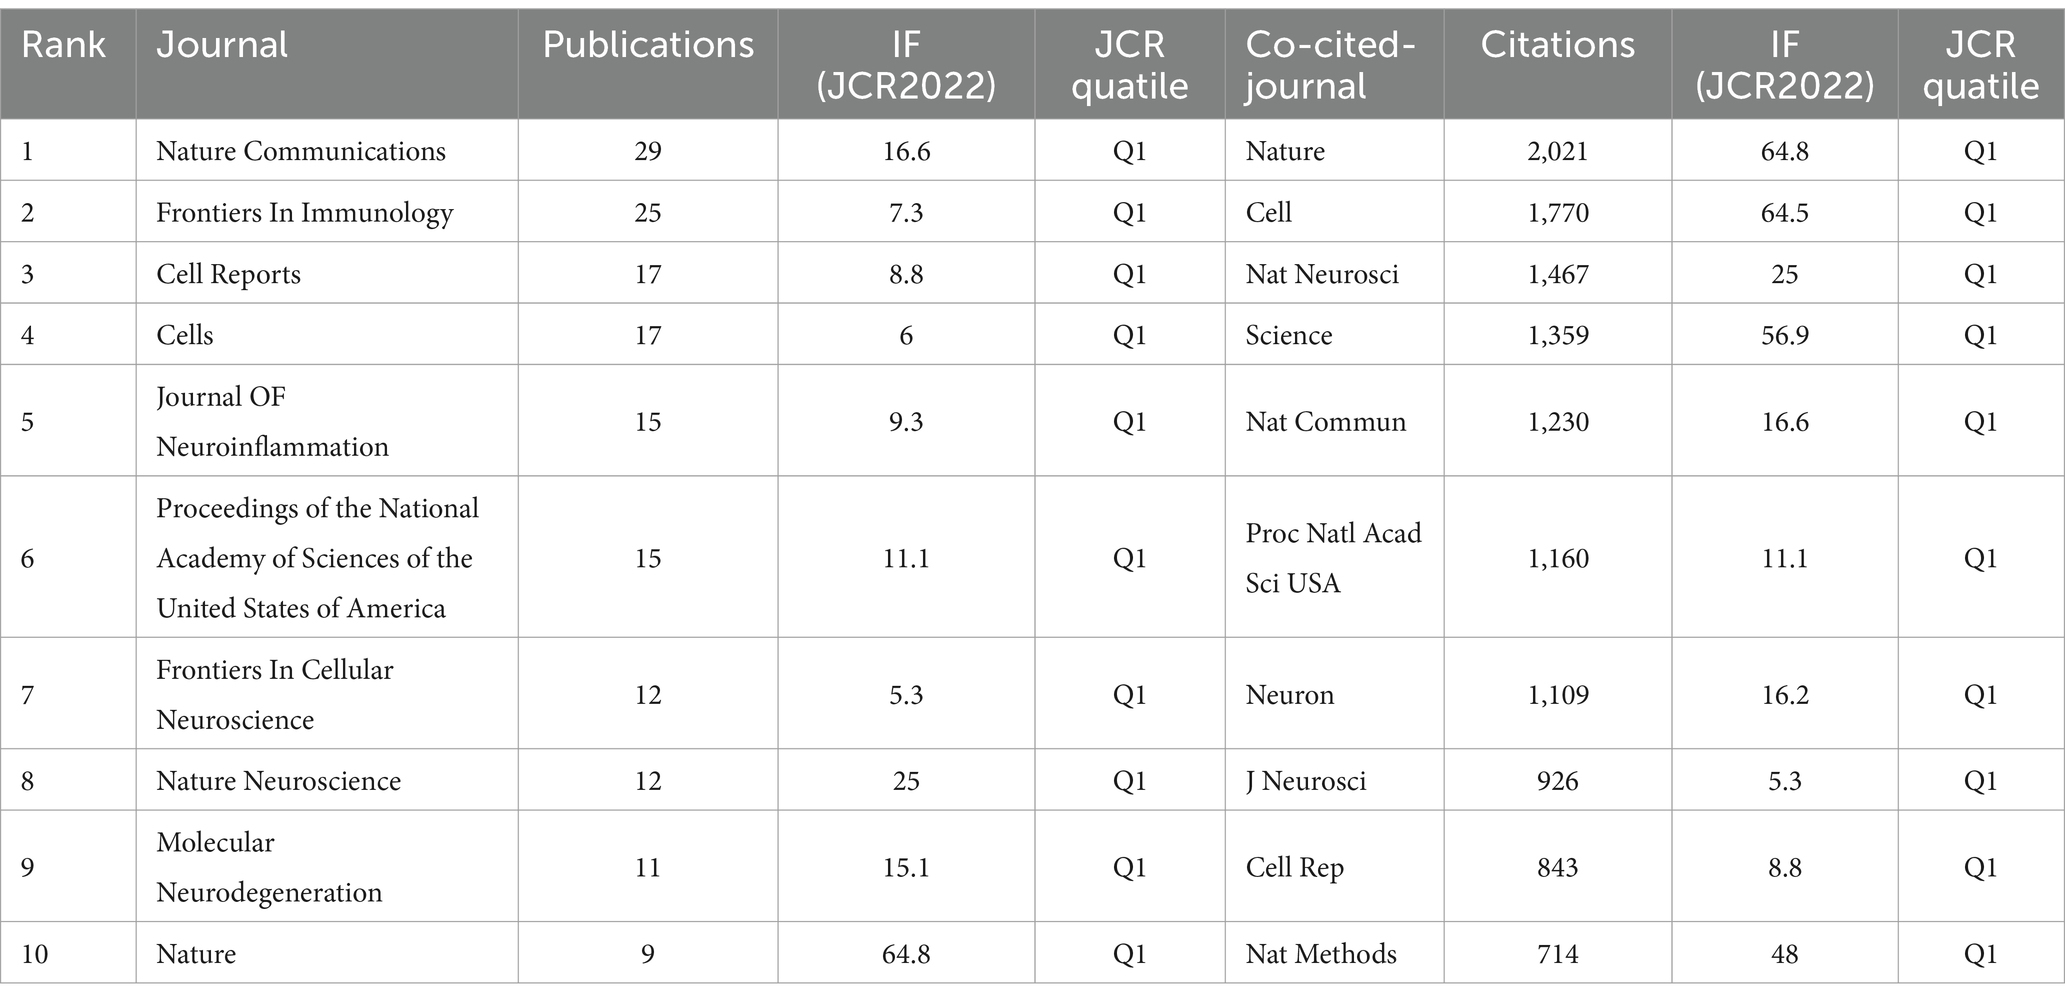
Table 4. Top 10 journals in the neurodegenerative disease field concerning the number of publications and citations related to single-cell polyomics.
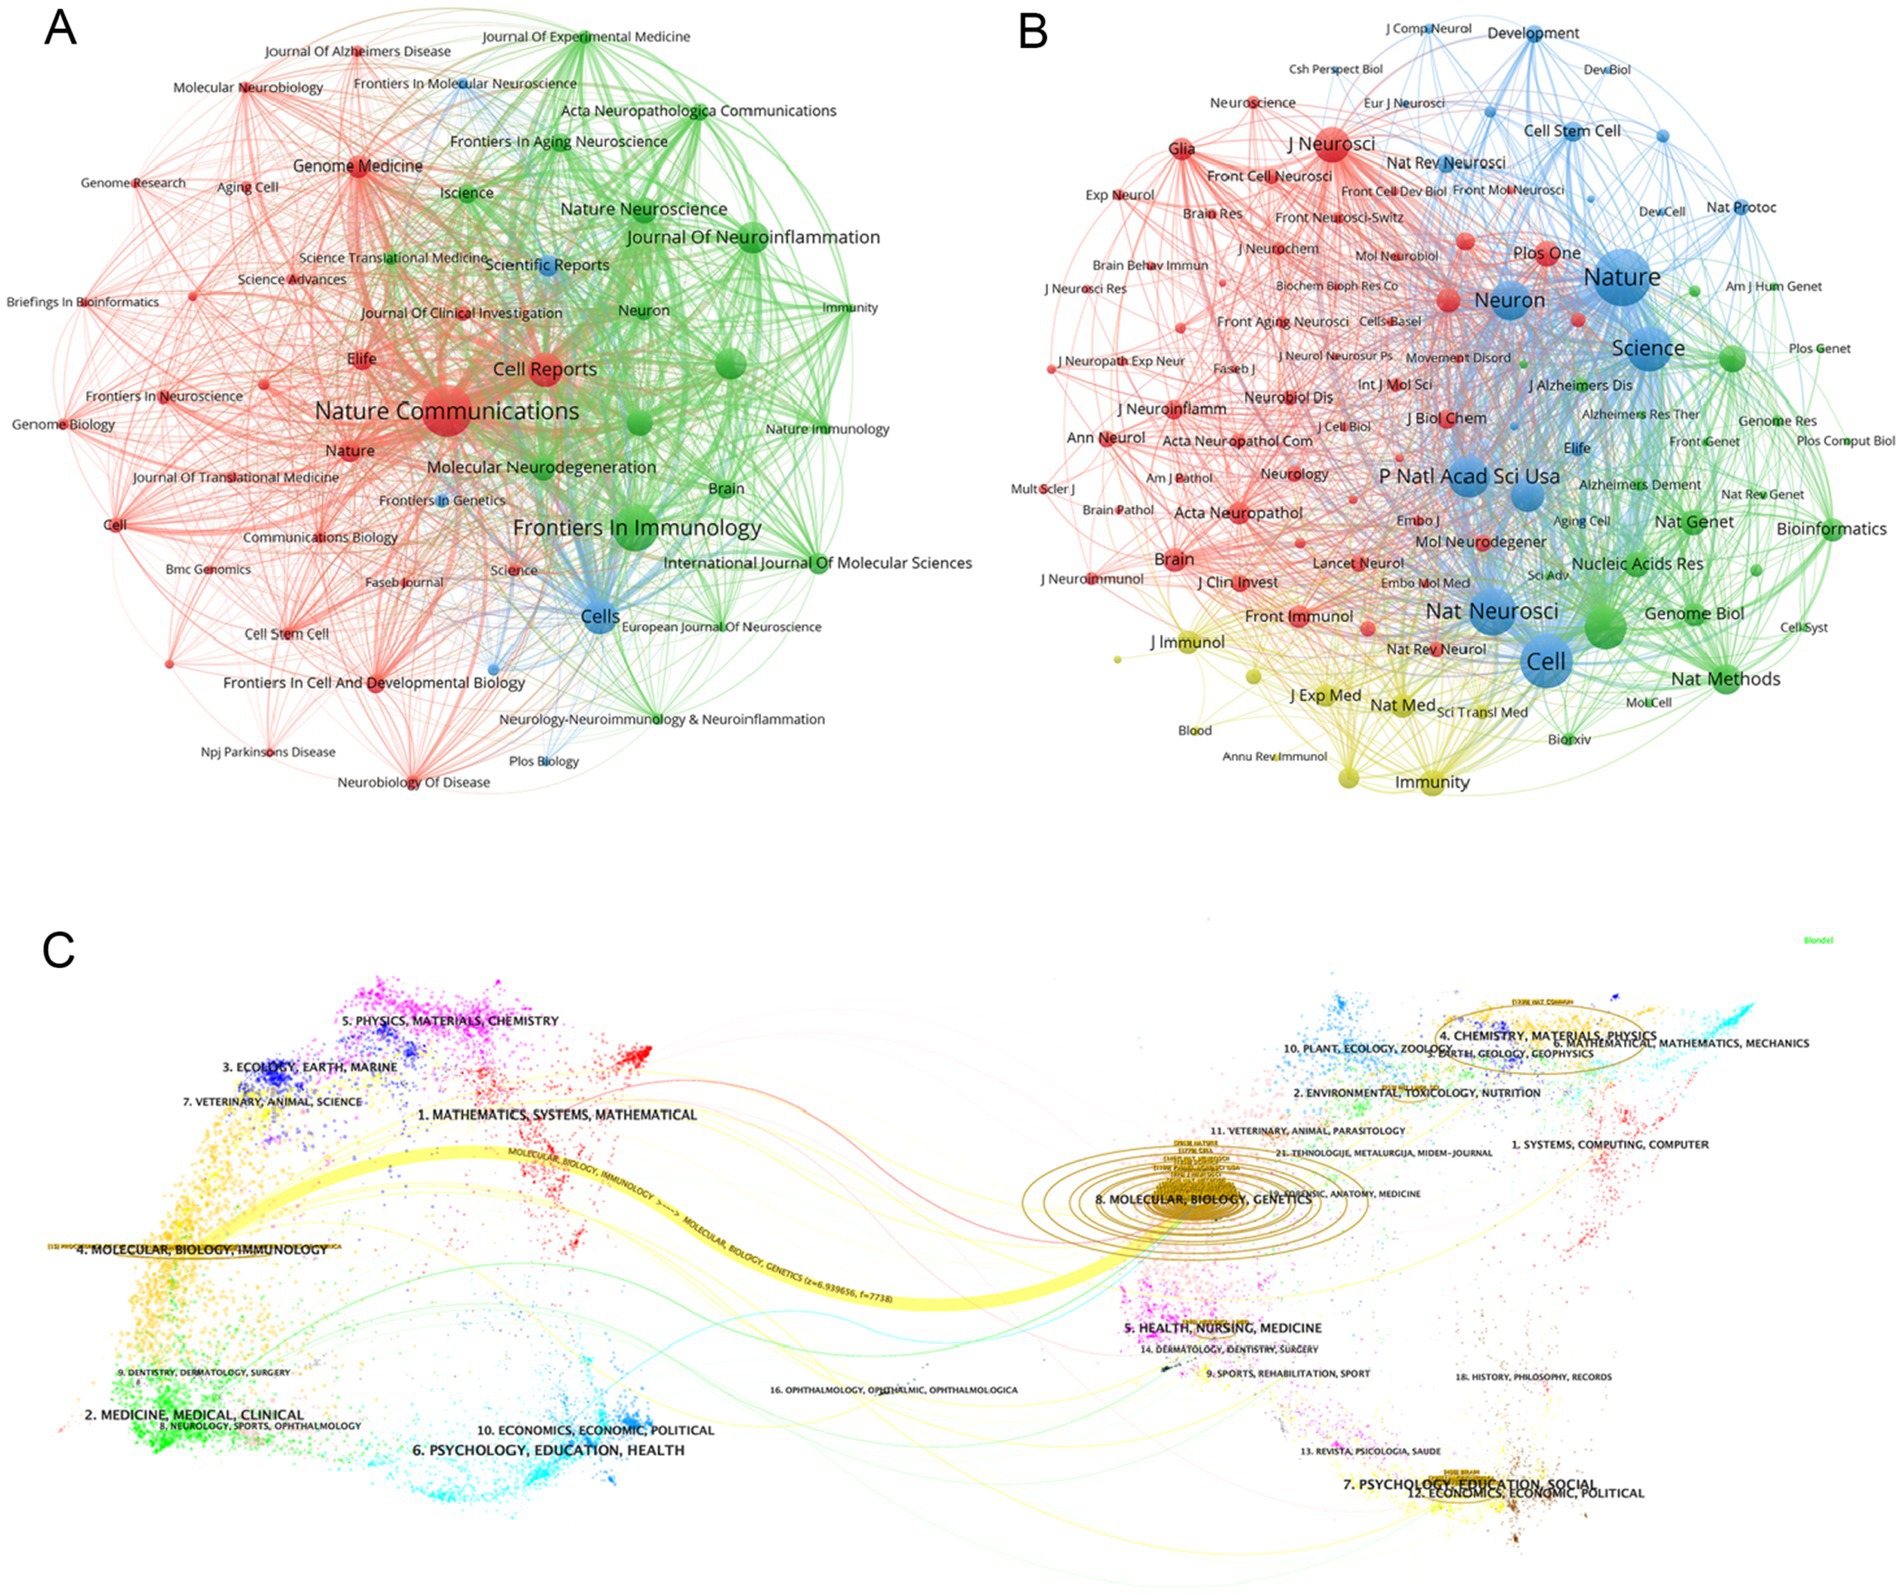
Figure 5. (A) Graph of the number of literature related to single-cell multiomics in journal publication neurodegenerative disease The size of the node area corresponds to the number of journal releases. Different clusters are distinguished by color. (B) Journal collaboration clustering graph. Different colored nodes indicate different clusters of collaborating journals. (C) The dual-map overlay of journals publishing articles related to single-cell multiomics in neurodegenerative disease. The width of the connecting lines represents the strength of the citation relationship, with thicker lines indicating stronger citation relationships.
Figure 5C shows the journal overlay diagram generated by CiteSpace, where journals citing other journals are located on the left side while the cited journals are distributed on the right side. The journal overlay graph can visualize the citation relationship between journals, citation frequency, and the disciplinary crossover between different fields (30). In the figure we observe the most obvious a yellow connecting line connecting the left and right areas, denoting that studies published in journals related to the field of Molecular, Biology, and Genetics mainly cited literature published in journals related to the field of Molecular, Biology, and Immunology, and the two are closely linked under the research direction. At the same time, we can also see that relevant literature from the fields of Medicine, Medical, Clinical, Psychology, Education, Health, and Mathematics, Systems, and Mathematical are highly cited, which means that the theoretical content of the research is closely related to the reality of clinical care. The close connection of the theoretical research content with the reality of clinical medical care further illustrates that the academic intersection of different research fields contributes to our understanding of the use of single-cell multiomics in the context of neurodegenerative disease. The core journal area is clearly visible in Supplementary Figure S5, which includes journals such as Nature Communications, Frontiers in Immunology, and Cell Reports. This is consistent with the data in Table 4. Supplementary Figure S5 graphically visualizes the comparison of journal publications, with Nature Communications and Frontiers in Immunology having about twice as many publications as the other journals.
3.6 The analysis of hotspots and frontiers 3.6.1 Keyword cluster and timing analysisKeywords can succinctly summarize the research focus of an article, and the analysis of keywords assists us in understanding the research focus, research trends, and emerging areas in the intended research direction. Table 5 demonstrates the top 20 keywords that appeared in the articles related to single-cell multiomics in the neurodegenerative disease study. The keywords “single-cell RNA sequencing” (171) and “Alzheimer’s disease” (120) have the highest frequency and the corresponding total link strength. Then followed by “microglia” (68) and “multiple sclerosis” (47). Alzheimer has more publications than other neurodegenerative diseases. This may be due to the fact that Alzheimer’s disease itself has a large patient base, a low cure rate, a high impact on life, and a high level of societal concern (31). At the same time, Alzheimer’s disease has the typical pathological changes of neurodegenerative diseases, and research on Alzheimer’s disease can also contribute to the research on other neurodegenerative diseases to a certain extent.
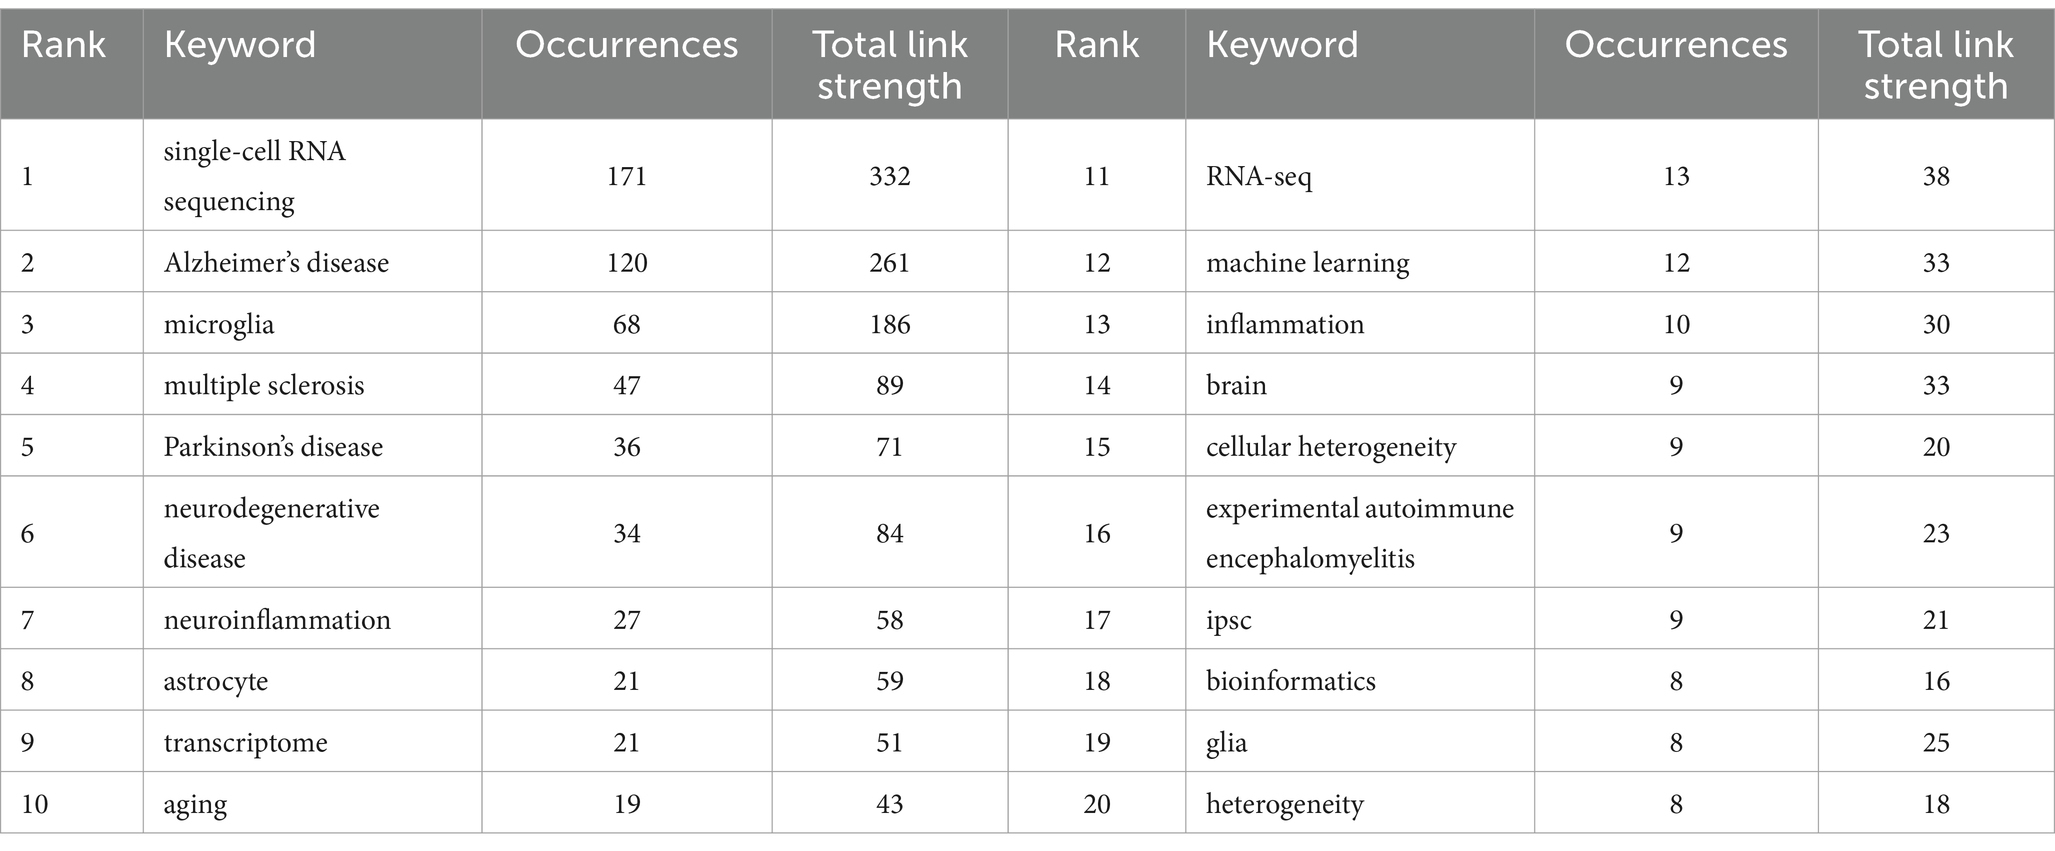
Table 5. Top 20 keywords with appearances related to single-cell polyomics in the neurodegenerative disease field.
The cluster analysis of the keywords is shown in Figure 6A. The brown nodes are grouped to symbolize the neurodegenerative diseases themselves and the basic research methods that include “Alzheimer’s disease” “spatial transcriptomics”; the light blue nodes include the keywords of single-cell multiomics and its related researches including “single-cell RNA sequencing” “bioinformatics” etc.; red nodes include keywords related to brain cell such as “astrocyte” “glia” and so on; the dark green nodes contain keywords for pathological changes such as “amyloid beta” “inflammation” etc. The dark blue nodes contain keywords for cerebrospinal fluid components such as “multiple sclerosis” “myeloid cells” etc.; the light green nodes contain keywords for nerve cells such as “hippocampus” “myeloid cells” etc. The purple nodes include keywords related to diseased cells such as “disease-associated microglia” “B cells” and so forth. Orange nodes include keywords for data analysis methods such as “big data” “machine learning” and so forth. We also analysed keyword clustering for articles using single-cell sequencing methods. In the Supplementary Figure S10 it can be seen that the keywords of these articles are more centred on the level of the cells and their connections to each other. Supplementary Figure S6 presents a clear analysis of the average year of occurrence of each keyword with the change from blue to red indicating the temporal progression. One can see that keywords such as “ran-seq” and “macrophage” appear in 2021. Keywords such as “astrocyte” “single-cell RNA sequencing” “amyloid beta” “neuron” and “Alzheimer’s disease” appear mainly in 2022 which indicating their centrality to the research in the field. The remaining keywords such as “multiomics” “monocyte” “cerebrospinal fluid” “neuron” and “autoimmunity” appeared later which undoubtedly provide directional references for future research. This suggests that the frontier of the field may be focused on research in the direction of cerebrospinal fluid autoimmunity and so on. The average year of occurrence of each keyword in articles in the ND field where single-cell sequencing was performed can be seen in the Supplementary Figure S11. It can be seen that words such as “microglia” and “amyloid beta” appear earlier and words such as “t cells” and “memory b cells” appear later. We can see that in the visualization of the average number of citations per year for keywords (Supplementary Figure S7) several keywords with high cumulative citation counts such as “Alzheimer’s disease” “astrocyte” “neurodegenerative disease” have a high average number of citations per year representing the key part of this domain. However the terms “myeloid cells” and “deep learning” have a lower average number of citations per year indicating that research in these areas may not be as abundant. In the Supplementary Figure S12 you can see the average number of citations per year for the keywords of the articles that sequenced single cells. We found that the keywords with the higher average number of citations were “microglia,” “astrocyte” and “neuroinflammation.” It can be seen that microglia and astrocyte are popular targets for single-cell sequencing. Figure 6B also shows the timeline of the keywords. We can see that the earliest and largest cluster is #0 Alzheimer disease illustrating that the research in this field is basically centered around this central keyword. At the same time 2 out of these 10 clusters are still developing, i.e., the research direction represented by the keyword is frontier of research. The emerging keyword clusters include #3 “gene networks” and #8 “single cell RNA.” This in part reveals that gene network interactions may be an emerging hotspot for ND research while single-cell RNA sequencing is an effective tool to help probe. In the annual heat map of keyword (Figure 7A) we can see more specific keyword heat over time. Over time the keywords that received more attention changed from “differentiation” “dementia” “differential expression” and “systemyeloid cells biology” to “neuroinflammation” “dopamine neuron” “gwas” and “cellular heterogeneity” etc. In recent years terms like “blood-brain barrier” “myeloid cells” “disease-associated microglia” “feature selection” “cerebrospinal fluid” and “astrocyte” has emerged as popular concepts. It can be observed that the keyword heat represents the focal point of research and that people’s attention to neurodegenerative disease gradually shifts from superficial diseases to deep cellular and molecular mechanisms. This year’s hot keywords include “neurovascular unit” “aging” “trem2” and “glia.” Due to the incomplete statistics the results of this year’s keywords may have some deviation. Figure 7B illustrates the correlation between keywords with those that are more prevalent during a given period grouped into distinct clusters of 6 colors. This includes blue clusters (“SYSTEMYELOID CELLS” “MACROPHAGE” “DIFFERENTIAL EXPRE MACROPHAGE” “DIFFERENTIAL EXPRE” “NEUROGENESIS” etc.) the red clusters (“INFLAMMATION” “ATHEROSCLEROSIS INFLAMMATION” “ATHEROSCLEROSIS” “RNA-SEQ” and “BIOINFORMATICS” etc.) yellow clusters (“AGE-RELATED MACULA” “AGING” and “GLIA” etc.) green clusters (“AUTOIMMUNITY” “SPINAL CORD INJURY” “BIOMARKER” and “AMYLOID BETA” etc.) orange clusters (“MACHINE LEARNING” “MACHINE LEARNING” etc.) and the “MACHINE LEARNING” cluster (“MACHINE LEARNING” etc.). (“MACHINE LEARNING” “MASS CYTOMETRY” and “APOE” etc.) purple clusters (“BIG DATA” “MASS CYTOMETRY” and “AMYLOID BETA” etc.) purple clusters (“BIG DATA” “MOLECULAR MECHANIS” “TREM2” and “STRIATUM” etc.).
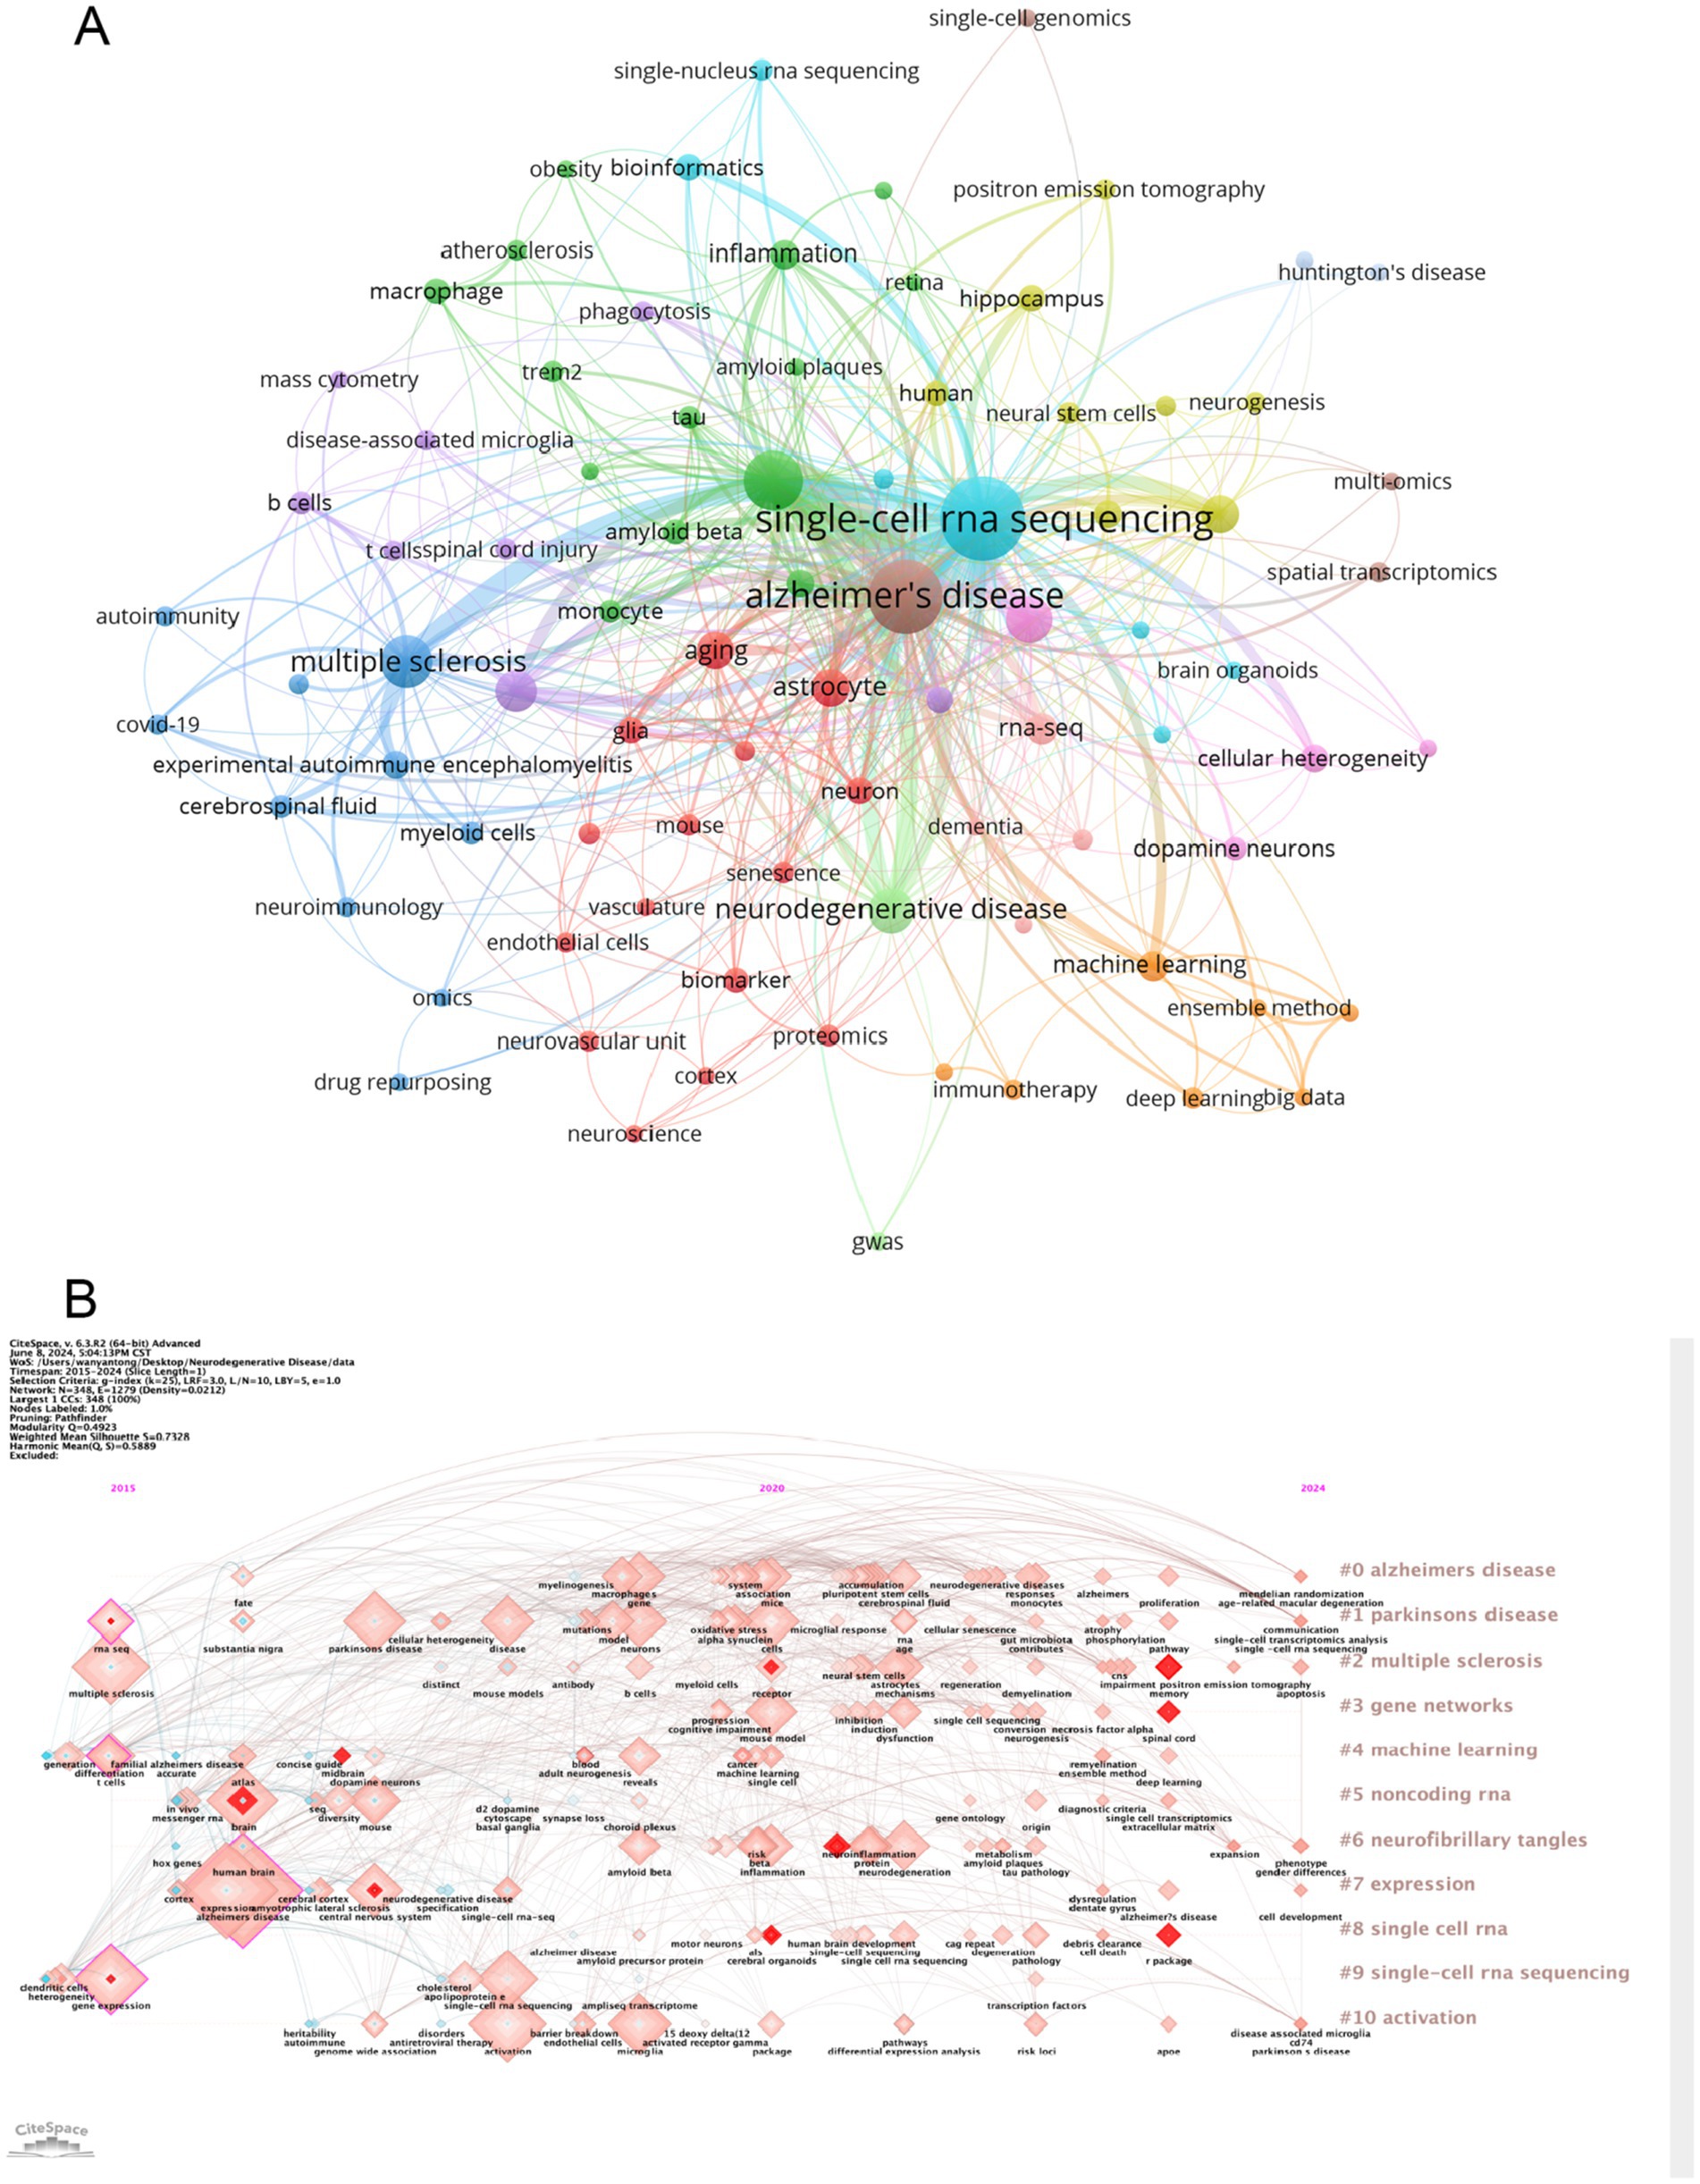
Figure 6. (A) Cluster analysis of keywords. Nodes of different colors represent keywords of different clusters. (B) A timeline view of the keywords. Each horizontal line represents a cluster; the smaller the number, the larger the cluster. The size of the nodes reflects the co-citation frequency, and the connecting lines between the nodes indicate the co-citation relationship of the keywords.
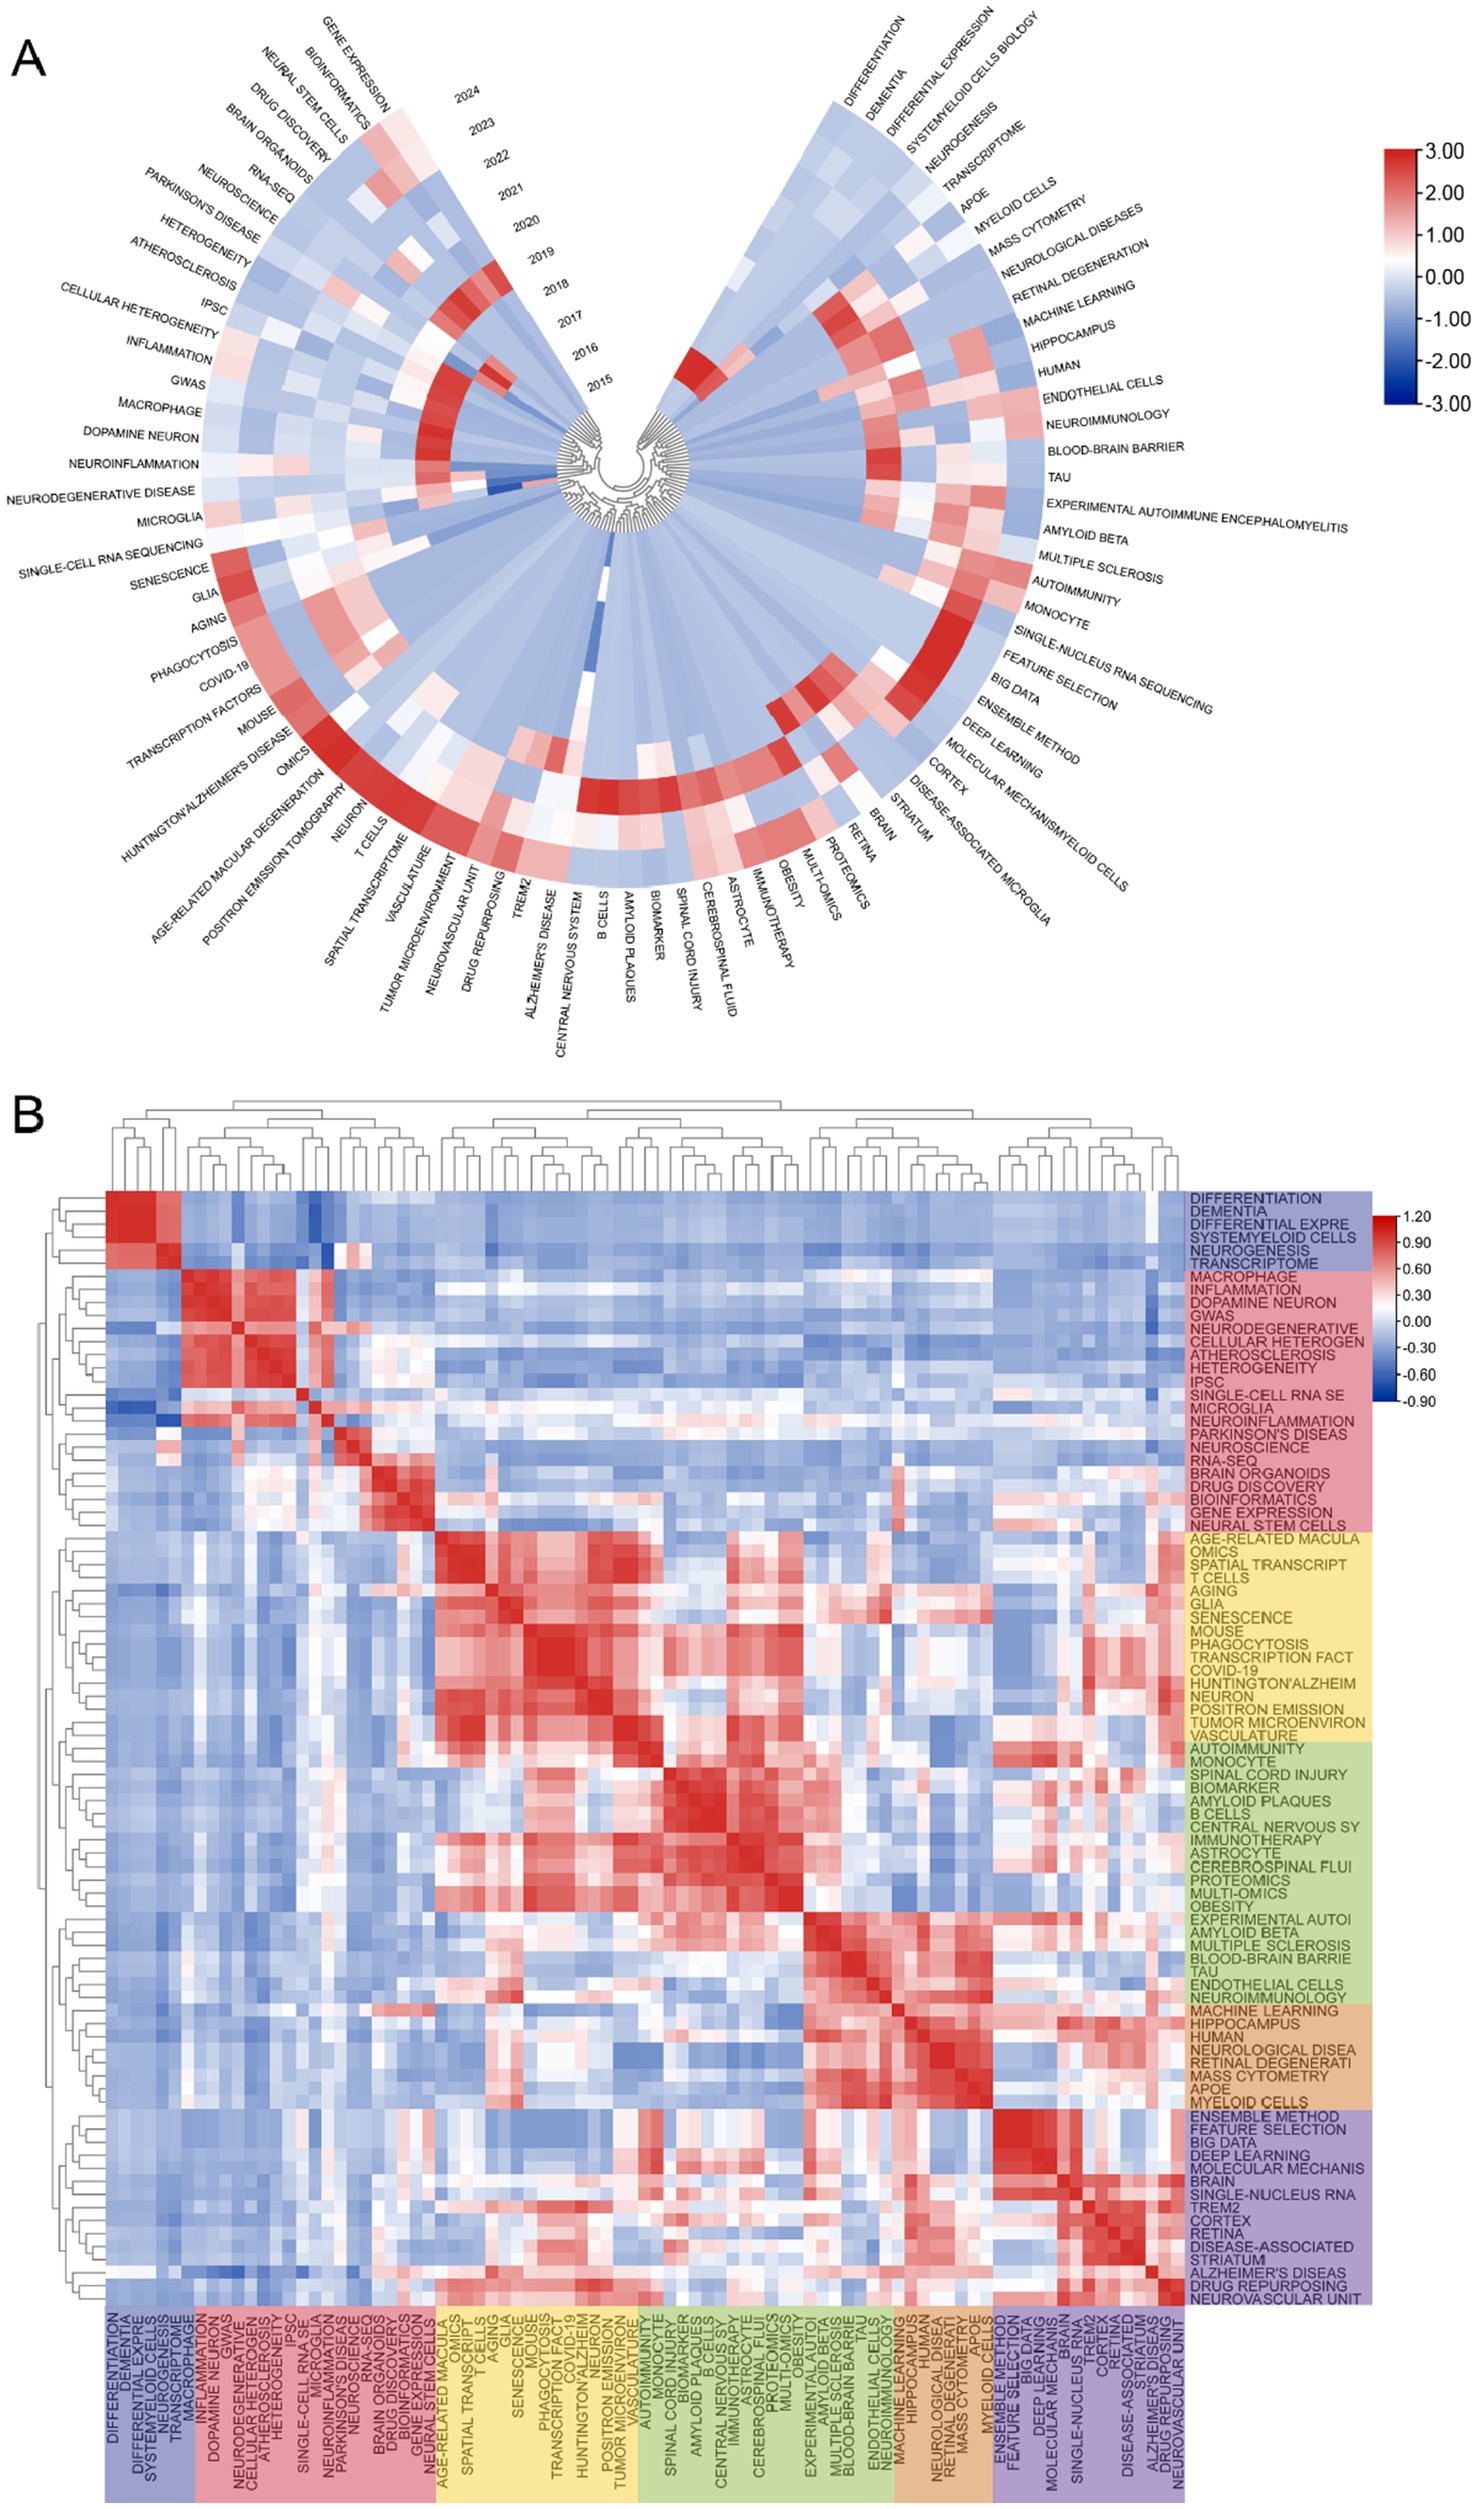
Figure 7. (A) The following graph depicts the annual keyword heatmap from 2015 to 2024. The annual heat value of each keyword is calculated by dividing the number of citations in a given year by the total number of citations that citations in the year. (B) Keyword relevance heatmap. Keyword with high popularity in a similar time period are grouped together, with different categories distinguished by different colors.
3.6.2 New insights from single-cell sequencingAs technology advances, the use of single-cell sequencing in ND has become more diverse. A new technology that has emerged in recent years is spatial transcriptomics, and spatially resolved transcriptomics has been named “Method of the Year” for 2020 by Nature Methods (32). Due to the limitations of single-cell sequencing, single-cell multiomics alone may result in the loss of three-dimensional information about cell populations (33). Therefore, single-cell sequencing combined with spatial transcriptomics will be a future trend (34). There are now some articles on single-cell sequencing combined with spatial transcriptomics studies of ND, but the number is not large (35). Here we propose this possible hotspot in the hope that it can provide some help to future researchers studying neurodegenerative diseases.
3.7 References bursts and references distributionTable 6 and Figure 8A present a visual representation of the 15 most frequently cited articles in the retrieved paper pool. The article “Single-cell transcriptomic analysis of Alzheimer’s disease” was the most frequently cited article (1,146) (19), which employed single-cell sequencing (SCS) to assess the frontal cortex of Alzheimer’s disease (AD) patients and quantify the correlation between gene expression in specific cell types and pathological trait variability. This approach revealed the heterogeneity of diseased neuronal cells in Alzheimer’s disease patients and facilitated a deeper understanding of the pathological features and pathogenesis of AD. The second most cited article is “Single-cell RNA sequencing of microglia throughout the mouse lifespan and in the injured brain reveals complex cell-state changes” (36). This article is intended to use scs to determine the different states of microglia, and in turn help to identify specific markers of microglia state that can be used to diagnose disease, providing a new advancement in the study of therapeutic targets for neurodegenerative disease “Developmental heterogeneity of microglia and brain myeloid cells revealed by deep single-cell RNA sequencing” is the third most-cited (37). In this article, researchers reveal the heterogeneity of microglia, and complement the current gene expression dataset of microglia from adult and diseased brains. “Genetic architecture of Parkinson’s disease” is the fourth most-cited (38). This study takes full advantage of single-cell multiomics to accurately measure cell specificity, summarizes the current status and progress of Parkinson’s disease research and predicts the future of Parkinson’s genetics. By analyzing the network of citation relationships of the articles, we made a visual graph of the clusters of the citation counts of the articles (Figure 8B). Cluster #0 “systems biology” is the largest cluster, indicating that the paper associated with it has been cited the most times. It can be seen that the most frequent keyword in the clustering of all articles is “systems biology,” followed by #1 “multiple sclerosis,” #2 “microglia” and #3 “astrocyte,” indicating that brain nerve cells are the major research focus and supporting basic theories in this field. The arrows in the figure indicate the evolution of the article clusters. The earliest research in the field is represented by the following clusters: #1 “multiple scleriosis,” #9 “neurod6,” #13 “retrograde tracing,” #15 “cerebellum,” and #16 “neuroinflammation.” These clusters are independent of each other. Subsequently, cluster #1 evolved into #0 “systems biology,” #2 “microglia,” #5 “Alzheimer disease,” #7 “trem2,” #8 “transcription factor” and #12 “pathology angiogenesis,” while the evolutionary domains of #0 highly overlap with #1. It is noteworthy that both #2 and #5 represent the direction of evolution in numerous areas, thereby underscoring the significance of this cluster. Figure 8C shows the time span analysis of the burst references, with statistics collected between 2015 and 2024. The article with the strongest outburst was “Cell types in the mouse cortex and hippocampus revealed by single-cell RNA-seq” by Zeisel et al. in 2015, revealing diversity of brain cell types and transcriptomes. The articles that are still bursting are “Integrated analysis of multimodal single-cell data” and “The single-cell transcriptional landscape of mammalian organogenesis.” Both articles employed single-cell polyomics to determine cellular subtypes, thereby revealing cellular heterogeneity. It is worth mentioning that the article “The single-cell transcriptional landscape of mammalian organogenesis” broke out at a later time, but still has strong total connectivity strength, suggesting that the research direction of single-cell multiomics to measure cellular subtypes involved in this article may be a current research hotspot.
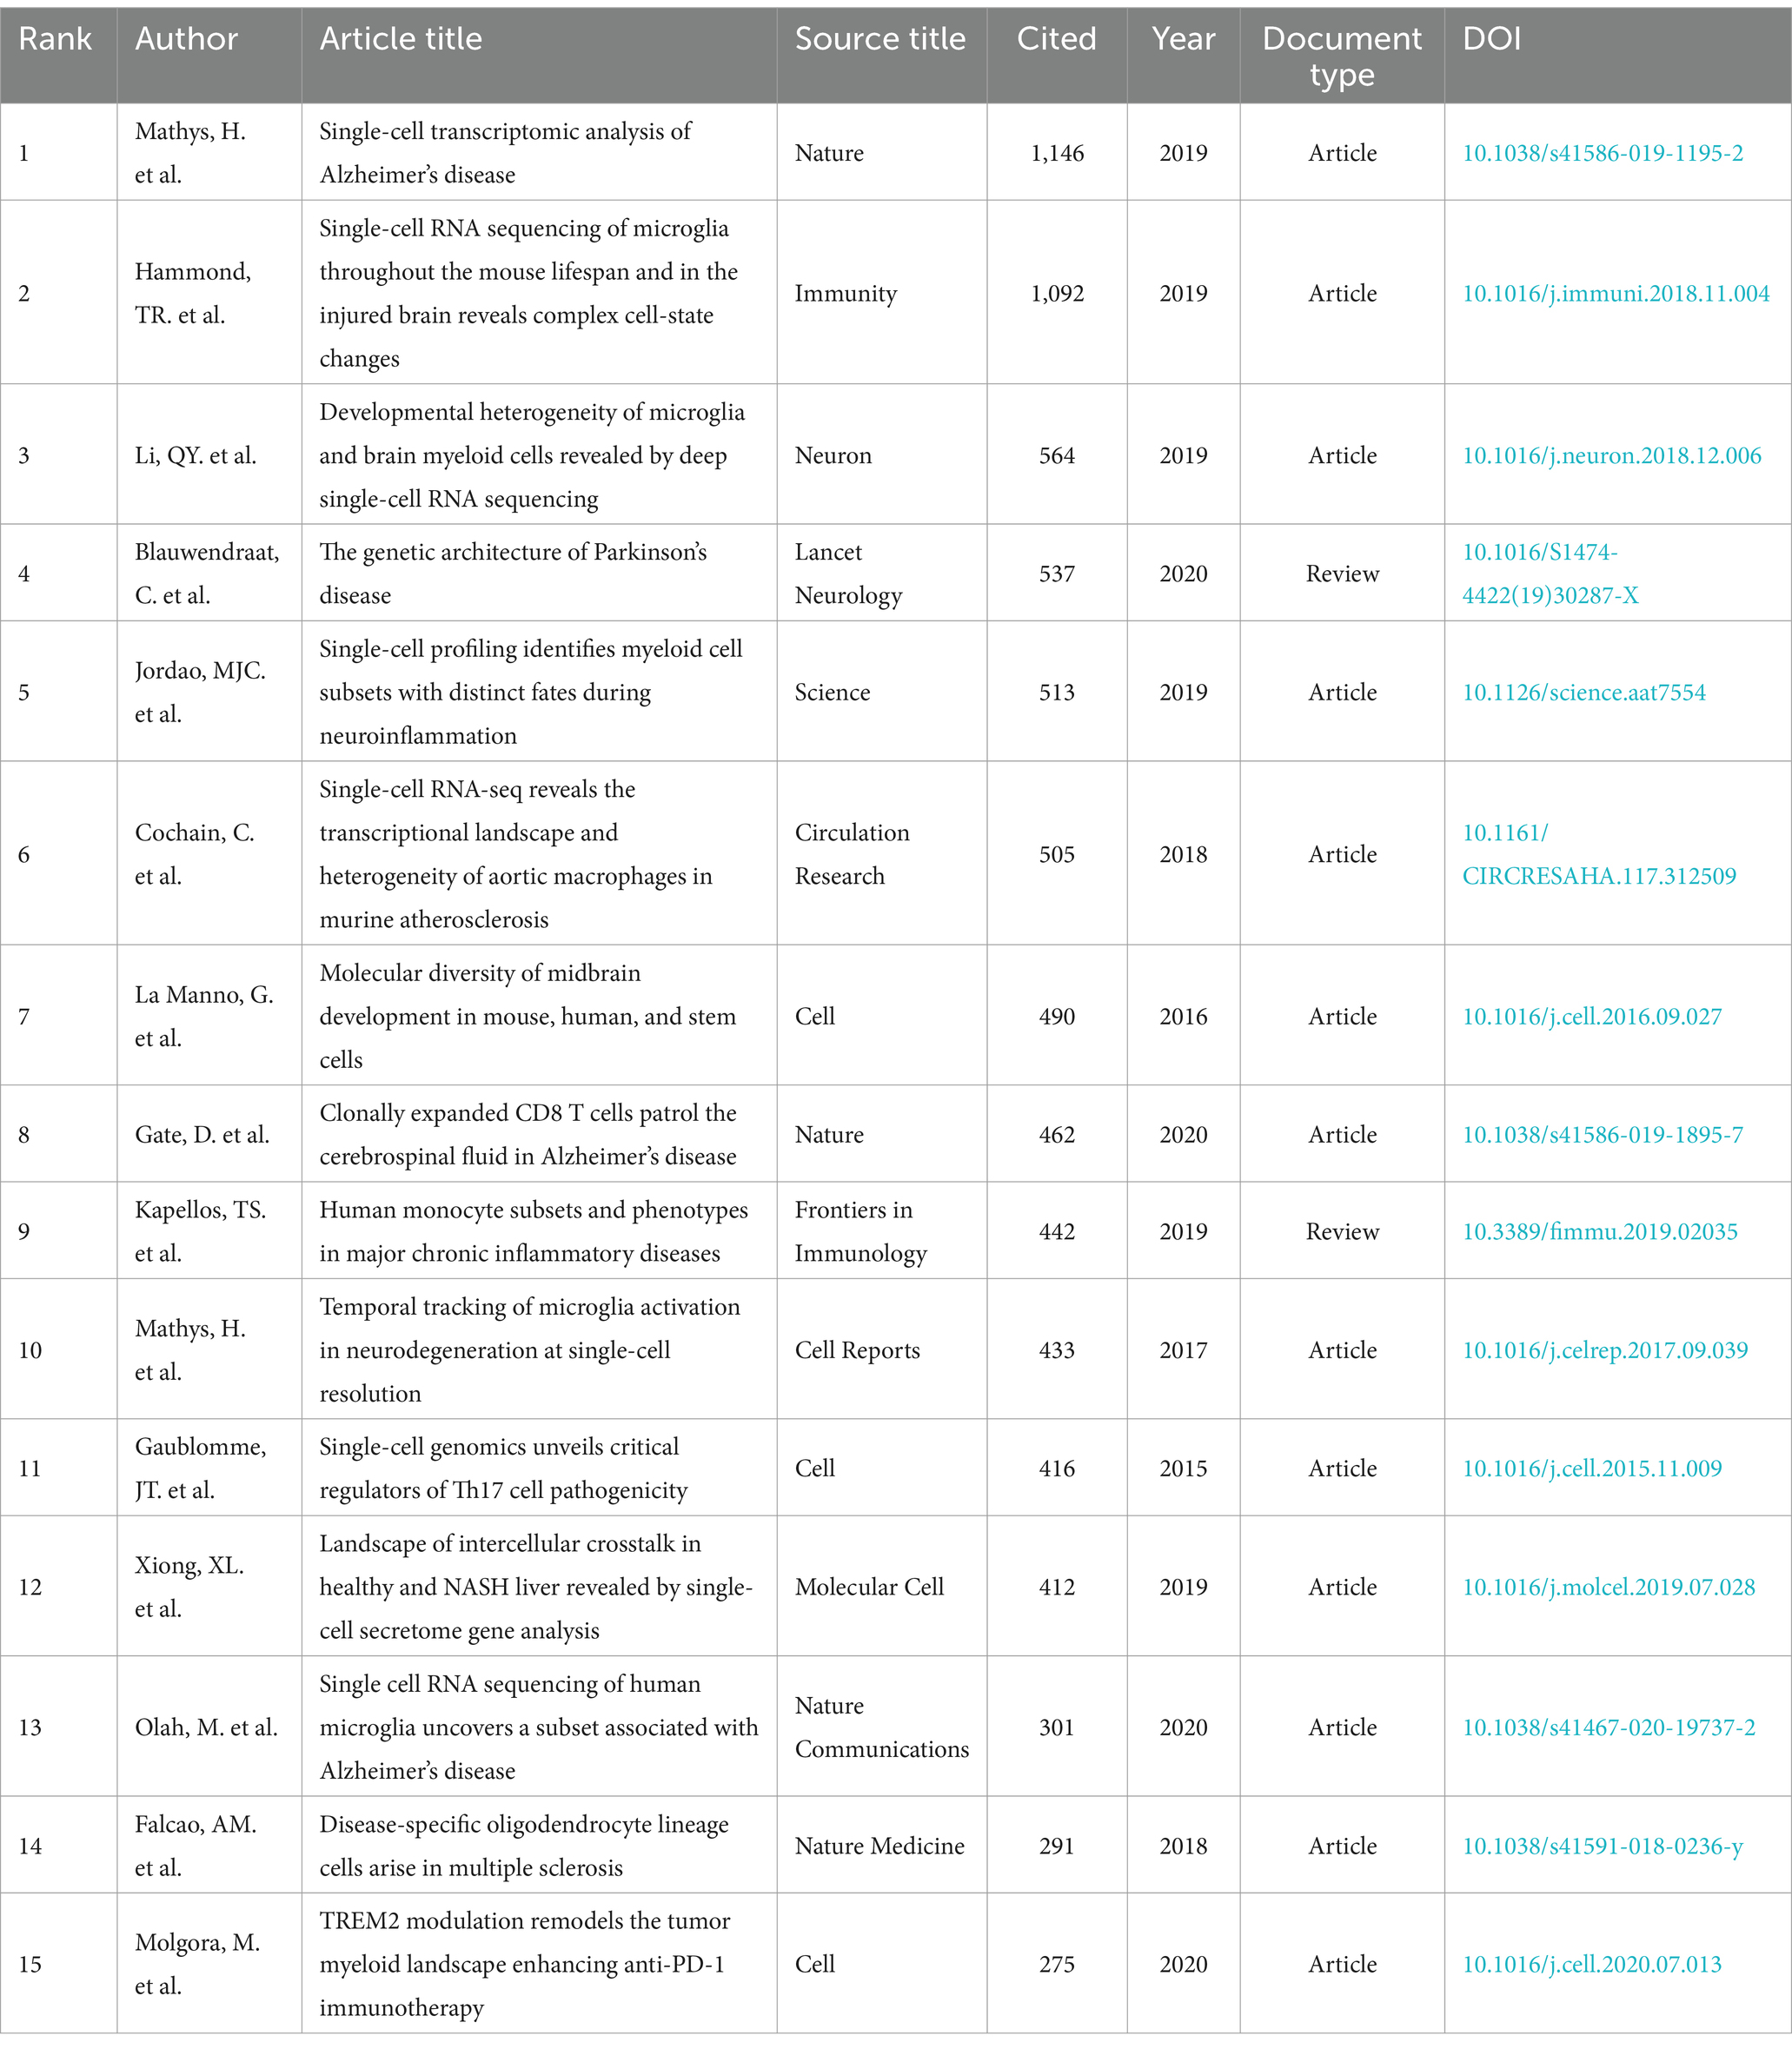
Table 6. Top 15 cited articles related to single-cell polyomics in the field of ND.
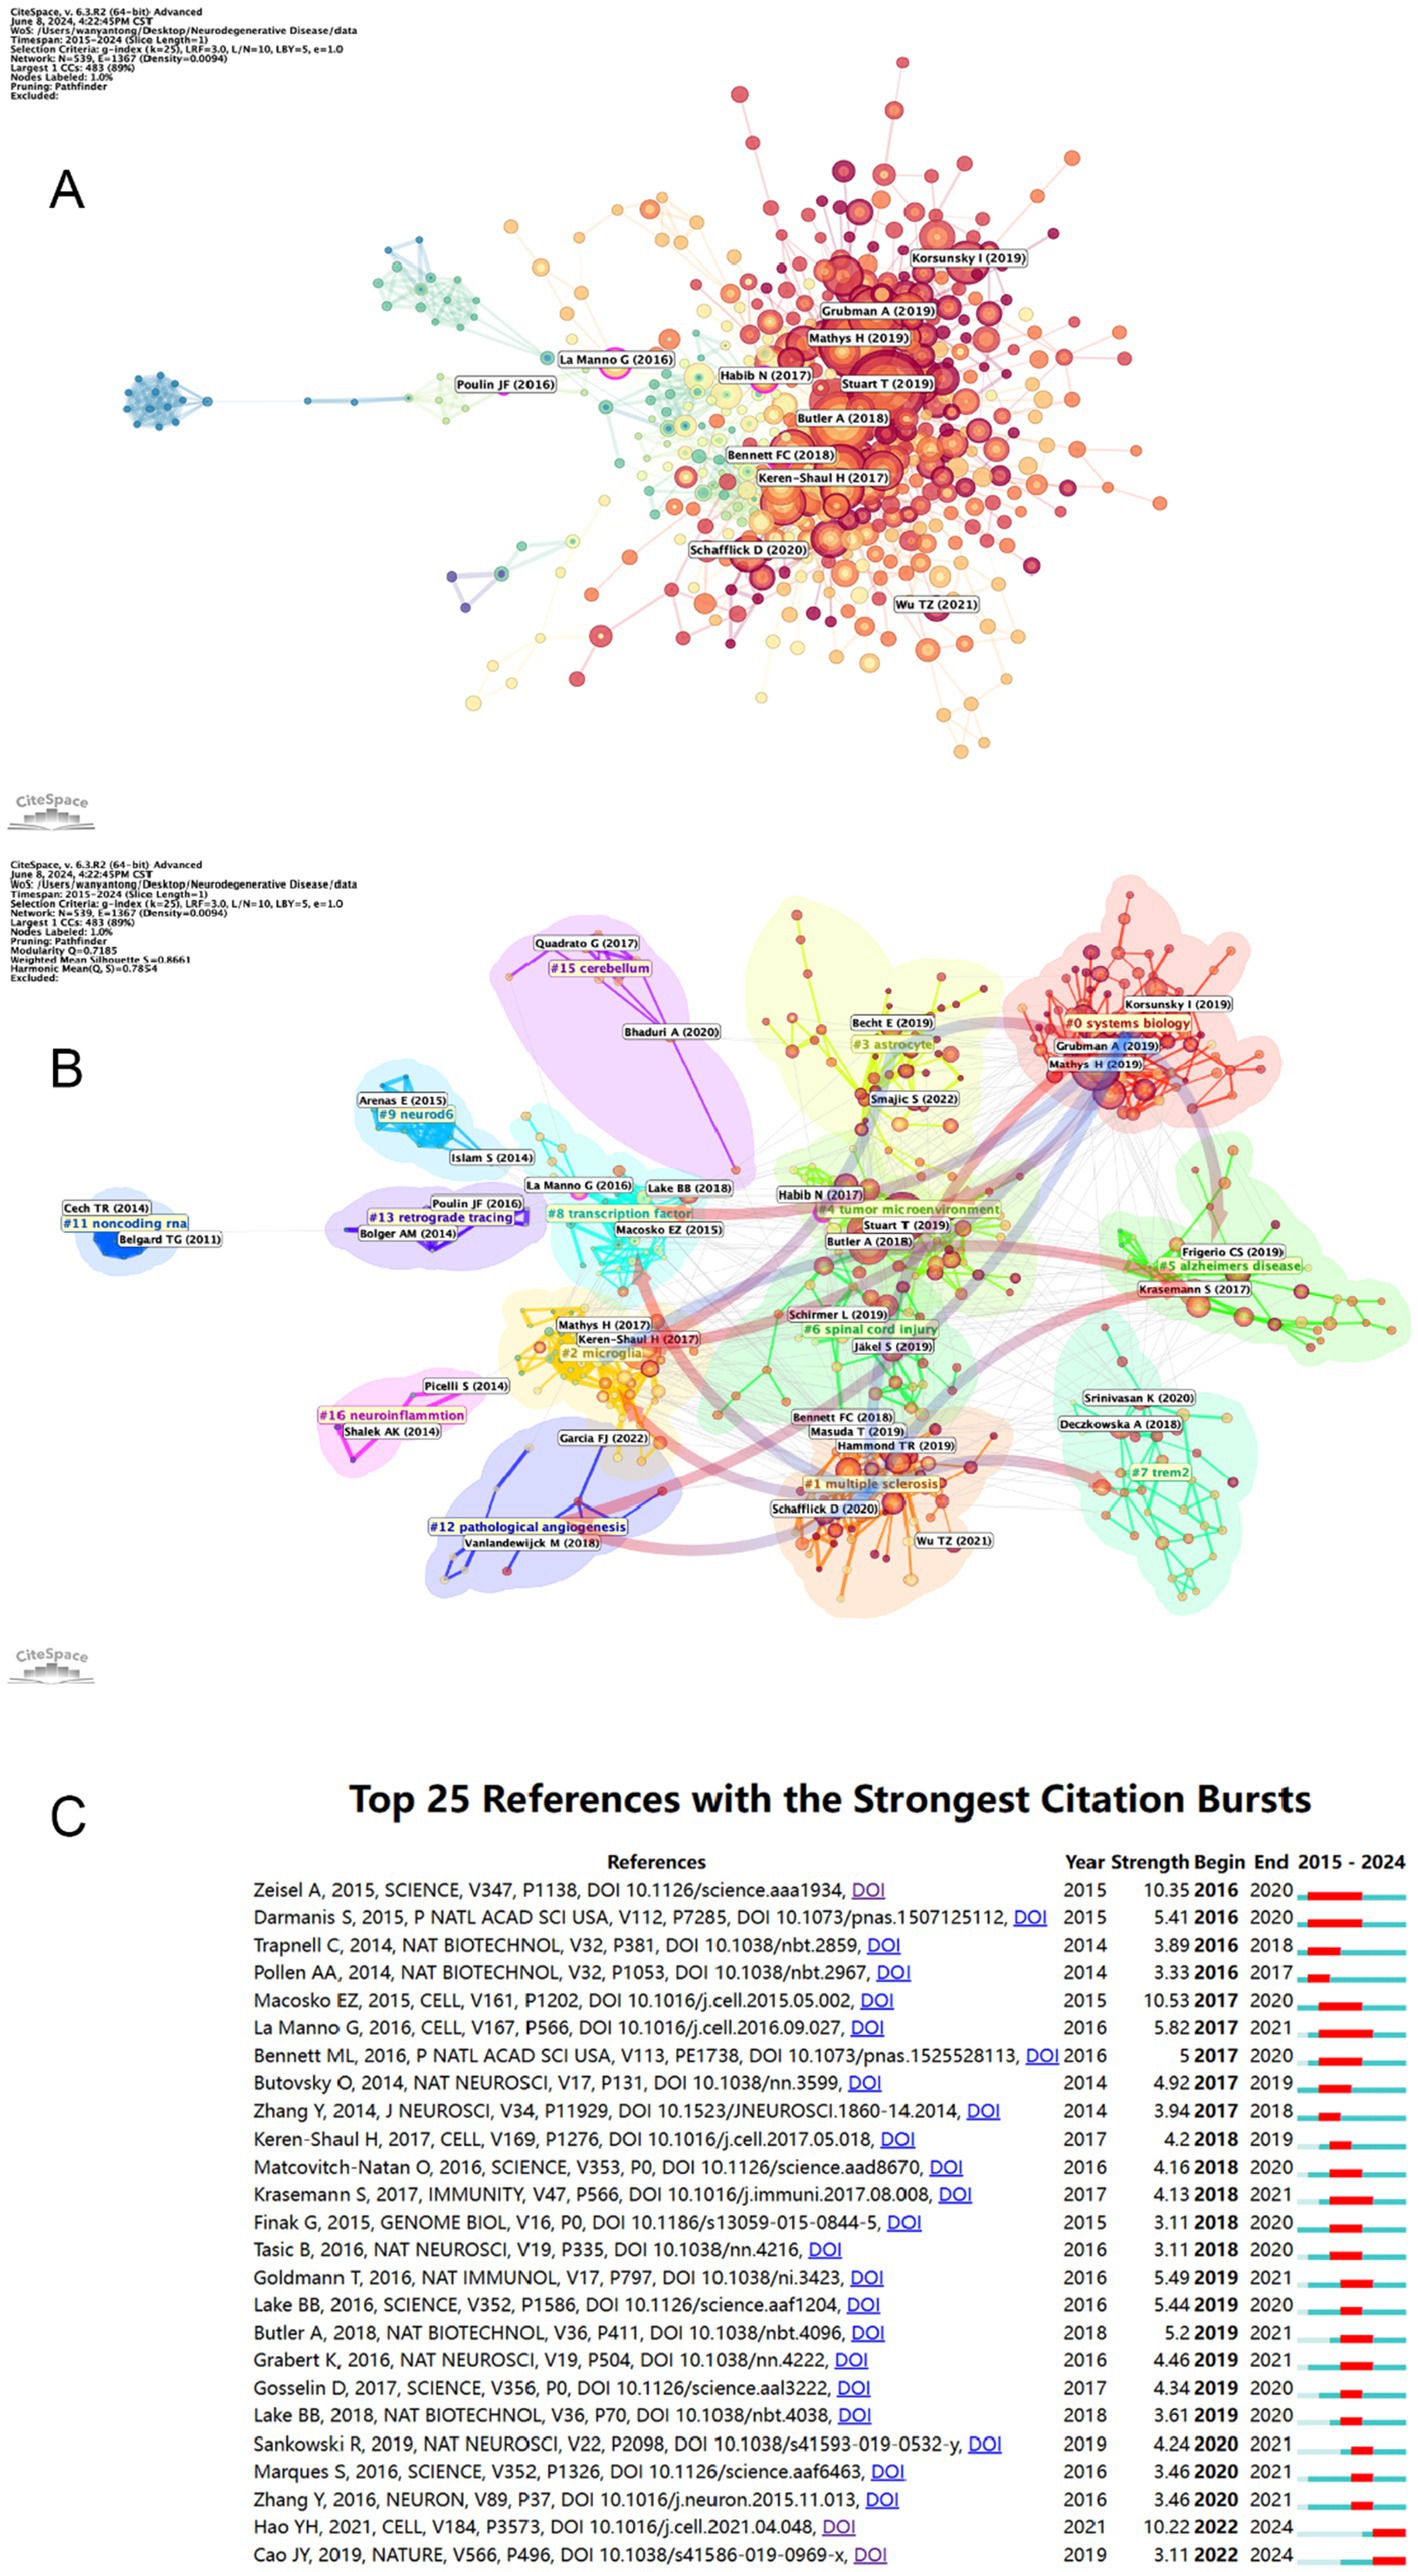
Figure 8. (A) Visual mapping of article citation counts. Nodes are represented by the first author for the corresponding article. (B) Visual mapping of article citation counts. Nodes in different colored regions represent different article clusters. (C) The top 25 citations with the strongest reference bursts and their total connection strength and publication time. The blue line marks the time interval, while the duration of the reference burst is shown by the red line.
4 DiscussionIn this bibliometric analysis, we examined 586 research articles pertaining to single-cell histology in neurodegenerative disease studies using CiteSpace 6.3R2 Advanced, VOSviewer 1.6.18, and Charticulator. The data were retrieved on June 8, 2024 from the Web of Science Core Collection database and were utilized evaluate the spatial and temporal distribution, contributions, core articles, research hotspots, and frontiers of this field. It is essential to count articles that use two or more multiomics approaches that provide us with different research perspectives on the same organisation.
4.1 General informationThe annual number and trends of papers may help to understand the development and progress of this study. As shown in Figure 1, from 2015 to 2018, the number of papers was within 10, with a slow growth, indicating that single-cell multi omics research on neurodegenerative diseases is still in its early stages. From 2019 to 2023, there has been a significant increase in articles related to this field, indicating that t
留言 (0)