
記住我


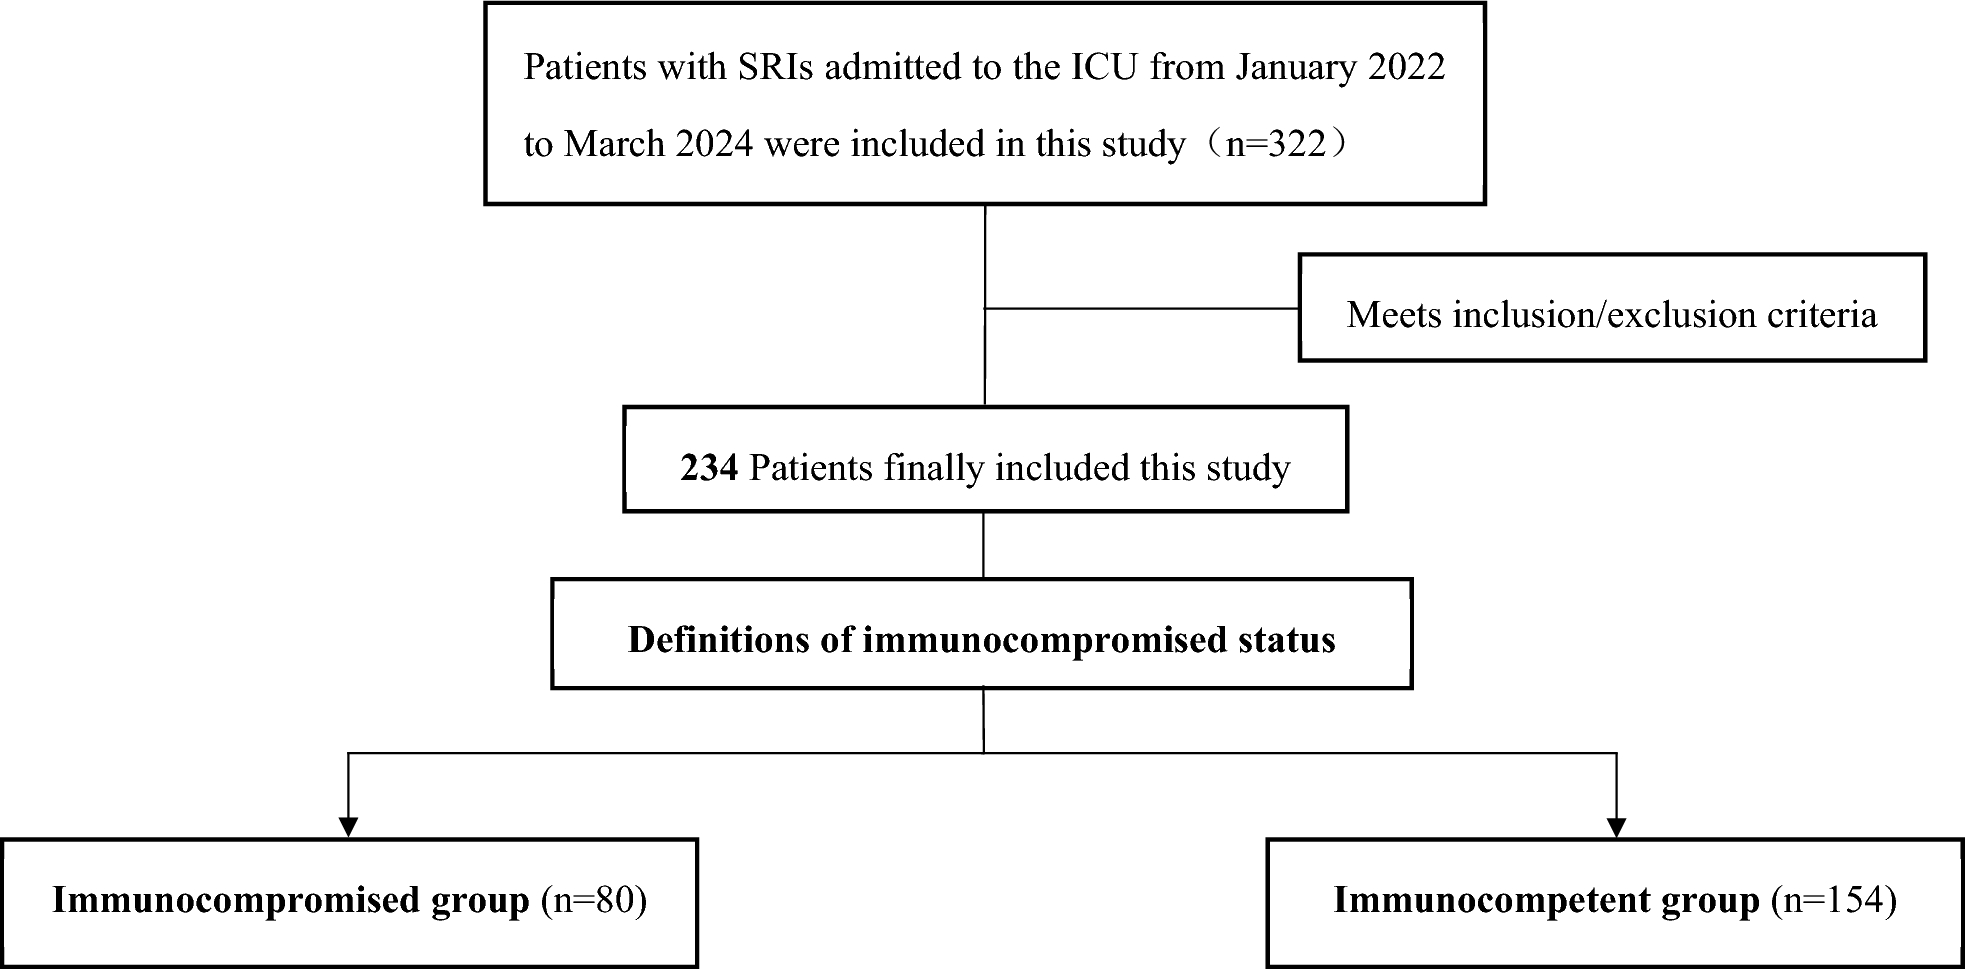
According to the inclusion/exclusion criteria, 234 patients with SRIs, including 117 males and 117 females, were included in this analysis. The patients were divided into an immunocompromised group (n = 80) and an immunocompetent group (n = 154) on the basis of their immunological status. Among the 80 immunocompromised patients, 43.75% (35/80) had hematological diseases, 28.75% (23/80) had undergone chemotherapy for solid tumors in the past 3 months, 13.75% (11/80) had a daily intake of more than 20 mg of glucocorticoids for more than 14 days (or a cumulative dose of 700 mg prednisolone or equivalent doses of other corticosteroids), and 13.75% (11/80) had an immunocompromised status due to hereditary or congenital factors (Fig. 2).
Fig. 2
The distribution of immunocompromised status in immunocompromised patients
There was no statistically significant difference in age or sex between the immunocompromised group and the immunocompetent group (P > 0.05) (Table 1). In the immunocompromised group, the levels of platelets, hemoglobin, and white blood cells were significantly lower than those in the immunocompetent group (P < 0.05), while the levels of D-dimer, procalcitonin (PCT), and C-reactive protein (CRP) were significantly higher than the immunocompetent group (P < 0.05). The proportion and duration of mechanical ventilation were not significantly different between the two groups (P > 0.05), and the duration of ICU stay in the immunocompromised group was significantly shorter than that in the immunocompetent group [8.00 (5.00–16.75) vs 12.00 (6.00–20.00), P < 0.05]. Although there was no statistically significant difference in ICU mortality or 28-day mortality between the two groups, the APACHE II score in the immunocompromised group was significantly higher than that in the immunocompetent group [31 (27.25–35.00) vs 26 (23.00–28.00), P < 0.05].
Table 1 Basic clinical data and medical history of the patientsComparison of the diagnostic performance of mngs to cmts in all patientsAmong the 234 patients included in this study, the Kappa analysis results indicated poor consistency between mNGS and CMTs (P = 0.414) (Table 2). Among these methods, both methods yielded positive results in 63.68% (149/234) of the cases, and both methods yielded negative results in 2.56% (6/234) of the cases. Additionally, 30.34% (71/234) of patients tested positive with only mNGS, whereas 3.42% (8/234) tested positive with only CMTs. Among the 149 patients who tested positive with both methods, only 9 patients (6.04%) were completely matched, 43 patients (28.86%) were mismatched, and 97 patients (65.10%) were partially matched (Fig. 3A). A total of 174 pathogens were detected, with mNGS identifying 167 species (95.98%) and CMTs detecting 51 species (29.31%). Among CMTs, the method with the highest pathogen detection rate was BALF culture (n = 23, 13.22%), followed by sputum culture (n = 22, 12.64%), blood culture (n = 20, 11.49%) and PCR (n = 12, 6.90%) (Fig. 3B).
Table 2 Kappa analysis of concordance between mNGS and CMTs resultsFig. 3
A Pathogen identification consistency between mNGS and CMTs. B Pathogen species detection by mNGS or CMTs
Comparison of the diagnostic performance of mngs to cmts in both groupsIn the immunocompromised group, the positivity rates of mNGS were significantly higher than those of CMTs (95% vs 58.75%, P < 0.05). In the immunocompetent group, mNGS also had a higher positivity rate than CMTs did (93.51% vs 71.43%, P < 0.05). Notably, the positivity rate of CMTs was significantly lower in the immunocompromised group than in the immunocompetent group (58.75% vs 71.43%, P < 0.05) (Fig. 4).
Fig. 4
Comparison of the positivity rates between mNGS and CMTs
In the immunocompromised group, both methods yielded positive results in 56.25% (45/80) of the patients and negative results in 2.50% (2/80) of the patients (Fig. 5A). Furthermore, 38.75% (31/80) of patients tested positive with only mNGS, whereas 2.50% (2/80) tested positive with only CMTs. Among the 45 patients who tested positive with both methods in the immunocompromised group, only 4 patients (10.26%) were completely matched, 15 patients (38.46%) were mismatched, and 26 patients (57.78%) were partially matched.
Fig. 5
Pathogen identification consistency between mNGS and CMTs. A Immunocompromised group. B Immunocompetent group
In the immunocompetent group, both methods yielded positive results in 67.53% (104/154) of the patients and negative results in 2.60% (4/154) of the patients (Fig. 5B). A total of 25.97% (40/154) of patients tested positive with only mNGS, and 3.90% (6/154) tested positive with only CMTs. Among the 104 patients who tested positive with both methods in the immunocompetent group, only 5 patients (4.81%) were completely matched, 27 patients (26.92%) were mismatched, and 71 patients (68.27%) were partially matched.
Differences between cmts and mngs in detecting pathogenic microorganismsmNGS had a significantly greater detection rate for pathogenic microorganisms than did CMTs (94.02% vs 66.67%, P < 0.05). The detection rates for bacteria (86.32% vs 57.26%, P < 0.05) and fungi (44.87% vs 23.93%, P < 0.05) were notably greater than those for CMTs. Additionally, mNGS demonstrated excellent diagnostic performance in detecting viruses (44.02% vs 11.54%, P < 0.05) compared with CMTs (Fig. 6).
Fig. 6
Comparing the detection rates of pathogenic microorganisms using different methods
Among the microbes identified by both methods in all patients (Fig. 7), the most frequently identified bacteria were Klebsiella pneumoniae (n = 93), Acinetobacter baumannii (n = 89), Stenotrophomonas maltophilia (n = 69), Corynebacterium striatum (n = 56), Enterococcus faecium (n = 49), Staphylococcus aureus (n = 42), Pseudomonas aeruginosa (n = 38), and Serratia marcescens (n = 27). Among the fungal organisms detected, Candida albicans (n = 93) was the most common, followed by Aspergillus fumigatus (n = 30) and Candida glabrata (n = 22). Among the viruses detected, the most common were Herpes simplex virus-1 (n = 30), Human herpesvirus 7 (n = 14), and Human herpesvirus 6B (n = 4).
Fig. 7
The distribution of detected pathogen species by mNGS or CMTs in all patients
A total of 174 pathogens were detected via mNGS and CMTs, and 123 and 7 pathogens were detected only by mNGS or CMTs, respectively. The 123 pathogens identified by mNGS included 95 bacteria, 19 fungi, and 9 viruses. Among these 123 pathogens, the most common are Herpes simplex virus-1, Human herpesvirus, and Elizabethkingia anophelis. The 7 pathogens identified by CMTs included 6 bacteria and 1 fungus: Enterobacter bugandensis, Raoultella planticola, Staphylococcus capitis, Staphylococcus cohnii, Staphylococcus epidermidis, Streptococcus pyogenes, and Mucor.
Clinical impact of mngs or cmts resultsThe rates of antibiotic regimen adjustments in the immunocompromised group and immunocompetent group were 87.5% and 64.29%. Antibiotic regimen adjustments guided by mNGS were significantly more common in the immunocompromised group (70.00% vs 17.50%, P < 0.05) and the immunocompetent group (48.70% vs 15.58%, P < 0.05) than in the group guided by CMTs. Antibiotic escalation guided by mNGS was more common in both the immunocompromised group (28.75% vs 2.50%, P < 0.05) and the immunocompetent group (25.32% vs 7.79%, P < 0.05) than in the CMTs group.
In the immunocompromised group, adjunctive antifungal and antiviral treatments guided by mNGS were used in 15.00% and 8.75% of the patients, no patients received additional antifungal or antiviral treatment guided by CMTs. In the immunocompetent group, adjunctive antifungal and antiviral treatments guided by mNGS were used in 11.04% and 4.55% of the patients, respectively, 3.25% of the patients received adjunctive antifungal treatment guided by CMTs, no patients received antiviral treatment guided by CMTs.
In the immunocompromised group, both ICU mortality and 28-day mortality were significantly lower with mNGS guidance than with CMTs guidance (8.93% vs 50.00%, P < 0.05; 30.36% vs 68.75%, P < 0.05). However, in the immunocompetent group, no statistically significant differences were observed when comparing ICU mortality and 28-day mortality between mNGS and CMTs guidance (20.00% vs 33.33%, P > 0.05; 42.67% vs 45.83%, P > 0.05) (Table 3).
Table 3 The impact of antibiotic regimen adjustments and patient prognosis based on mNGS and CMT resultsFurther analysis showed that mNGS results had a positive effect on 68 patients (85.0%) and no effects on 10 patients (12.5%), while 2 patients (2.5%) experienced negative clinical effects. Among the 68 patients with positive effects, mNGS results provided definitive diagnoses. For the two patients with negative effects, the mNGS results led to incorrect diagnoses, ultimately resulting in inappropriate antibiotic treatment. In the group of 10 patients with no clinical effect, 4 patients failed to detect any pathogens. Additionally, the results for 6 patients were identified as either non-pathogenic organisms or normal respiratory flora/colonizers. (Table 4).
Table 4 The Clinical effect of mNGS result in immunocompromised group
留言 (0)