
記住我
Pleomorphic adenomas (PA) and Warthin’s tumors (WT) are the most common benign tumors, accounting for more than 70% of the neoplasms in the parotid gland (1, 2). Although PA and WT are benign tumors, they differ in biological behavior and prognosis (2, 3). Unlike WT, PA presents a 1.8% to 6.2% risk of malignant transformation (4, 5). For WT, due to the intact fibrous capsule, enucleation of the tumor alone is sufficient, while for PA, extensive field removal of the tissue in the parotid bed is recommended due to the risk of recurrence or disruption to the capsule (6, 7). Therefore, an accurate preoperative diagnosis of PA and WT is critically necessary for determining the optimal treatment strategy.
Various imaging modalities play essential roles in the diagnosis and management of parotid gland tumors (3, 7). Among these methods, conventional magnetic resonance imaging (MRI) provides information regarding tumor size, position, and relationship to adjacent structures. However, due to variability in the histological component of PA, conventional MRI is insufficient to distinguish PA from WT (8). Quantitative MRI techniques such as diffusion-weighted imaging and dynamic contrast-enhanced MRI (DCE-MRI) can complement physiological and functional information to distinguish subtypes of parotid neoplasms (9, 10). However, the apparent diffusion coefficient (ADC) value of WT overlaps with that of malignant tumors, and ADC alone cannot accurately distinguish benign and malignant parotid tumors (4, 11). In addition, in the case of DCE-MRI, there is a disadvantage due to the risk of serious adverse events and overlapping time-intensity curve pattern between PA and WT (12). Recently, in order to overcome the limited discriminative performance of conventional MRI and other imaging techniques, radiomics has been applied in differentiating various types of parotid tumors (13). Radiomics-based techniques, however, have a number of drawbacks, including limited generalizability of quantitative features due to low sample sizes, single-center studies, and different imaging equipment and radiomics models. Accordingly, novel approaches are required to improve the ability of differential diagnosis of PA from WT.
Synthetic MR imaging, also called magnetic resonance image compilation (MAGiC), can quantitatively measure multiple physical properties based on longitudinal relaxation time (T1), transverse relaxation time (T2) and proton density (PD) parameters (14). Unlike conventional and functional MRI techniques, which are influenced by scan parameters and biophysical model for data postprocessing, the quantitative SyMRI technique is inherently independent of MRI methods and parameters (15). In previous studies, the SyMRI has been applied in the differential diagnosis of breast tumors, prostate lesions and retropharyngeal lymph node (16–18). To our knowledge, there have been no studies exploring SyMRI’s clinical utility for distinguishing PA from WT. Meanwhile, various regions of interest (ROI) delineations have been used in previous studies, but a standardized approach for ROI placement methods is still lacking (19–21). Whole-volume ROI analysis rather than single-slice ROI delineation may accurately reflect tumor heterogeneity (22). In clinical practice, however, it is time-consuming and difficult to perform such analysis. Furthermore, no studies have evaluated the diagnostic performance of SyMRI in distinguishing between PA and WT using different ROI delineations. Hence, this study aimed to assess the clinical feasibility and diagnostic potential of SyMRI for differentiating PA from WT using two different ROI delineation methods.
Materials and methodsParticipantsAll the subjects who participated in the study completed the informed consent form and completed it uniformly. The project was approved by the Ethics Committee of Changshu No.2 People’s Hospital, the Fifth Affiliated Clinical Medical College of Yangzhou University. From January 2021 to December 2023, the SyMRI examination was performed on 71 consecutive individuals with suspected parotid gland tumors using a 3.0T MRI scanner. Exclusion criteria were as follows (4): (1) imaging artifacts interfering with interpretation, (2) prior history of head or neck disease, (3) small parotid gland tumors less than 10 mm in size, (4) the parotid tumor received biopsy, surgery, chemotherapy or radiotherapy and (5) postoperative histopathologically confirmed non-PA or non-WT. Subsequently, three patients with tiny parotid gland tumors under 10 mm in diameter, four patients with severe dental metal artefacts, and 15 patients with histopathologically proven non-PA or non-WT (one carcinoma ex pleomorphic adenoma, two lymphomas, three mucoepidermoid carcinomas, one adenoid cystic carcinomas, one acinar cell carcinomas, one squamous cell carcinomas, two granulomatous lymphadenitis, two myoepithelioma, one basal cell adenoma, and one benign lymphoepithelial lesion) were excluded from this study. Finally, there were 49 patients enrolled in this study, including 23 patients with PAs and 26 patients with WTs. All patients underwent surgical resection, and complete tumor specimens were histopathologically examined within 1 month after their MR examinations.
MRI data acquisitionAll examinations were performed using a GE Signa Architect 3.0T MRI scanner with a 28-channel head-neck coil. Before contrast was administered, SyMRI sequence in the axial direction was performed. The parameters of the SyMRI were as follows: repetition time (TR) of 4000 ms; echo time (TE) of 19.2/96.3 ms; field of view (FOV) of 24 × 24 cm; number of excitations (NEX): 1; Echo Train Length (ETL): 16; Bandwidth:31.25 kHz; matrix: 320 × 256; number of slices:20; slice thickness: 3 mm; slice gap: 1 mm; acquisition time: 4 min.
Image analysisThe SyMRI quantitative parameters were post-processed by two radiologists blinded to pathology (rater 1 and rater 2 with more than five and ten years of experience in head and neck imaging, respectively). The ROIs were manually delineated from synthetic T2-weighted images by referencing contrast-enhanced T1WI images. Two ROI delineation methods were used: (1) solid portion within the largest section of the lesion, avoiding necrotic, cystic, hemorrhagic, or apparent vessel components (partial lesion); (2) the largest area of the largest section (full lesion) (4, 18). The mean and standard deviation (sd) for longitudinal relaxation time (T1, T1sd), transverse relaxation time (T2, T2sd), and proton density (PD, PDsd) were calculated for WT and PA. Meanwhile, we delineated a ROI on the unilateral masseter muscle at the same level of the lesion and obtained T1, T2, and PD values (23). T1ratio, T2ratio, and PDratio were calculated as follows: T1ratio = T1 value of lesion/T1 value of masseter muscle; T2ratio = T2 value of lesion/T2 value of masseter muscle; PDratio = PD value of lesion/PD value of masseter muscle (23). Tumor volumes were calculated using the following Eq: V=π×L×W2/6, where L is length and W is width of the largest section (24).
Statistical analysisTwo-way mixed, absolute agreement, single measure intraclass correlation coefficients (ICC) were calculated to assess the reliability of SyMRI quantitative parameters between two raters (25). Normal distribution and homogeneity of variance were assessed using the Kolmogorov–Smirnov test and Levene’s test, respectively.PA and WT quantitative parameters were compared through independent sample t-tests and categorical variables through chi-squared tests. We plotted receiver operating characteristic curves (ROCs), calculated area under the curve (AUC), optimal threshold values, accuracy, sensitivity, specificity, positive predictive value (PPV), and negative predictive value. Multiparameter diagnostic models were constructed using binary logistic regression analysis (forward stepwise selection model) that included significant parameters with P < 0.05. To compare the differences between the ROC curves, DeLong’s test was performed. All statistical analyses were performed with R 4.1.3 and MedCalc software (version 15.2.2) using P-values below 0.05.
ResultsAs shown in Table 1, 49 patients were enrolled in this study, including 23 patients with PA and 26 with WT. No statistical difference was found in tumor volume between the two entities (P > 0.05). However, there were statistically significant differences in age and gender ratio between PA and WT (P < 0.05). In this study, WT showed a predilection for older males.
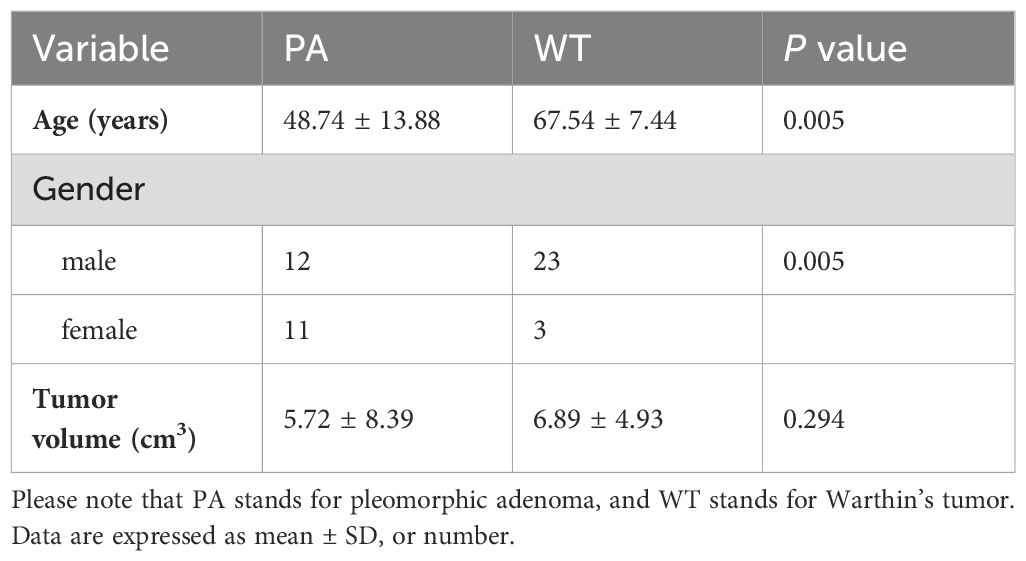
Table 1. Characteristics of patients with PA and WT.
Assessment of SyMRI inter-rater reliabilityThe ICCs for the quantitative parameters of SyMRI are all above 0.85, indicating excellent inter-rater agreement (Table 2).
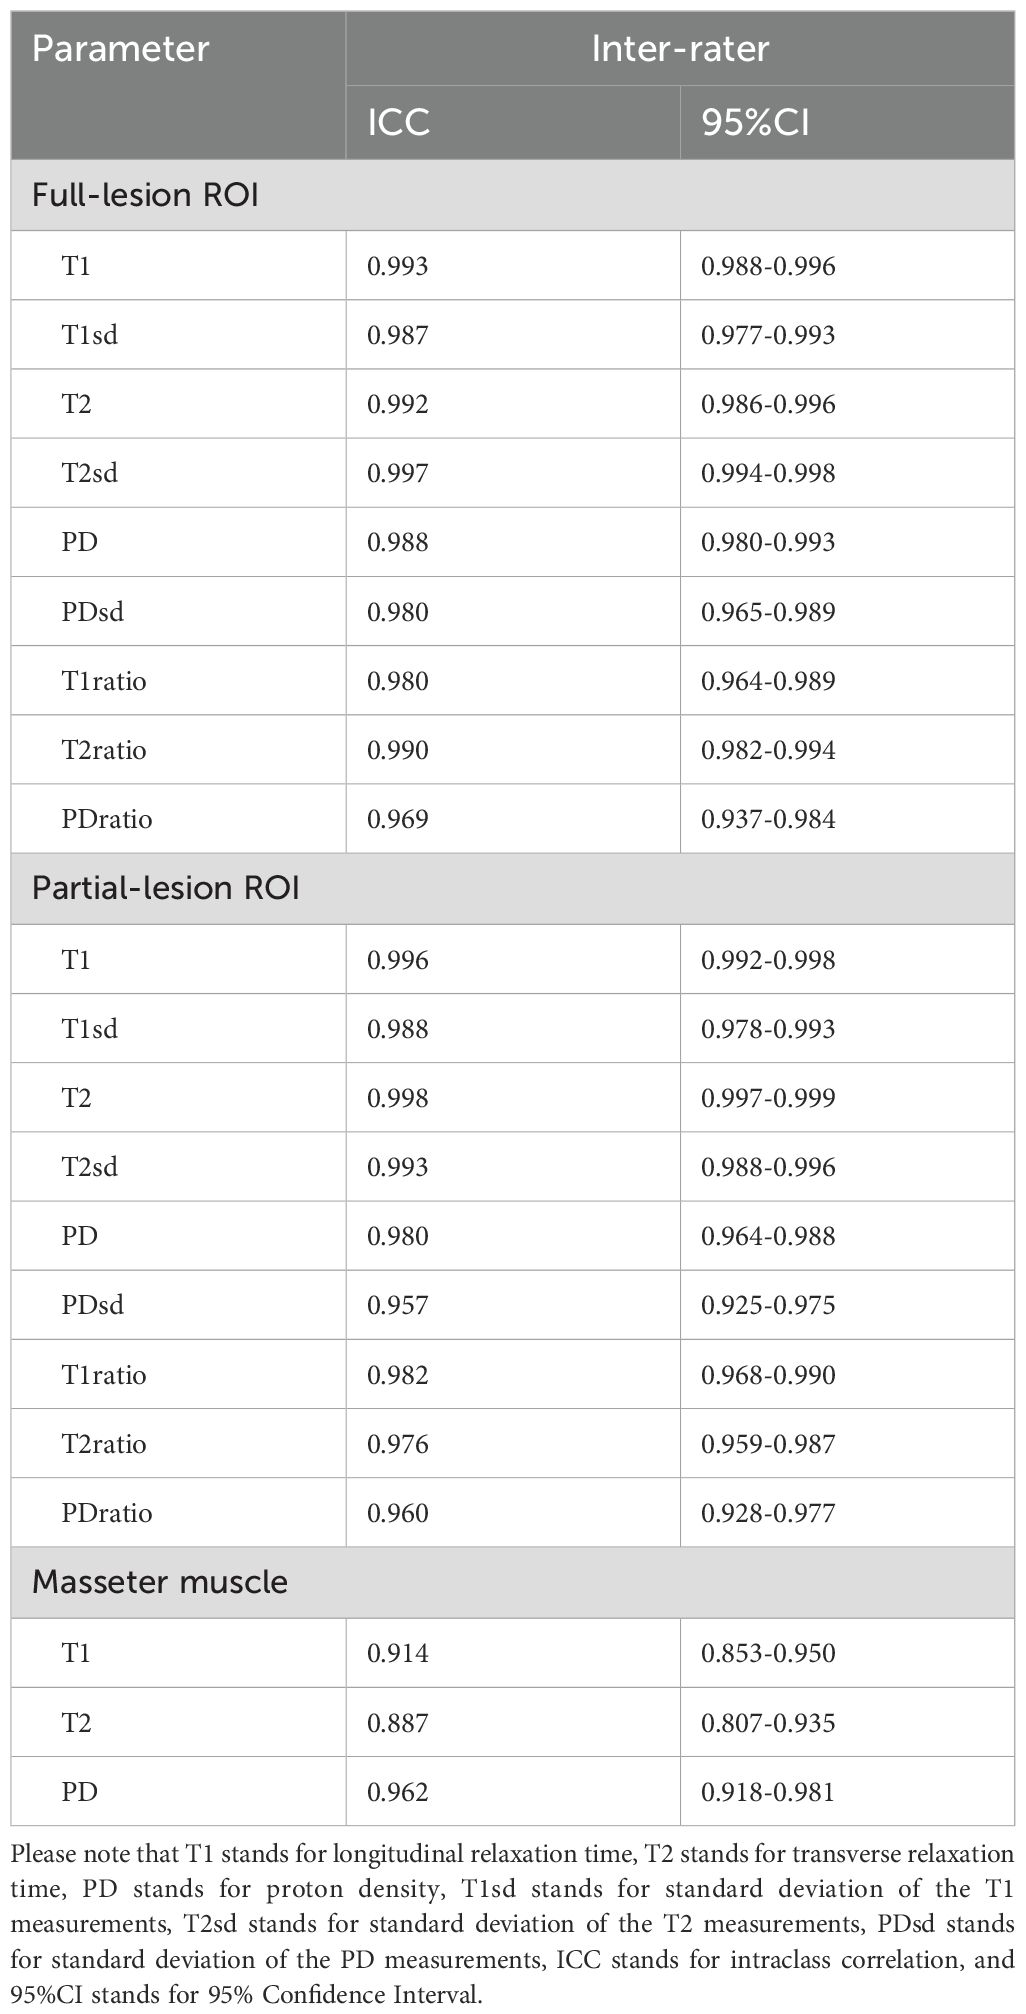
Table 2. Assessment of SyMRI inter-rater reliability.
SyMRI quantitative parameters for PA and WTTable 3 summarizes SyMRI’s quantitative parameters for PA and WT. The T1, T1sd, T2, PD, T1ratio, T2ratio, and PDratio of PA derived from full-lesion ROI were significantly higher than those of WT (P < 0.05). The T1, T1sd, T2, T2sd, PD, PDsd, T1ratio, T2ratio, and PDratio of PA derived from partial-lesion ROI were significantly higher than those of WT (P < 0.05) (Figures 1, 2). In terms of T2sd and PDsd derived from full-lesion ROIs, there were no significant differences between PA and WT (P > 0.05). The T1, T2, and PD values measured on the masseter muscle did not differ significantly between the two types of lesions (P > 0.05).
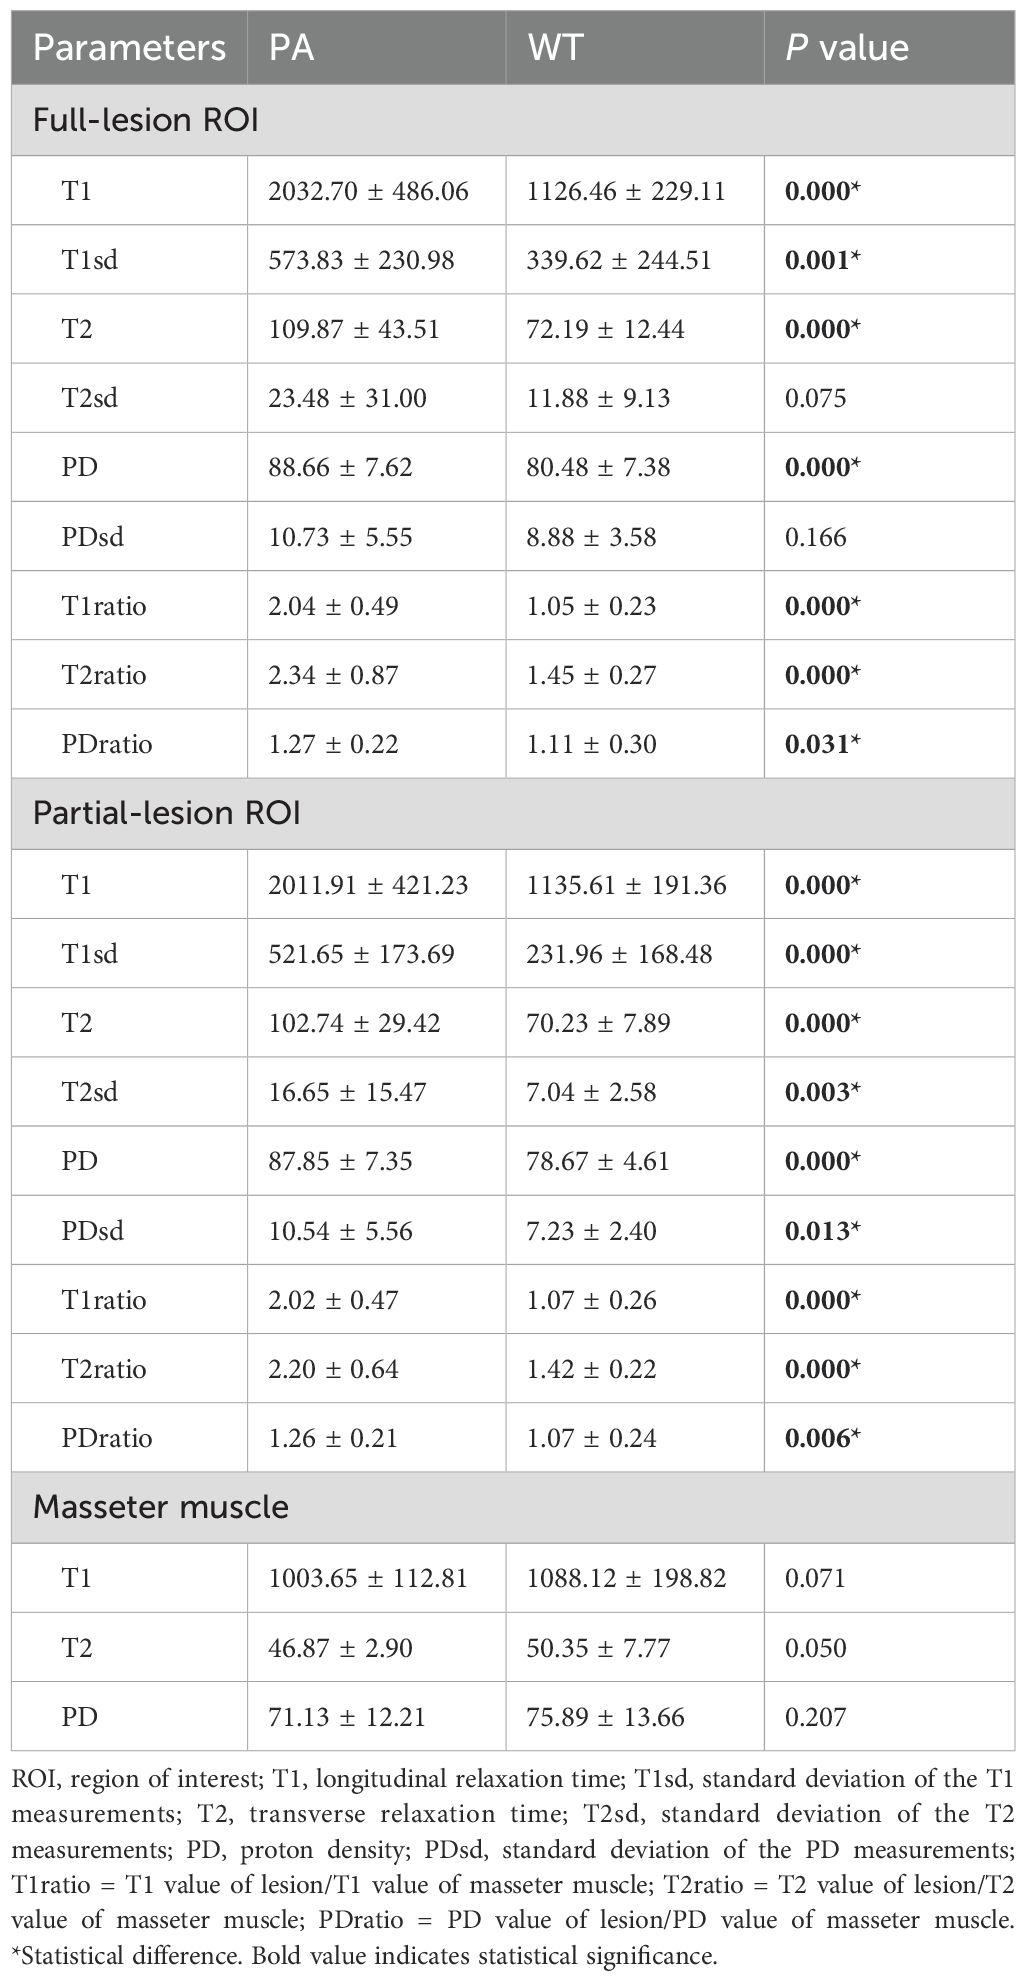
Table 3. Comparison of quantitative parameters between PA and WT based on full and partial lesion ROIs.
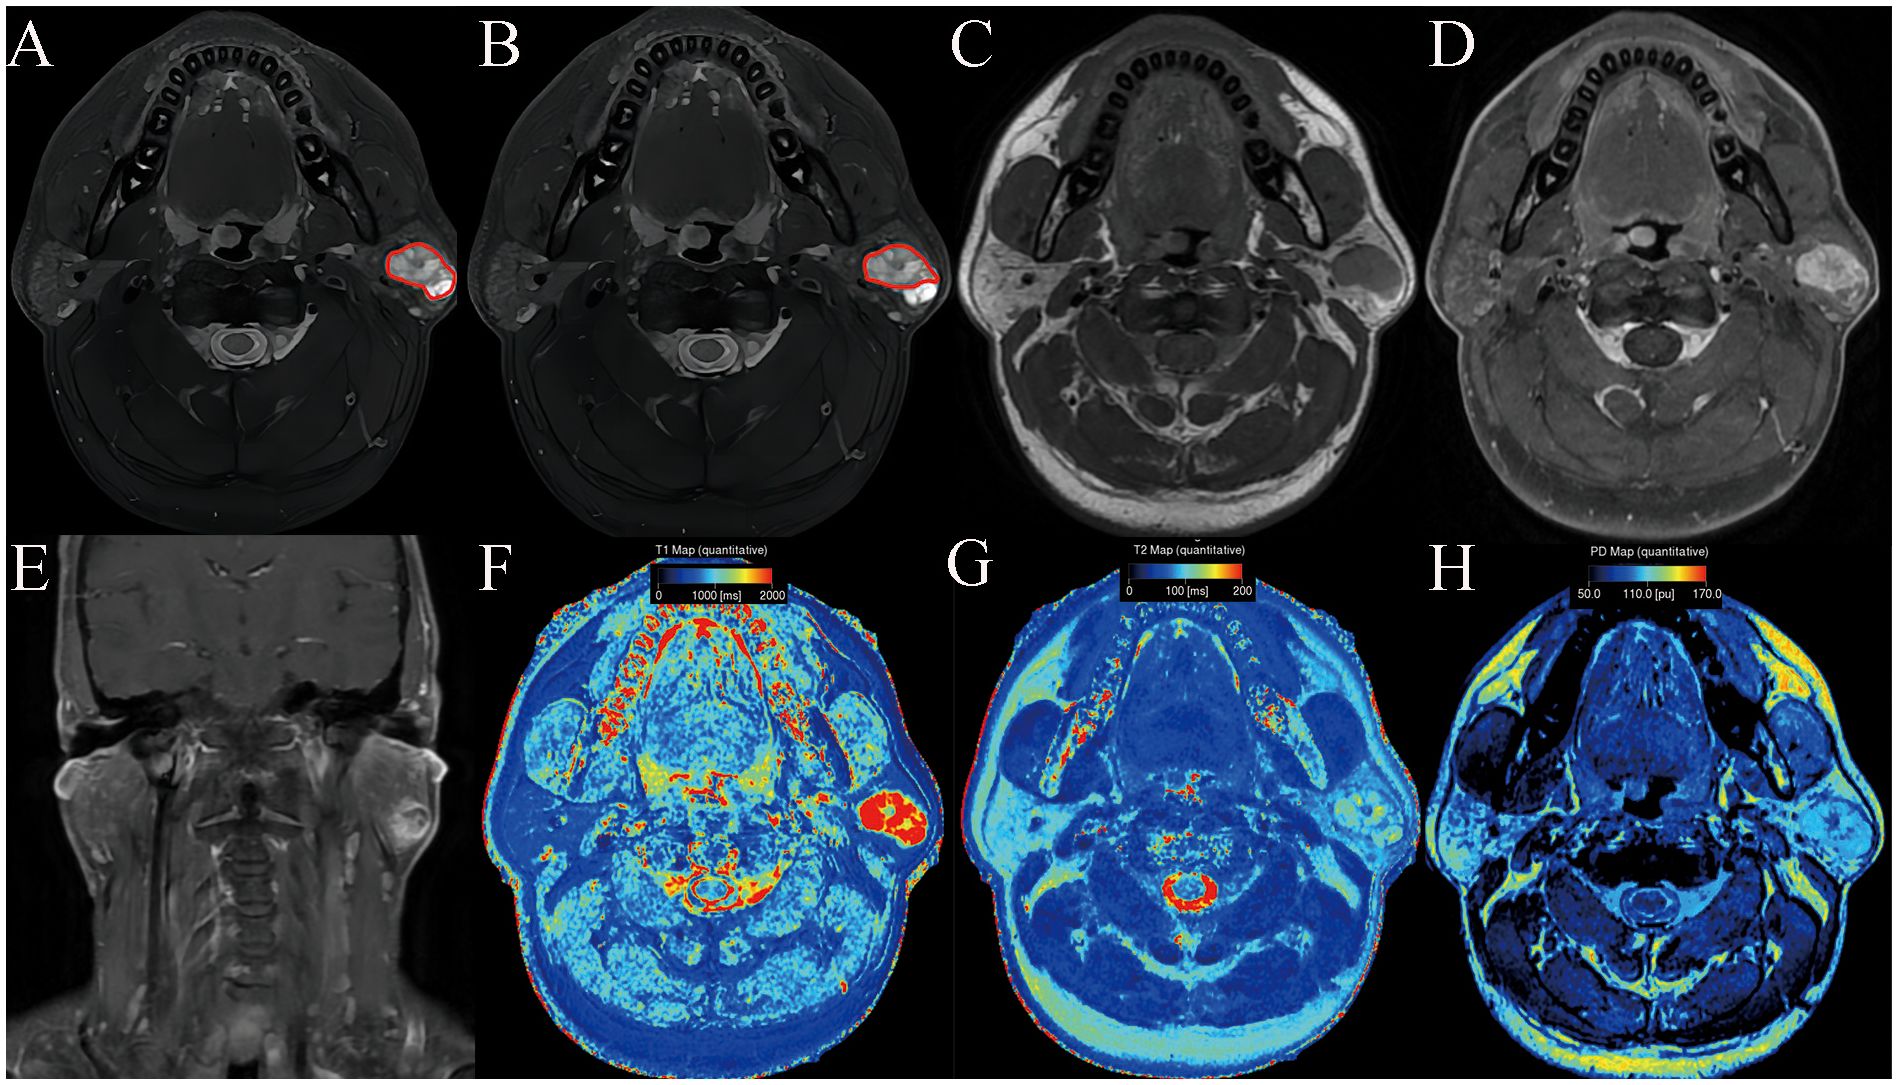
Figure 1. Pleomorphic adenoma of the parotid gland in a 42-year-old male subject. The ROI delineation methods included the largest area of the largest section (full lesion, A) and the solid portion within the largest section (partial lesion, B). On conventional MRI, this mass showed hyperintense on T2WI (A, B), a well-defined border (C), and marked enhancement on contrast enhanced T1WI (D, E). In comparison with WT, it demonstrated significantly higher SyMRI-derived quantitative parameters for partial-lesion ROI (T1: 2077 ms; T1sd: 529 ms; T2: 90 ms; T2sd: 13 ms; PD:99 pu; PDsd: 8.4 pu) on axial T1 mapping (F), T2 mapping (G), and PD mapping (H).
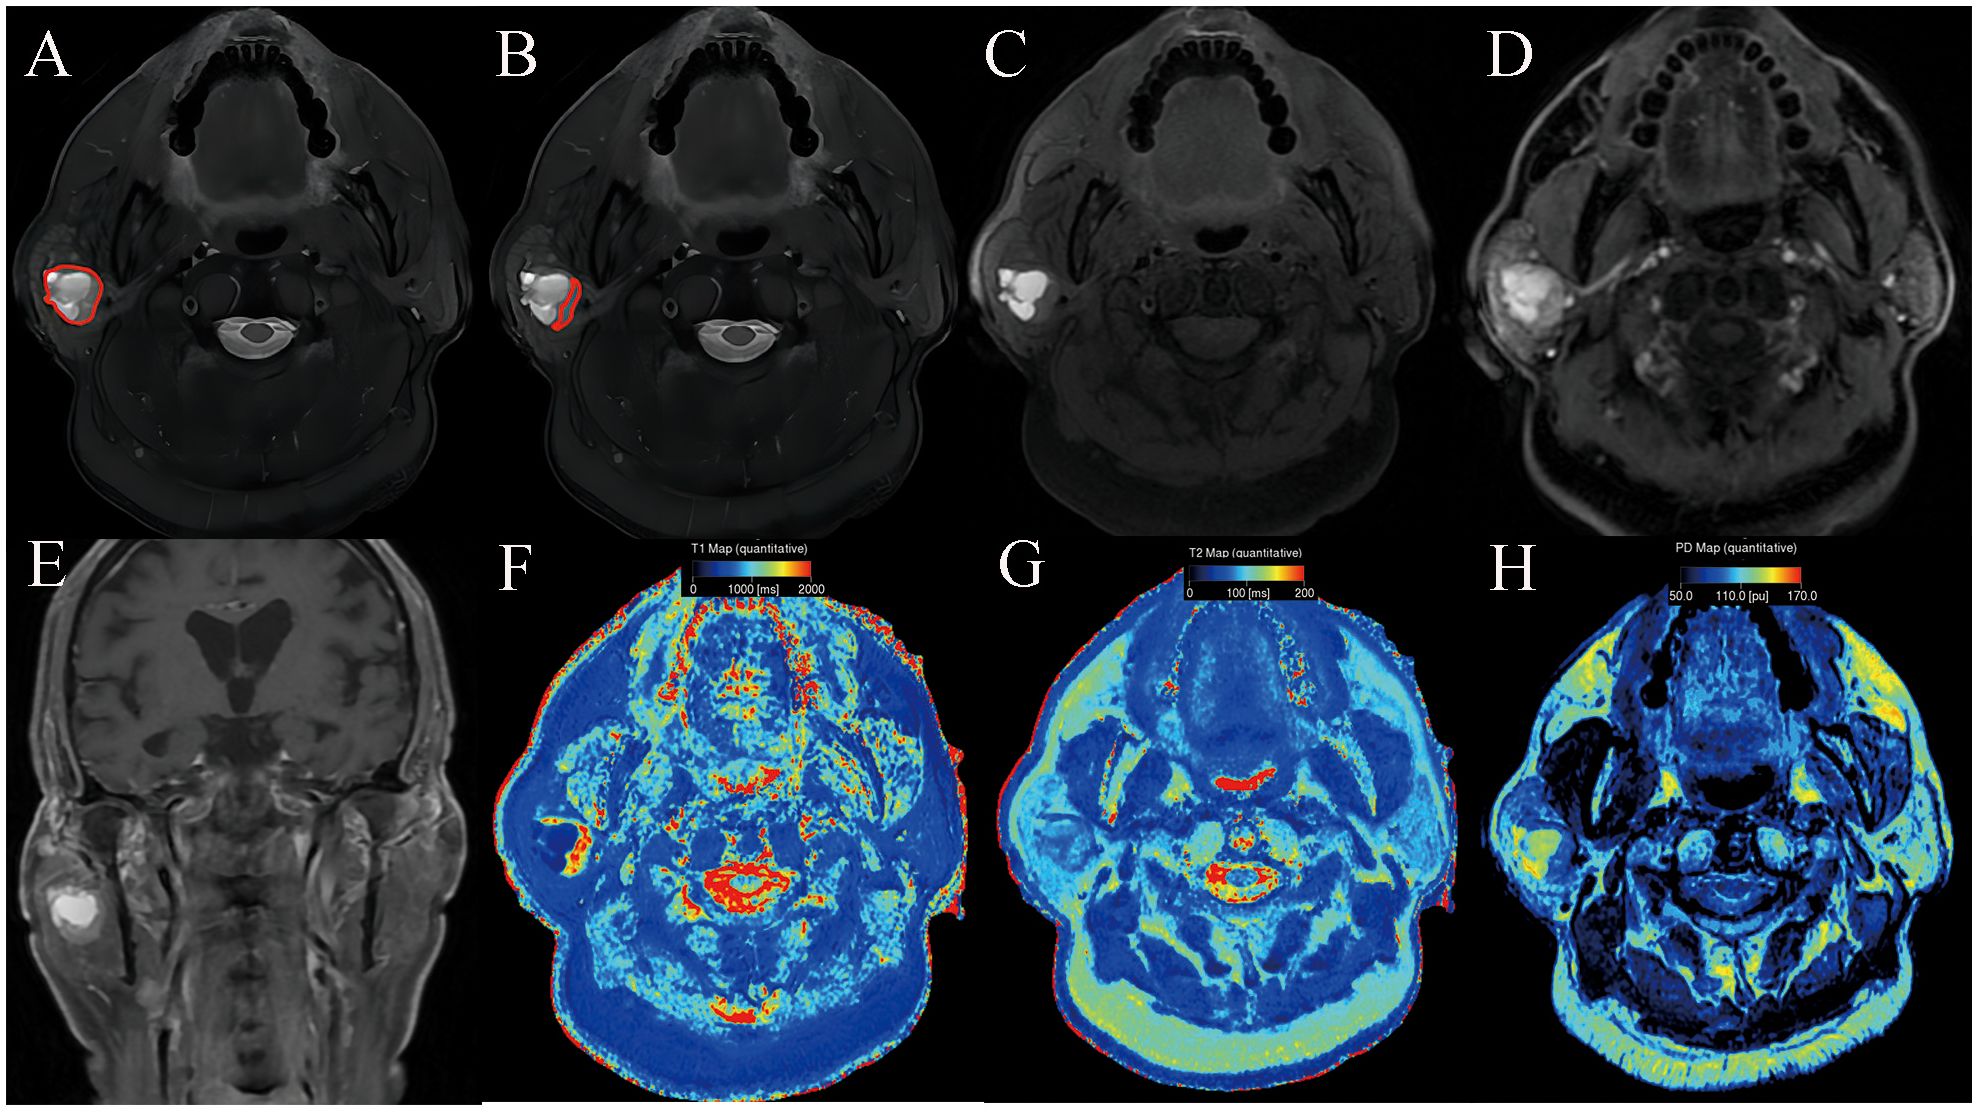
Figure 2. Warthin’s tumor of the parotid gland in a 77-year-old male subject. The ROI delineation methods included the largest area of the largest section (full lesion, A) and the solid portion within the largest section (partial lesion, B). On conventional MRI, the solid component shows moderate signal and cyst/necrosis shows hyperintense on T2WI (A, B), a well-defined border (C), and moderate enhancement on contrast enhanced T1WI (D, E). In comparison with PA, it demonstrated significantly lower SyMRI-derived quantitative parameters for partial-lesion ROI (T1: 1723 ms; T1sd: 269 ms; T2: 79 ms; T2sd: 7 ms; PD: 86.4 pu; PDsd: 6.1 pu) on axial T1 mapping (F), T2 mapping (G), and PD mapping (H).
Differentiation between PA and WT patients using SyMRIFor differentiating PA from WT, the AUCs for these quantitative parameters range from 0.722 to 0.983 based on the ROC analysis. The T1 values obtained from the partial-lesion ROI delineation showed the highest AUC of 0.983 among all single parameters (Table 4; Figures 3A, B). Using a cutoff value of 1322 ms to discriminate between PA and WT subjects, the T1 values obtained from partial-lesion ROI delineation achieved 88.46% sensitivity, 100% specificity, and 93.88% accuracy, respectively.
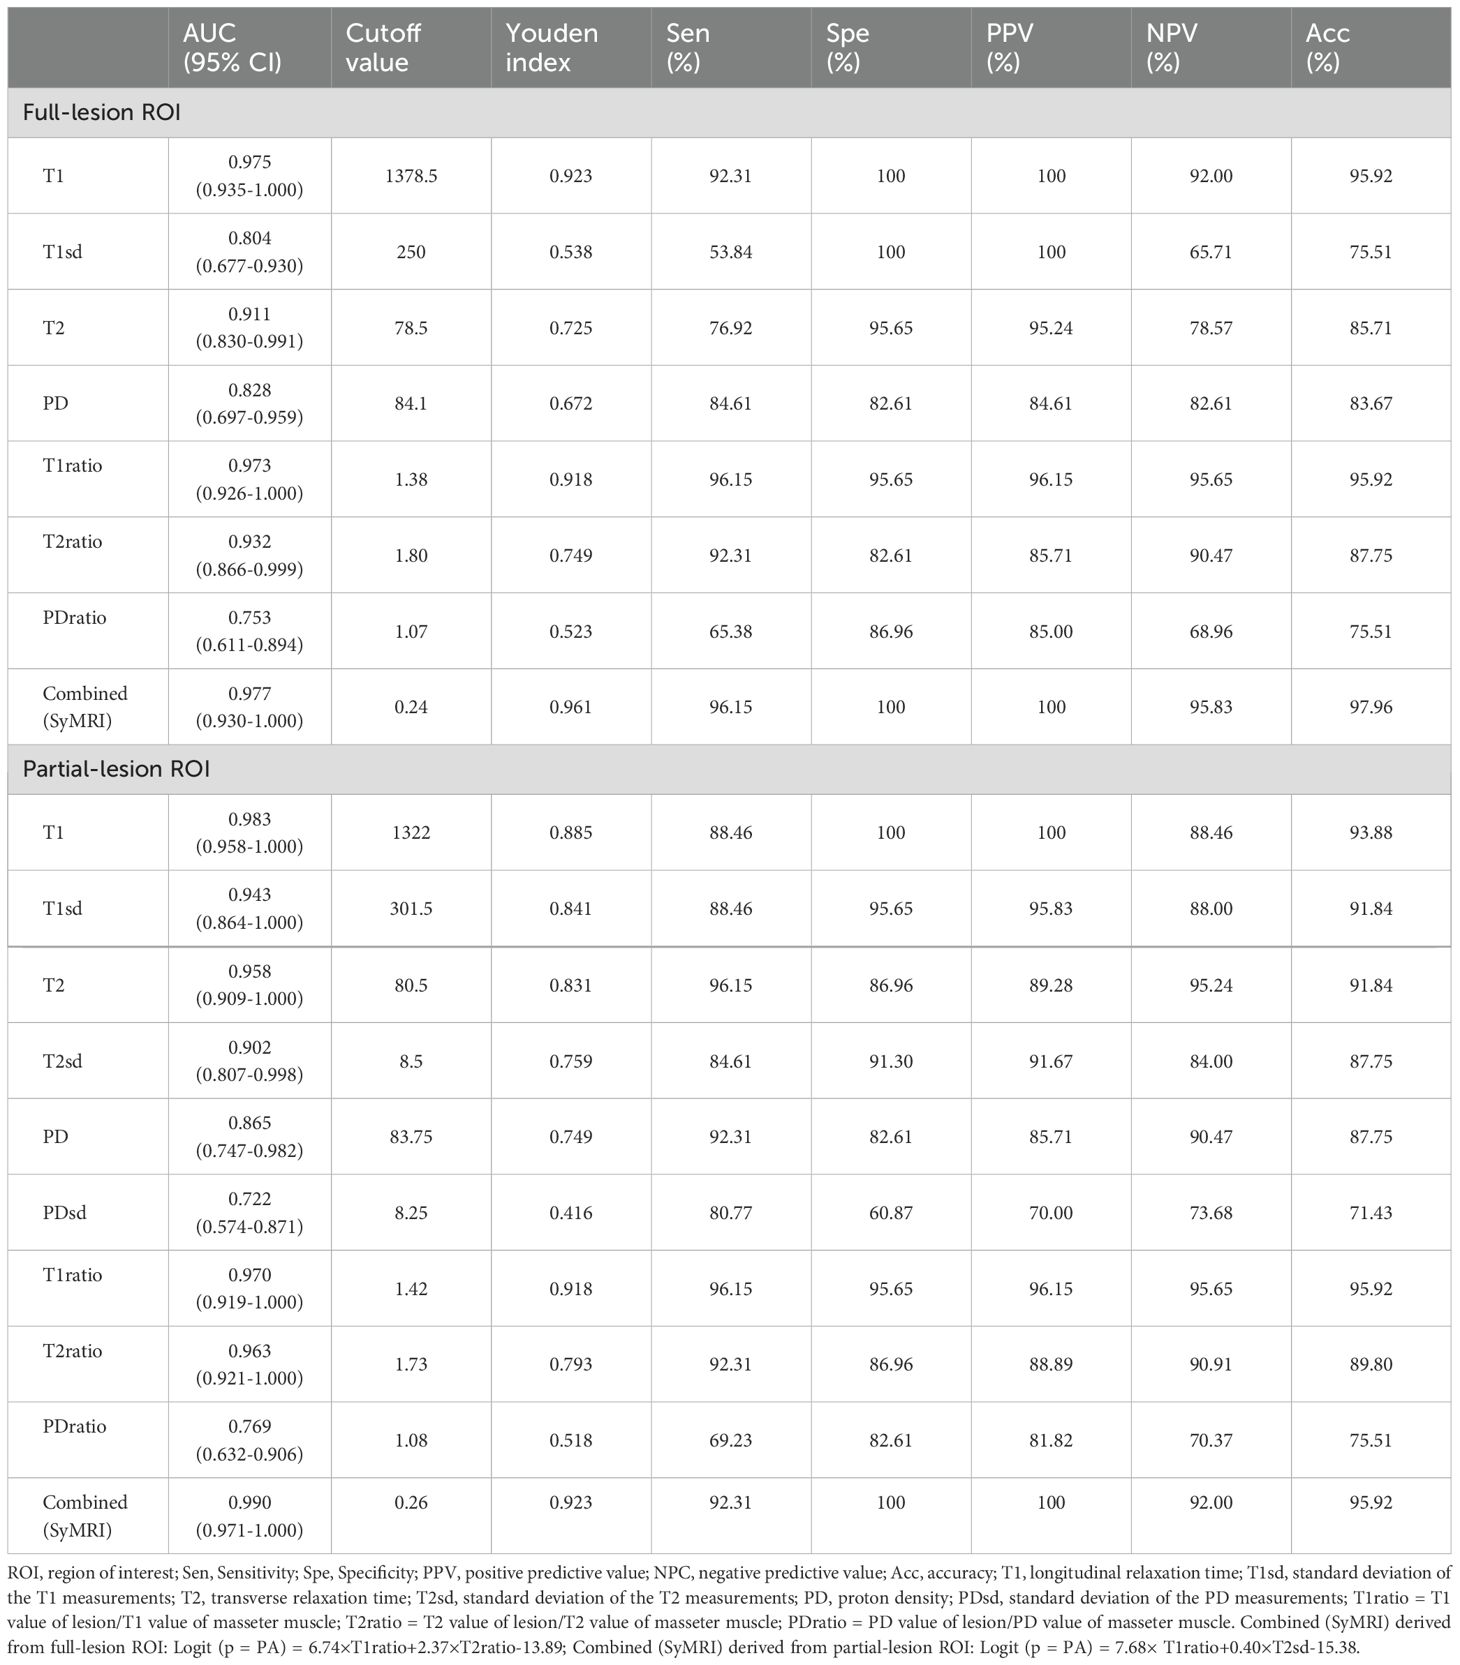
Table 4. Diagnostic capability of quantitative parameters calculated from full-lesion and partial-lesion ROIs for differentiating PA from WT.
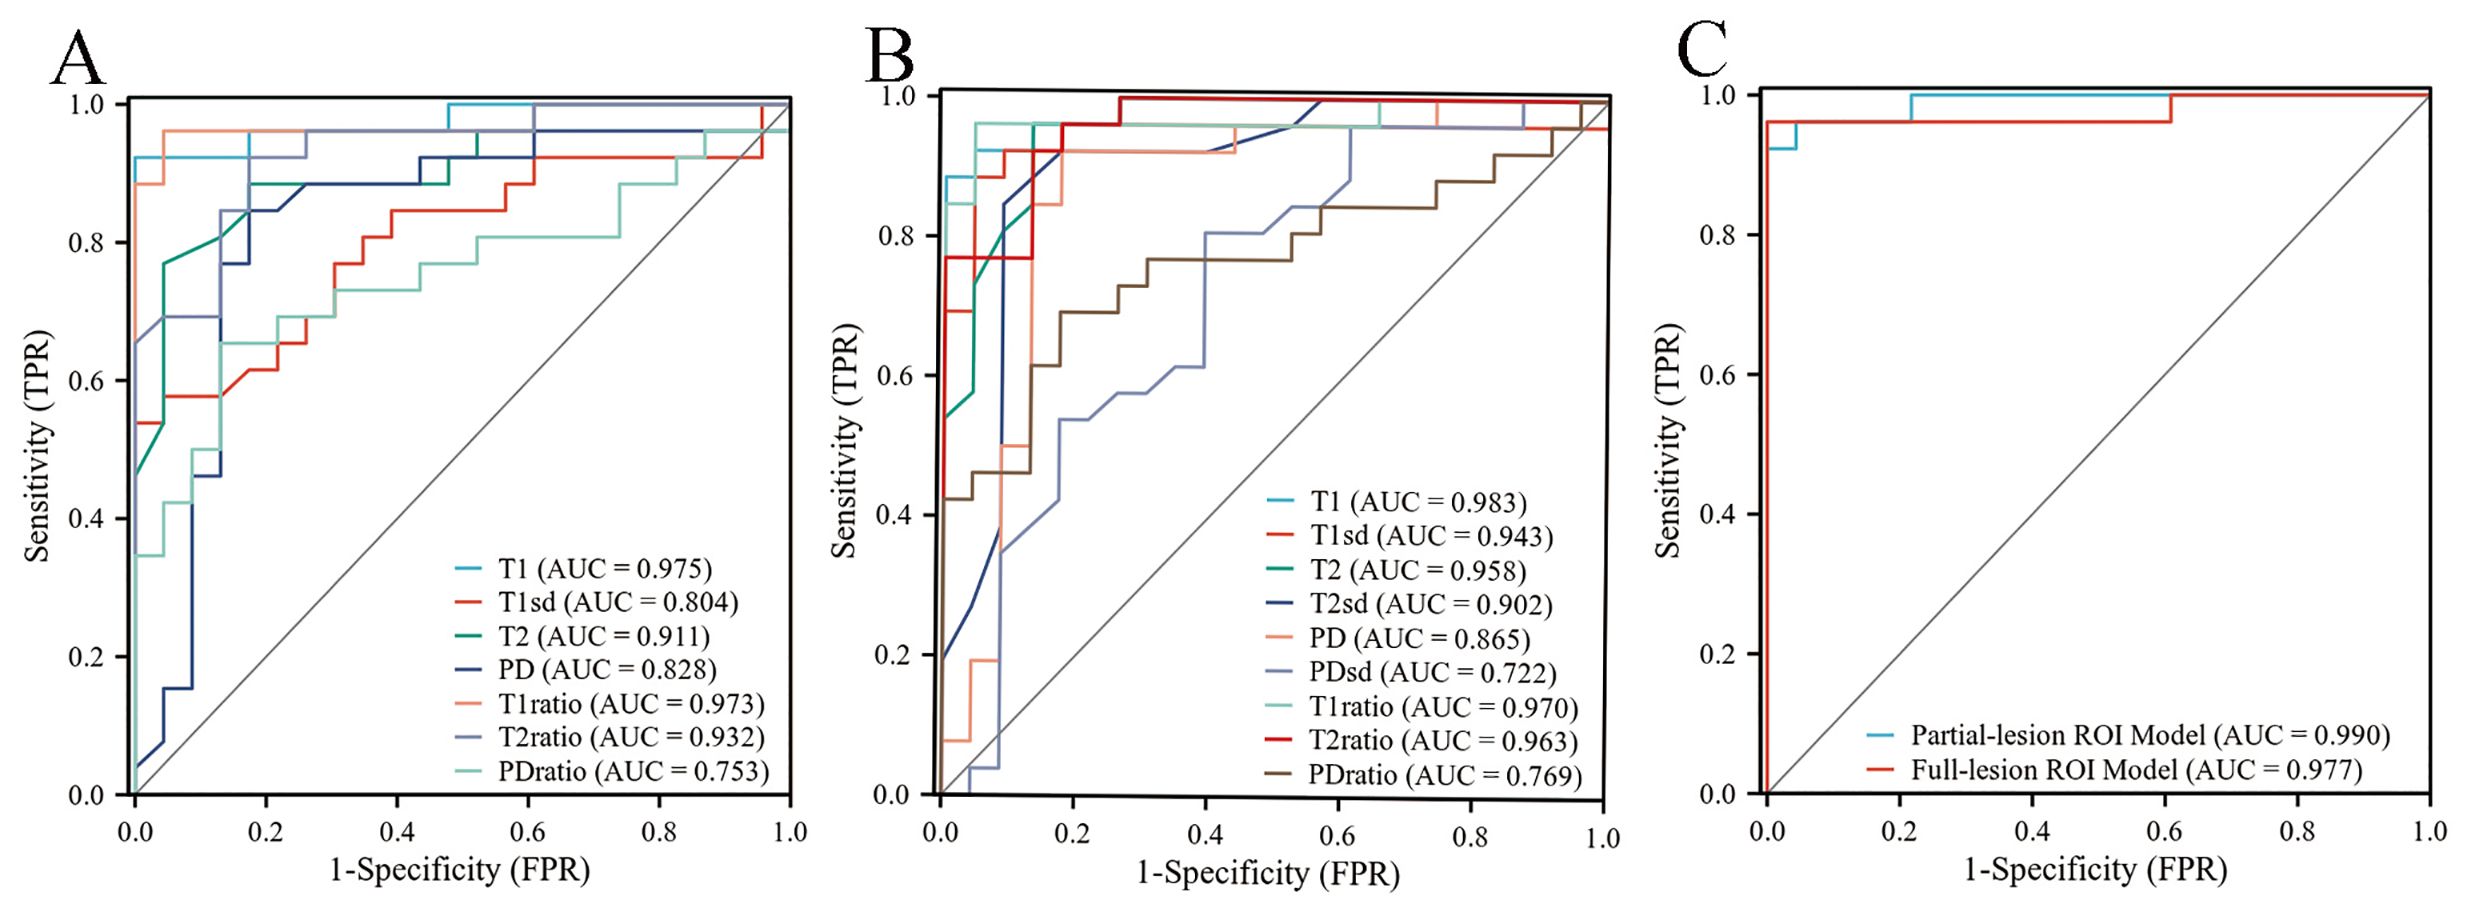
Figure 3. (A) ROC curves of quantitative parameters derived from full-lesion ROI delineation for differentiating between PA and WT. (B) ROC curves of quantitative parameters derived from partial-lesion ROI delineation for differentiating between PA and WT. (C) ROC curves of the combined SyMRI-derived multiple parameters for differentiating between PA and WT. Combined SyMRI-derived multiple parameters showed similar AUCs with these two different ROI delineation methods.
The AUCs for T1, T2, PD, T1ratio, T2ratio and PDratio values did not differ between the partial and full lesion ROI delineation methods (all P > 0.05). Combined SyMRI-derived multiple parameters resulted in similar AUCs when delineating ROIs with these two different approaches (P > 0.05) (Figure 3C). The AUCs for T1sd, T2sd, and PDsd values differed significantly between partial and full lesion ROI delineations (all P < 0.05).
DiscussionIn this study, based on full and partial lesion ROIs, we observed that T1, T1sd, T2, PD, T1ratio, T2ratio, and PDratio were higher in PA than in WT. Moreover, the T2sd and PDsd of PA derived from partial-lesion ROI were significantly higher than those of WT. No significant differences, however, were found in the T2sd and PDsd derived from full-lesion ROI between the PA and WT groups. We also demonstrated the ability of SyMRI parameters to discriminate between subjects with PA and those with WT. As far as we know, this study is the first to investigate the quantitative parameters of SyMRI and assess its diagnostic power for PA and WT individuals.
A previous study using T1 mapping in parotid gland tumors has demonstrated that the mean T1 relaxation time is higher in PA than in WT (26). Similarly, we revealed that the T1 value of PA was significantly higher than that of WT using SyMRI, with either partial or full lesion ROI delineation approaches. The T1 values obtained from the partial-lesion ROI delineation showed the highest AUC of 0.983 among all single parameters. Using a cutoff value of 1322 ms to discriminate between PA and WT subjects, the T1 values obtained from partial-lesion ROI delineation achieved 88.46% sensitivity, 100% specificity, and 93.88% accuracy, respectively. T1 value is influenced by water content, binding with macromolecules (water mobility), and cell content (27, 28). The higher T1 values of PA were attributed to the tiny nuclei of the epithelial and mesenchymal cells, low cell and neovascular densities, abundant stroma, large extracellular spaces, and excessive free water content in these tumors (29). The lower T1 values of WT may be attributed to the abundance of lymphocytes and lymph stromal cells, high microvascular density and cellular-stromal grade, low free water content, relatively small extracellular space, and limited diffusion of water molecules (29). This suggests that T1 values may be valuable to distinguish PA from WT. To our knowledge, there are no studies published in the literature comparing PA and WT based on the standard deviation of T1 measurement (T1sd) value and T1 value of lesion/T1 value of masseter muscle (T1ratio). In this study, PA had a significantly higher T1sd than WT, suggesting that PA has more T1 variability over image pixels compared to WT. At the cellular level, PA is characterized by morphological diversity that includes both epithelial and mesenchymal components, which may lead to higher T1 variability within ROIs. Lastly, we found that T1ratios were significantly higher in PA than in WT, yielding an AUC of 0.973 for full-lesion ROI, and 0.970 for partial-lesion ROI. Therefore, the T1ratio value may also be a valuable quantitative parameter for differentiating PA from WT.
In different tissues, T2 values (quantification of transverse relaxation time) have been identified as excellent and reproducible biomarkers of water content (especially free water molecules). A previous study using T2 mapping in parotid gland tumors has demonstrated that the mean T2 relaxation time is higher in PA than in WT (30). Our previous study found that the solid components of PA mostly showed hyperintense on T2-weighted imaging compared with WT (4). Using SyMRI, either partial or full lesion ROI delineation, we found that PA had a higher T2 value than WT. The similarities in these findings may be explained by the pathological features of PA and WT. This suggests that T2 values may be valuable to distinguish PA from WT. To our knowledge, there are no studies published in the literature comparing PA and WT based on the standard deviation of T2 measurement (T2sd) value and T2 value of lesion/T2 value of masseter muscle (T2ratio). In this study, we found that the T2sd of PA derived from partial-lesion ROI was significantly higher than that of WT. However, no significant difference between the PA and WT groups was confirmed in the T2sd derived from the full lesion ROI. Thus, the T2sd derived from partial-lesion ROI and T2ratio value may be valuable quantitative parameters for differentiating PA from WT.
The PD value, as another magnetic property of the tissue, primarily reflects the water content of tissue (31). A previous study found that the PD value could distinguish benign from malignant retropharyngeal lymph node (18). In our study, we found that PA had higher PD and PDratio values compared to WT. In addition, we found that the PDsd of PA derived from partial-lesion ROI was significantly higher than that of WT. However, no significant difference between the PA and WT groups was confirmed in the PDsd of PA derived from full-lesion ROI. Thus, the PD value, PDsd derived from partial-lesion ROI and PDratio value may be also valuable quantitative parameters for differentiating PA from WT.
In our study, two different ROI approaches, partial or full-lesion ROI, were conducted in parameter measures. No significant differences between partial- and full-lesion ROI delineation approaches were observed in the AUCs of T1, T2, PD, T1ratio, T2ratio, and PDratio values. Meanwhile, combined SyMRI-derived multiple parameters showed similar AUCs for two different ROI delineation approaches. Thus, different types of ROI selection schemes have insignificant effect on the quantitative parameters of SyMRI for distinguishing PA from WT.
Our study had several limitations. Firstly, we revolved only around PA and WT due to low incidence and low sample size of the other parotid tumors. Secondly, this was a single-center study, which limits the generalizability of our findings. So future multicenter studies are needed to confirm our findings. However, the T1, T2, and PD values of MRI are fundamental properties independent of the MRI scanners or scanning parameters at a given field strength, suggesting our findings could be generalized to other hospitals. Finally, future studies should use multiple imaging modalities to detect more sensitive and robust biomarkers for distinguishing PA from WT.
In conclusion, the quantitative parameters of SyMRI were shown to be efficient in distinguishing PA from WT, with T1 values derived from partial lesion ROI delineation demonstrating the best diagnostic performance among all individual parameters. Our findings may have important implications for preoperatively identifying optimal treatment strategies.
Data availability statementThe original contributions presented in the study are included in the article/supplementary material, further inquiries can be directed to the corresponding author/s.
Ethics statementThe studies involving humans were approved by the Ethics Committee of Changshu No.2 People’s Hospital, the Fifth Affiliated Clinical Medical College of Yangzhou University. The studies were conducted in accordance with the local legislation and institutional requirements. The participants provided their written informed consent to participate in this study.
Author contributionsJS: Data curation, Investigation, Software, Writing – original draft. XK: Funding acquisition, Methodology, Writing – original draft, Writing – review & editing. DH: Data curation, Writing – original draft. XJ: Data curation, Writing – original draft. CJ: Funding acquisition, Investigation, Supervision, Writing – original draft. SW: Conceptualization, Data curation, Software, Supervision, Writing – original draft.
FundingThe author(s) declare financial support was received for the research, authorship, and/or publication of this article. This work was supported by the China Postdoctoral Science Foundation (2021M702170) and Changshu science and technology bureau (CSEY2021018).
AcknowledgmentsWe thank all the subjects who participated in this study. The authors have declared no conflict of interest with respect to the subject of this study.
Conflict of interestThe authors declare that the research was conducted in the absence of any commercial or financial relationships that could be construed as a potential conflict of interest.
Publisher’s noteAll claims expressed in this article are solely those of the authors and do not necessarily represent those of their affiliated organizations, or those of the publisher, the editors and the reviewers. Any product that may be evaluated in this article, or claim that may be made by its manufacturer, is not guaranteed or endorsed by the publisher.
References1. Sentani K, Ogawa I, Ozasa K, Sadakane A, Utada M, Tsuya T, et al. Characteristics of 5015 salivary gland neoplasms registered in the hiroshima tumor tissue registry over a period of 39 years. J Clin Med. (2019) 8:566. doi: 10.3390/jcm8050566
PubMed Abstract | Crossref Full Text | Google Scholar
2. Andreasen S, Therkildsen MH, Bjørndal K, Homøe P. Pleomorphic adenoma of the parotid gland 1985-2010: A Danish nationwide study of incidence, recurrence rate, and Malignant transformation. Head neck. (2016) 38 Suppl 1:E1364–9. doi: 10.1002/hed.v38.S1
PubMed Abstract | Crossref Full Text | Google Scholar
3. Espinoza S, Felter A, Malinvaud D, Badoual C, Chatellier G, Siauve N, et al. Warthin’s tumor of parotid gland: Surgery or follow-up? Diagnostic value of a decisional algorithm with functional MRI. Diagn interventional imaging. (2016) 97:37–43. doi: 10.1016/j.diii.2014.11.024
Crossref Full Text | Google Scholar
4. Jia CH, Wang SY, Li Q, Qiu JM, Kuai XP. Conventional, diffusion, and dynamic contrast-enhanced MRI findings for differentiating metaplastic Warthin’s tumor of the parotid gland. Sci progress. (2021) 104:368504211018583. doi: 10.1177/00368504211018583
Crossref Full Text | Google Scholar
5. Antony J, Gopalan V, Smith RA, Lam AK. Carcinoma ex pleomorphic adenoma: a comprehensive review of clinical, pathological and molecular data. Head Neck pathol. (2012) 6:1–9. doi: 10.1007/s12105-011-0281-z
PubMed Abstract | Crossref Full Text | Google Scholar
6. Quer M, Hernandez-Prera JC, Silver CE, Casasayas M, Simo R, Vander Poorten V, et al. Current trends and controversies in the management of warthin tumor of the parotid gland. Diagnostics (Basel Switzerland). (2021) 11:1467. doi: 10.3390/diagnostics11081467
PubMed Abstract | Crossref Full Text | Google Scholar
7. Sood S, McGurk M, Vaz F. Management of salivary gland tumours: United Kingdom national multidisciplinary guidelines. J laryngol otol. (2016) 130:S142–s149. doi: 10.1017/S0022215116000566
PubMed Abstract | Crossref Full Text | Google Scholar
8. Zaghi S, Hendizadeh L, Hung T, Farahvar S, Abemayor E, Sepahdari AR. MRI criteria for the diagnosis of pleomorphic adenoma: a validation study. Am J otolaryngol. (2014) 35:713–8. doi: 10.1016/j.amjoto.2014.07.013
PubMed Abstract | Crossref Full Text | Google Scholar
9. Yabuuchi H, Matsuo Y, Kamitani T, Setoguchi T, Okafuji T, Soeda H, et al. Parotid gland tumors: can addition of diffusion-weighted MR imaging to dynamic contrast-enhanced MR imaging improve diagnostic accuracy in characterization? Radiology. (2008) 249:909–16. doi: 10.1148/radiol.2493072045
PubMed Abstract | Crossref Full Text | Google Scholar
10. Coudert H, Mirafzal S, Dissard A, Boyer L, Montoriol PF. Multiparametric magnetic resonance imaging of parotid tumors: A systematic review. Diagn interventional imaging. (2021) 102:121–30. doi: 10.1016/j.diii.2020.08.002
Crossref Full Text | Google Scholar
11. Xu Z, Chen M, Zheng S, Chen S, Xiao J, Hu Z, et al. Differential diagnosis of parotid gland tumours: Application of SWI combined with DWI and DCE-MRI. Eur J radiol. (2022) 146:110094. doi: 10.1016/j.ejrad.2021.110094
PubMed Abstract | Crossref Full Text | Google Scholar
12. Yabuuchi H, Fukuya T, Tajima T, Hachitanda Y, Tomita K, Koga M. Salivary gland tumors: diagnostic value of gadolinium-enhanced dynamic MR imaging with histopathologic correlation. Radiology. (2003) 226:345–54. doi: 10.1148/radiol.2262011486
PubMed Abstract | Crossref Full Text | Google Scholar
13. Gabelloni M, Faggioni L, Attanasio S, Vani V, Goddi A, Colantonio S, et al. Can magnetic resonance radiomics analysis discriminate parotid gland tumors? A pilot study. Diagnostics (Basel Switzerland). (2020) 10:900. doi: 10.3390/diagnostics10110900
PubMed Abstract | Crossref Full Text | Google Scholar
14. Tanenbaum LN, Tsiouris AJ, Johnson AN, Naidich TP, DeLano MC, Melhem ER, et al. Synthetic MRI for clinical neuroimaging: results of the magnetic resonance image compilation (MAGiC) prospective, multicenter, multireader trial. AJNR Am J neuroradiol. (2017) 38:1103–10. doi: 10.3174/ajnr.A5227
PubMed Abstract | Crossref Full Text | Google Scholar
15. Hagiwara A, Hori M, Cohen-Adad J, Nakazawa M, Suzuki Y, Kasahara A, et al. Linearity, bias, intrascanner repeatability, and interscanner reproducibility of quantitative multidynamic multiecho sequence for rapid simultaneous relaxometry at 3 T: A validation study with a standardized phantom and healthy controls. Invest radiol. (2019) 54:39–47. doi: 10.1097/RLI.0000000000000510
PubMed Abstract | Crossref Full Text | Google Scholar
16. Gao W, Zhang S, Guo J, Wei X, Li X, Diao Y, et al. Investigation of synthetic relaxometry and diffusion measures in the differentiation of benign and Malignant breast lesions as compared to BI-RADS. J magnetic resonance imaging: JMRI. (2021) 53:1118–27. doi: 10.1002/jmri.27435
Crossref Full Text | Google Scholar
17. Cui Y, Han S, Liu M, Wu PY, Zhang W, Zhang J, et al. Diagnosis and grading of prostate cancer by relaxation maps from synthetic MRI. J magnetic resonance imaging: JMRI. (2020) 52:552–64. doi: 10.1002/jmri.27075
Crossref Full Text | Google Scholar
18. Wang P, Hu S, Wang X, Ge Y, Zhao J, Qiao H, et al. Synthetic MRI in differentiating benign from metastatic retropharyngeal lymph node: combination with diffusion-weighted imaging. Eur radiol. (2023) 33:152–61. doi: 10.1007/s00330-022-09027-4
PubMed Abstract | Crossref Full Text | Google Scholar
19. Xu X, Su G, Hu H, Wang Y, Hong X, Shi H, et al. Effects of regions of interest methods on apparent coefficient measurement of the parotid gland in early Sjögren’s syndrome at 3T MRI. Acta radiologica (Stockholm Sweden: 1987). (2017) 58:27–33. doi: 10.1177/0284185116637245
PubMed Abstract | Crossref Full Text | Google Scholar
20. Bruvo M, Mahmood F. Apparent diffusion coefficient measurement of the parotid gland parenchyma. Quantitative Imaging Med surgery. (2021) 11:3812–29. doi: 10.21037/qims-20-1178
Crossref Full Text | Google Scholar
21. Yabuuchi H, Kamitani T, Sagiyama K, Yamasaki Y, Hida T, Matsuura Y, et al. Characterization of parotid gland tumors: added value of permeability MR imaging to DWI and DCE-MRI. Eur radiol. (2020) 30:6402–12. doi: 10.1007/s00330-020-07004-3
PubMed Abstract | Crossref Full Text | Google Scholar
22. Han X, Suo S, Sun Y, Zu J, Qu J, Zhou Y, et al. Apparent diffusion coefficient measurement in glioma: Influence of region-of-interest determination methods on apparent diffusion coefficient values, interobserver variability, time efficiency, and diagnostic ability. J magnetic resonance imaging: JMRI. (2017) 45:722–30. doi: 10.1002/jmri.25405
Crossref Full Text | Google Scholar
23. Zhang H, Zhao J, Dai J, Chang J, Hu S, Wang P. Synthetic MRI quantitative parameters in discriminating stage T1 nasopharyngeal carcinoma and benign hyperplasia: Combination with morphological features. Eur J radiol. (2024) 170:111264. doi: 10.1016/j.ejrad.2023.111264
PubMed Abstract | Crossref Full Text | Google Scholar
24. Kuai X, Zhu Y, Yuan Z, Wang S, Lin L, Ye X, et al. Perfluorooctyl bromide nanoemulsions holding MnO(2) nanoparticles with dual-modality imaging and glutathione depletion enhanced HIFU-eliciting tumor immunogenic cell death. Acta Pharm Sinica B. (2022) 12:967–81. doi: 10.1016/j.apsb.2021.07.025
Crossref Full Text | Google Scholar
25. Kuai X, Shao D, Wang S, Wu PY, Wu Y, Wang X. Neuromelanin-sensitive MRI of the substantia nigra distinguishes bipolar from unipolar depression. Cereb Cortex. (2024) 34:bhad423. doi: 10.1093/cercor/bhad423
PubMed Abstract | Crossref Full Text | Google Scholar
26. Wen B, Zhang Z, Fu K, Zhu J, Liu L, Gao E, et al. Value of pre-/post-contrast-enhanced T1 mapping and readout segmentation of long variable echo-train diffusion-weighted imaging in differentiating parotid gland tumors. Eur J radiol. (2023) 162:110748. doi: 10.1016/j.ejrad.2023.110748
PubMed Abstract | Crossref Full Text | Google Scholar
27. Cameron IL, Ord VA, Fullerton GD. Characterization of proton NMR relaxation times in normal and pathological tissues by correlation with other tissue parameters. Magnetic resonance imaging. (1984) 2:97–106. doi: 10.1016/0730-725X(84)90063-8
PubMed Abstract | Crossref Full Text | Google Scholar
28. Meng T, He H, Liu H, Lv X, Huang C, Zhong L, et al. Investigation of the feasibility of synthetic MRI in the differential diagnosis of non-keratinising nasopharyngeal carcinoma and benign hyperplasia using different contoured methods for delineation of the region of interest. Clin radiol. (2021) 76:238.e9–238.e15. doi: 10.1016/j.crad.2020.10.010
PubMed Abstract | Crossref Full Text | Google Scholar
30. Baohong W, Jing Z, Zanxia Z, Kun F, Liang L, Eryuan G, et al. T2 mapping and readout segmentation of long variable echo-train diffusion-weighted imaging for the differentiation of parotid gland tumors. Eur J radiol. (2022) 151:110265. doi: 10.1016/j.ejrad.2022.110265
PubMed Abstract | Crossref Full Text | Google Scholar
31. Gracien RM, Reitz SC, Hof SM, Fleischer V, Zimmermann H, Droby A, et al. Changes and variability of proton density and T1 relaxation times in early multiple sclerosis: MRI markers of neuronal damage in the cerebral cortex. Eur radiol. (2016) 26:2578–86. doi: 10.1007/s00330-015-4072-x
留言 (0)