Study design, clinical cohort and ethics statement
The DoxyPEP trial (ClinicalTrials.gov registration number: NCT03980223)2 compared doxy-PEP use (doxycycline post-exposure prophylaxis) to standard of care (no post-exposure prophylaxis) for 501 participants. The study was conducted at two HIV clinics and two sexual health clinics in San Francisco and Seattle. Individuals were eligible for enrollment if they were at least 18 years of age; had male sex assigned at birth; had received a diagnosis of HIV or were on HIV PrEP; and had received a bacterial STI diagnosis of gonorrhea, chlamydia or early syphilis in the previous 12 months. Participants were randomized in a 2:1 ratio to the DP arm or the SOC arm. Participants in the DP arm were counseled to take a 200-mg doxycycline hyclate dose within 72 h after condomless anogenital, vaginal or oral sex and no more than one dose every 24 h. Participants in both arms self-collected rectal swabs at enrollment (day 0) and at a 6-month visit (month 6). Demographic and clinical information (for example, age, HIV infection status, number of doxy-PEP doses and antibiotic exposures during the study period) were collected for each participant via RedCAP39,40 (hosted at the University of Washington) and Microsoft Excel. Among all 501 participants in the DoxyPEP trial, 292 (58%) had chlamydial infection in the prior year and were likely to have taken a course of doxycycline for chlamydia treatment at least once in the prior year. Additional information on doxycycline exposure before enrollment and timing of the doxy-PEP use before sample collection was unavailable. The study protocol2 was approved by the University of California, San Francisco institutional review board, which served as the primary institutional review board. All participants provided written informed consent, and no monetary compensation was provided for participation.
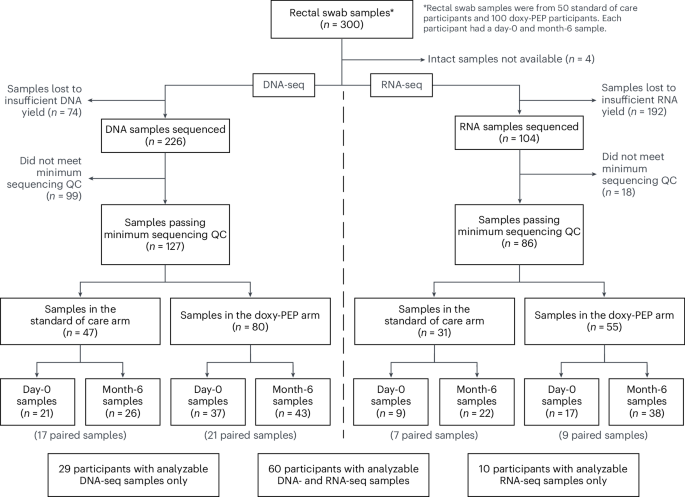
For this analysis, a subset of 150 participants from the 510 DoxyPEP trial participants was selected for metagenomic sequencing of self-collected rectal swab samples. The 150 participants were selected based on the following criteria: (1) study arm group (50 SOC, 100 DP); (2) HIV infection status (1:1 of participants living with HIV and participants on HIV PrEP); and (3) availability of both day-0 and month-6 rectal samples (Fig. 1). The SOC participants were a simple random sample, whereas the DP participants were the top 50 participants, including participants both with and without HIV infection, with the highest reported combined doxy-PEP use on the month-3 and month-6 study visits.
Cohort description
We performed descriptive analysis of participant demographics and compared the participants in the DP arm to participants in the SOC arm. No sex or gender analysis was carried out given that the study population enrolled only those who were assigned male sex at birth. P values for categorical variables were obtained using the Pearson’s chi-square test and Fisher’s exact test if counts were less than 5; P values for continuous variables were calculated using the two-sided Wilcoxon rank-sum test.
Metagenomic sequencing
Metagenomic sequencing of DNA-seq and RNA-seq was performed on the day-0 and month-6 rectal swabs from the 150 participants. Swabs were self-collected into DNA/RNA Shield collection tubes (Zymo Research, R1107-E) and stored at −80 °C within 2 weeks of collection. Total nucleic acid was extracted from 500 µl of DNA/RNA Shield solution using a previously described modified cetyltrimethylammonium bromide (CTAB)-based protocol41 and in samples with sufficient yield, normalized to 10 ng of total input per sample.
DNA-seq was carried out using a NEBNext Ultra II DNA Kit (New England Biolabs, E7645L). Before RNA-seq, human cytosolic and mitochondrial ribosomal RNA was depleted using FastSelect (Qiagen, 334385). RNA was then fragmented and underwent library preparation using a NEBNext Ultra II RNA-seq Kit (New England Biolabs, E7770L) according to the manufacturer’s instructions. Both DNA-seq and RNA-seq library preparation protocols were optimized for a LabCyte Echo acoustic liquid handler42. Finished libraries underwent paired-end Illumina sequencing on a NovaSeq 6000 instrument.
For the purposes of background contamination correction and to enable estimation of microbial mass, negative water controls and positive controls (spike-in RNA standards from the External RNA Controls Consortium (ERCC), Thermo Fisher Scientific, 4456740)43 were included in every RNA sample before RNA-seq library preparation. Reverse-transcribed complementary DNA ERCC standards were spiked into every DNA sample before DNA-seq library preparation.
Detection of microbes and ARGs
We leveraged the open-source CZ ID pipeline (https://czid.org/) as a first step to detect both microbes (mNGS pipeline version 8.1) and ARGs (AMR pipeline version 1.2.15)44. For microbial detection, the CZ ID pipeline performed subtractive alignment of the human genome (National Center for Biotechnology Information (NCBI)) from input raw FASTQ files, followed by quality and complexity filtering. The remaining microbial reads were then identified by an assembly-based alignment against reference genomes from the NCBI nucleotide (NT) database. After background correction (see below), all remaining taxa with at least 10 hits to the NCBI NT database and one hit to the NCBI non-redundant (NR) protein database with a minimum alignment length of 50 bases were retained for downstream microbiome analyses. All samples with more than 100,000 reads and, for DNA-seq samples, samples with a duplicate compression ratio less than 10 were retained for downstream analyses of microbes and ARGs. CZ ID’s antimicrobial resistance pipeline implements the Comprehensive Antibiotic Resistance Database (CARD)45,46 Resistance Gene Identifier (RGI) tool, which aligns quality-controlled reads against the CARD databases (canonical CARD version 3.2.6 and WildCARD version 4.0.0) of ARG sequences. ARGs with ≥5% read coverage breadth were retained for downstream analyses.
Identification and mitigation of environmental contaminants
Negative water controls were processed in parallel with the participant samples for microbial and ARG detection, allowing for an estimation of the number of background reads expected for each taxon and ARG42. A negative binomial model was used to identify and select for taxa and ARGs present in the participant samples at an abundance significantly greater than in the negative controls47. The number of background reads was modeled as a negative binomial distribution, with mean and dispersion fitted on the negative controls. For each batch (DNA-seq only) and taxon/ARG, the mean parameter of the negative binomial was estimated by averaging the read counts across all negative controls. Using the functions glm.nb() and theta.md() from the R package MASS48 (version 7.3.58.1), a single dispersion parameter across all taxa was then estimated. Taxa associated with P ≥ 0.05 were excluded; P values were adjusted for multiple comparisons using the Benjamini–Hochberg false discovery rate (FDR) method.
Mass calculations
Microbial mass and ARG mass were calculated based on the total reads aligning to the ERCC RNA standards43 spiked into each sample (RNA-seq) or reverse-transcribed cDNA ERCC standards (DNA-seq). ERCC input mass was 25 pg for DNA-seq samples and 2.5 pg for RNA-seq samples. The following equations were used for microbial input mass, normalized by total million sequencing reads to account for sample variation in input mass:
$$}=\frac}* }}}}}}(})},$$
and, for ARG input mass, normalized by total million sequencing reads:
$$}=\frac}* }}}}}}(})}.$$
ARG depth was defined as the mean read depth across the references sequence. The mass of an ARG class was the summation of the mass of all ARGs belonging to the class of interest. Similarly, total microbial or ARG mass of each sample was a summation of the mass of all microbes or ARGs, respectively.
Statistical analysesResistome analysis
We evaluated the impact of doxy-PEP use on ecological parameters, including the resistome alpha diversity, resistome beta diversity and log10-transformed total resistome mass. Alpha diversity was calculated by Shannon diversity index, accounting for ARG abundance (depth per million (dpm)) and evenness. Beta diversity among samples with at least one ARG was calculated using Bray–Curtis dissimilarity with 1,000 permutations, accounting for presence/absence and abundance of the ARGs (dpm). Analysis of multivariate homogeneity of group dispersions was performed using the functions betadisper() and permutest(). Beta diversity was displayed via non-metric multi-dimensional scaling (NMDS) and the function metaMDS(). One outlier from the DP arm was omitted from the RNA-seq beta diversity plot for graphical purposes (coordinates NMDS1: 9.9; NMDS2: −0.3) but was included in the calculations. The adonis2() function was used to perform a PERMANOVA test and adjusted for multiple comparisons. Both diversity calculations were performed using the R package ‘vegan’ (version 2.6.4)49.
We assessed the impact of doxy-PEP use on tetracycline ARG richness (number of distinct ARG types) and proportion of each ARG class mass to the total resistome mass. We focused on ARG classes where the median proportion of the ARG class mass of the resistome mass per sample was more than 1% in any of the following subgroups (SOC day-0, SOC month-6, doxy-PEP day-0 and doxy-PEP month-6) for DNA-seq or RNA-seq data; these ARG classes included aminoglycosides, beta-lactams, MLS, sulfonamide/trimethoprim and tetracyclines (Supplementary Table 2). ARGs that included tetracycline resistance but also conferred resistance to multiple other classes were ‘multi-drug efflux pumps’; these were not included in the ARG class analysis given that the proportional mass was less than 1% of the resistome mass (Supplementary Table 2). We also compared ARG class abundance and expression; both were measured and normalized per million reads sequenced and gene length (dpm) in the metagenome and the metatranscriptome, respectively. Within the tetracycline ARGs, we described the different mechanisms of resistance (tetracycline target protection, tetracycline inactivation and tetracycline-specific efflux pumps) detected.
We used inflated beta-regression models to examine the association between doxy-PEP use (independent variable) and the proportional ARG class mass within the resistome (dependent variable) using the function gamlss() (family = ’BEINF’) from the R package ‘gamlss’ (version 5.4-22). We included HIV infection status and the number of days of cephalosporin exposures between enrollment and sample collection as covariates in the inflated beta regression models. We chose to include only the cephalosporin exposure days within the models as exposure to other classes of antibiotics was limited and not found to be significant between the SOC and DP arms.
We evaluated whether there was a dose-dependent relationship between the number of reported doxycycline doses taken since enrollment and changes in the resistome. We considered a prophylactic dose (doxycycline 200 mg one time) as a single dose. For patients receiving doxycycline for STI treatment (doxycycline 100 mg twice a day for 7 d), we considered a treatment day to be equivalent to a single prophylactic dose. The number of doxycycline doses was categorized as follows: 0 doses, 1–25 doses, 26–50 doses and ≥50 doses. These categories were chosen based on the distribution of the number of doxycycline dose exposures among the participants studied and in consideration of the median number of doxy-PEP doses (24 doses) taken over 6 months by the 339 DP arm participants in the DoxyPEP clinical trial2. Spearman’s ρ test of trend (cor.test) from the R package ‘stats’ (version 4.2.1) was performed across these ordinal doxycycline dose categories for tetracycline ARG richness and proportion of tetracycline ARG to the resistome mass. In addition, we evaluated the association between doxycycline dose exposure as a continuous variable with the two separate outcomes of tetracycline ARG richness and proportional tetracycline ARG mass using linear regression models for tetracycline ARG richness and inflated beta regression models for proportional tetracycline ARG mass.
A sub-analysis of paired samples was performed to evaluate the impact of doxy-PEP use on tetracycline ARG richness and tetracycline ARG proportion of the resistome mass. P values were calculated using the two-sided Wilcoxon signed-rank test for paired samples (wilcox_test, paired = TRUE) from the R package ‘rstatix’ (version 0.7.2). For all non-paired comparison tests, P values were obtained by the two-sided Wilcoxon rank-sum test (wilcox_test, paired = FALSE).
Microbiome analysis
To examine the effect of doxy-PEP use on the global microbiome taxonomic composition, we analyzed the normalized and transformed mass of the bacterial components of the microbiome. We also examined differences in diversity metrics of the microbiome between the two arms at both timepoints and between timepoints within arms. Bacterial alpha diversity was calculated using the Shannon diversity index, accounting for bacterial abundance (nucleotide reads per million (nt rpm)) and evenness. Bacterial beta diversity was calculated using Bray–Curtis dissimilarity in a similar manner to the resistome analysis, substituting bacterial abundance by nt rpm, with the R package ‘vegan’ (version 2.6.4)49. To examine microbiome changes at the genus level, we performed differential abundance analyses, adjusted for multiple comparisons, using a consensus approach of three differential abundance methods to ensure a robust biological interpretation. We used the R packages ‘DESeq2’ (version 1.36.0), ‘metagenomeSeq’ (version 1.40.0) and ‘ALDEx2’ (version 1.30.0). In the DESeq2 analysis, a pseudo-count (one read) was added to all taxa counts to address zero inflation of microbiome data. Specific species of interest, including common sexually transmitted organisms, were also analyzed for differential abundance between day 0 and month 6 in the DP arm using the two-sided Wilcoxon rank-sum test.
Microbiome and ARG correlation
To identify microbial taxa associated with tetracycline ARGs, Spearman’s correlation analyses were performed using the functions cor() and cor_pmat() from the R package ‘rstatix’ (version 0.7.2) on paired day-0 and month-6 samples from the DP arm. The correlation analyses were between the abundance (DNA-seq) or expression (RNA-seq) of tetracycline ARGs (dpm) and microbial taxa (rpm). Correlation analyses were adjusted for multiple comparisons. These analyses were performed at the genus level, comparing the 50 most abundant bacterial taxa in combination with tetracycline resistance genes. For correlations that were statistically significant at month 6 between tetracycline ARGs and bacterial taxa, we evaluated the change in the strength of correlations over time with doxy-PEP use by calculating the difference in the SCC from day 0 to month 6 (ΔSCC = SCCmonth6 − SCCday0).
All analyses were conducted in RStudio (version 2023.09.1+494) using R (version 4.2.1) and performed for both DNA-seq and RNA-seq data. All adjustments for multiple comparisons were by the Benjamini–Hochberg FDR method. Figures were made using the following R packages: ‘ggplot2’ (version 3.5.1) and ‘scales’ (version 1.3.0).
Reporting summary
Further information on research design is available in the Nature Portfolio Reporting Summary linked to this article.


留言 (0)