
記住我


We analyzed fecal metagenomics data from 4,406 samples from 13 IBD cohorts across eight countries and regions, to identify and validate gut microbial biomarkers for IBD diagnosis. Specifically, we utilized in-house sequencing data from Hong Kong as a discovery cohort (Supplementary Table 1) and included three additional independent in-house cohorts from Hong Kong and Australia, as well as nine public datasets from the United States, the Netherlands, mainland China, Spain, Denmark and the United Kingdom as validation cohorts (Supplementary Table 2).
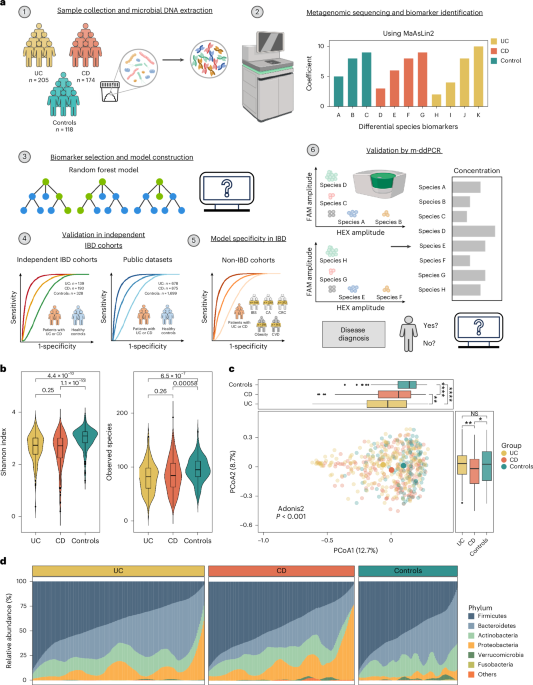
In the discovery cohort, we identified a total of 1,175 taxa (three kingdoms, 14 phyla, 25 classes, 40 orders, 85 families, 226 genera and 788 species). At the species level, we identified totals of 674, 637 and 506 bacterial species in UC, CD and control groups, respectively. We found decreased microbial diversity (median: UC 2.73, CD 2.71, controls 3.08; P < 0.001) and richness (median: UC 82, CD 86.5, controls 95; P < 0.001) in patients with UC and CD compared with controls, but there was no statistically significant difference between UC and CD (Fig. 1b). On principal coordinates analysis (PCoA) based on Bray–Curtis distances, the gut microbiome of patients with UC and CD clustered separately from that of controls, and patients with UC exhibited a greater distance from controls than those with CD (Fig. 1c). The presence of IBD accounted for 2.22% of microbiome variance (P < 0.001), while age and gender contributed 0.28% (P = 0.107) and 0.29% (P = 0.073), respectively (Extended Data Fig. 1). There were significant differences in gut microbial communities at the phylum level between patients with IBD and controls, characterized by a reduction in Firmicutes and an enrichment of Proteobacteria in IBD. Patients with CD had lower levels of Bacteroidetes compared with UC and controls (both P < 0.001; Fig. 1d and Extended Data Fig. 2). We found that patients with IBD harbored reduced microbial diversity compared with controls, and patients with CD and UC showed distinct differences in their gut microbial composition21,22.
Identification of gut microbiome signatures in UC and CDWe next used general linear models, as implemented in microbiome multivariable associations with linear models (MaAsLin2), to identify differentially abundant bacterial species in UC and CD after filtering out low-prevalence species (<10%), followed by adjustment for age and gender. We identified 126 and 161 species differentially abundant in UC and CD, respectively, compared with controls (false discovery rate (FDR) < 0.25). Amongst these, 15 species, including B. fragilis, Veillonella parvula, Tyzzerella nexilis, Clostridium spiroforme, Rothia mucilaginosa and Blautia hansenii, were enriched in UC (FDR ≤ 0.1, coefficient ≤ 0.1) whereas 48 species, including Collinsella aerofaciens, Clostridium leptum, R. torques, Asaccharobacter celatus, Gemmiger formicilis and Fusicatenibacter saccharivorans, were depleted in the gut of patients with UC (FDR < 0.05, coefficient ≤ −0.45; Fig. 2a). In CD, 58 bacterial species were either enriched or depleted compared with controls (FDR < 0.001 and |coefficient| ≥ 0.5). In particular, certain bacterial species with proposed anti-inflammatory properties, including Eubacterium hallii, Blautia obeum, R. inulinivorans and Eubacterium rectale, were depleted in CD (Fig. 2b). In addition, E. coli and some Streptococcus species were enriched in the gut of patients with CD but not UC. Taken together, these data highlighted the presence of disease-specific bacterial species in UC and CD.
Fig. 2: Differential bacterial species and dysbiosis of metabolic pathways in patients with UC and CD compared with controls.
a,b, Top bacterial species associated with UC (a) and CD (b). Left, lollipop plot showing the coefficient of each species, with disease calculated by MaAsLin2 including adjustment for age and gender. Middle, the phylum of each species is indicated. Right, bar plot demonstrating the proportion of each species present in UC, CD and control groups. c,d, Relative abundance of ten bacterial species biomarkers in UC (n = 205) and controls (n = 118) (c), and of nine bacterial species biomarkers in CD (n = 174) and controls (n = 118) (d) as determined by metagenomics. Data shown as median (center line), 25th and 75th percentiles (box limits) and 5th and 95th percentiles (whiskers). P values were calculated using two-sided Wilcoxon rank-sum test. e,f, Performance of model with ten UC and nine CD bacterial species biomarkers for classification of patients with UC (e) and CD (f) compaerd with controls in discovery cohort. Shaded areas of ROC curves represent the 95% CI of AUC for the test set. g, SHAP values of the ten UC bacterial species biomarkers for each sample. h, SHAP values of the nine CD bacterial species biomarkers for each sample. Each point represents the SHAP value of each biomarker for each sample; the distribution of points indicates the impact of each biomarker on model output. Colors represent relative abundance of the biomarkers (yellow, high; purple, low). i, Correlation between functional dysbiosis scores and probability of disease generated by models based on ten UC and nine CD bacterial species biomarkers. Shaded area corresponds to 95% CI for the regression fit. Correlation coefficient and two-sided P values are given by Spearman correlation. Coeff., coefficient; pos. pred., positive prediction; neg. pred., negative prediction.
Development of metagenomics-based diagnostic modelsWe next performed a fivefold cross-validation with all discriminative bacterial species to construct diagnostic models. We achieved stable classification performances by utilization of seven and eight bacterial features in UC and CD, respectively (Extended Data Fig. 3). After accounting for functional properties of selected bacteria and optimal distribution of enriched and depleted bacterial species, we selected ten bacterial species as biomarkers for UC (four enriched: Gemella morbillorum, B. hansenii, Actinomyces sp. oral taxon 181 and C. spiroforme; and six depleted: C. leptum, F. saccharivorans, G. formicilis, R. torques, Odoribacter splanchnicus and Bilophila wadsworthia); and nine bacterial species as biomarkers for CD (three enriched: B. fragilis, E. coli and Actinomyces sp. oral taxon 181; and six depleted: R. inulinivorans, B. obeum, Lawsonibacter asaccharolyticus, Roseburia intestinalis, Dorea formicigenerans and Eubacterium sp. CAG: 274) (Fig. 2c,d). Among these, Actinomyces sp. oral taxon 181 and C. spiroforme were first reported to be enriched in UC whereas Actinomyces sp. oral taxon 181, L. asaccharolyticus and Eubacterium sp. CAG: 274 were new bacterial species associated with CD. Using the random forest algorithm, the ten selected bacterial species discriminated patients with UC from controls, with an AUC of 0.95 (95% confidence interval (CI): 0.92–0.98) in the training set and 0.90 in the test set (95% CI: 0.84–0.96; sensitivity 88.06%, specificity 80.95%). F. saccharivorans, C. leptum and G. formicilis were the top three key discriminatory bacterial species in the UC model (Fig. 2e,g). In CD, nine bacterial species showed an AUC of 0.95 (95% CI: 0.92–0.98) and 0.94 (95% CI: 0.89–0.98; sensitivity 88.33%, specificity 89.47%) in discriminating CD from controls in the training and test set, respectively. B. obeum, L. asaccharolyticus, R. inulinivorans (depleted in CD), Actinomyces sp. oral taxon 181 and E. coli (enriched in CD) were the top-ranking bacteria in our model (Fig. 2f,h).
Alteration of metabolic pathways in IBDApart from altered microbial composition and taxonomy, we found that metabolic functions were dysregulated in both UC and CD. Using MaAsLin2 comparison analysis, we identified 545 metabolic pathways consisting of 244 and 315 differential pathways in UC and CD, respectively, compared with controls (FDR < 0.05). Pathways involved in amine and polyamine degradation, and in fatty acid and lipid biosynthesis, were significantly enriched in patients with UC or CD compared with controls23. UC- and CD-enriched bacterial species biomarkers were positively correlated with disease-enriched metabolic pathways, while UC- and CD-depleted bacterial species biomarkers showed negative correlations (Extended Data Fig. 4). New findings from stratified analyses revealed that pathways belonging to amino acid biosynthesis (l-arginine, l-ornithine and l-valine biosynthesis) were mainly contributed by bacterial species depleted in patients with UC, including C. leptum, F. saccharivorans, G. formicilis and R. torques. Depletion of these key bacterial species in UC was also associated with a significant decrease in the abundance of their respective functional pathways (Extended Data Fig. 5a). Similarly, bacterial species, including B. obeum, R. inulinivorans, D. formicigenerans, Eubacterium sp. CAG: 274 and R. intestinalis, also contributed to pathways of amino acid biosynthesis (l-tryptophan biosynthesis), carbohydrate degradation (starch degradation) and cofactor, carrier and vitamin biosynthesis (thiamine phosphate formation from purithiamine and exythiamine) in controls. In CD, there was a shift in the main contributors of these pathways characterized by a predominance of E. coli rather than a diversified bacterial profile (Extended Data Fig. 5b). Variations in bacterial metabolic pathways suggested that altered microbiota-mediated metabolic capabilities may be essential for IBD development.
To examine the role of bacterial biomarkers in mediation of metabolic functions, we developed a dysfunctional score for each subject by calculating median Bray–Curtis dissimilarity to controls using metabolic pathway profiles. Both the distribution and level of dysfunctional scores in patients with UC and CD were different from those of controls, implying dysfunctional changes in IBD (Extended Data Fig. 5c,d). The probability of disease determined by diagnostic models showed a positive correlation with dysfunctional scores in UC and CD, implying that our bacterial biomarkers could reflect the metabolic dysregulations in patients with IBD (Fig. 2i).
Performance of diagnostic models in active and inactive IBDWe next evaluated the accuracy and stability of our multibacteria biomarker panel in IBD with different disease activities. Using Mayo score and Crohn’s disease activity index (CDAI), we categorized patients into active (UC, Mayo >2; CD, CDAI >150) and inactive disease (UC, Mayo ≤2; CD, CDAI ≤150). There was differential abundance of CD- and UC-associated bacterial species in patients with inactive IBD compared with controls (six decreased, four increased in UC; six decreased, three increased in CD). Moreover, levels of some bacterial species changed with disease activity. For instance, the relative abundance of six UC-depleted species was lower in patients with active compared with inactive UC, and R. inulinivorans, B. obeum, L. asaccharolyticus, D. formicigenerans and Eubacterium sp. CAG: 274 were lower in patients with active compared with inactive CD, whereas some disease-enriched bacteria, such as G. morbillorum, were higher in active UC, and B. fragilis, E. coli and Actinomyces sp. oral taxon 181 were higher in active CD, implying that these bacterial species may be involved in disease activity and severity (Extended Data Fig. 6a,b). We next utilized diagnostic models to calculate a probability value for disease risk, and found that disease probability showed no significant difference between inactive and active IBD (Extended Data Fig. 6c,e). Our model was able to distinguish patients with inactive UC and CD from controls, with AUC of 0.89 and 0.84, respectively (Extended Data Fig. 6d,f). These data suggested that bacterial biomarkers may not just be a consequence of inflammation but also contribute to—or possibly reflect—underlying disease pathogenesis.
Validation of diagnostic models in independent cohortsNext, we analyzed two independent datasets from Hong Kong (139 UC, 139 controls; 92 CD, 108 controls) and Australia (98 CD, 81 controls) and three public datasets from the United States (53 UC, 68 CD, 34 controls), the Netherlands (23 UC, 20 CD, 22 controls) and mainland China (25 UC, 15 controls; 48 CD, 54 controls). Both the abundance and prevalence of bacterial biomarkers in the independent cohorts and public datasets were consistent with those reported in the discovery cohort (Extended Data Fig. 7a,b). Specifically, our diagnostic models showed satisfactory performances in classifying IBD from controls, with AUCs of 0.81 (95% CI: 0.76–0.86) for UC (Fig. 3a) and 0.83 (95% CI: 0.77–0.89) for CD in the Hong Kong cohorts (Fig. 3b) and 0.73 (95% CI: 0.65–0.80) for CD in the Australian cohort (Fig. 3c). Using datasets from United States, the Netherlands and mainland China, the diagnostic model achieved AUCs of 0.85, 0.87 and 0.82, respectively, for UC diagnosis (Fig. 3d and Extended Data Fig. 7c), and AUCs of 0.89, 0.86 and 0.97, respectively, for CD diagnosis (Fig. 3e and Extended Data Fig. 7c). Bacteria ecological network analysis showed co-occurring correlations between depleted bacterial species in IBD, and stable coexcluding correlations among disease-depleted and -enriched species in almost all cohorts (Extended Data Fig. 7d,e). To further validate our models, we utilized additional metagenomic datasets from the United States, the Netherlands, Spain, Denmark and the United Kingdom (577 UC, 739 CD, 1,574 controls). By integration of data from all IBD cohorts and adjusting for geography and ethnicity, the multibacteria biomarker panel remained significantly different between IBD and controls (Fig. 3f,g). The UC model maintained an overall AUC of 0.82, and the CD model achieved an AUC of 0.76, in all validation cohorts (Fig. 3h,i). Taken together, these results highlighted the robustness of diagnostic performance of our multibacteria biomarker panel across different regions and ethnicities.
Fig. 3: Performance of model with bacterial species biomarkers in discrimination of patients with UC or CD from controls in independent cohorts and public datasets.
a, Performance of model with ten UC selected bacterial species biomarkers for classification of patients with UC versus controls in Hong Kong validation cohort. b,c, Performance of model with nine CD selected bacterial species biomarkers for classification of patints with CD versus controls in Hong Kong (b) and Australia validation cohorts (c). d,e, Performance of model with the selected bacterial species biomarkers for classification of patients with UC (d) or CD (e) versus controls in the three downloaded public datasets. f, Associations among disease group, geography, ethnicity and the relative abundance of ten UC bacterial species biomarkers were calculated by MaAsLin2 in cohorts with UC patients and controls. g, Associations among disease group, geography, ethnicity and the relative abundance of the nine CD bacterial species biomarkers were calculated by MaAsLin2 in cohorts with CD patients and controls. Positive and negative associations are colored red and blue, respectively. Significant associations (FDR < 0.05) are marked with a plus sign for positive associations and a minus for negative associations. FDR was computed by Benjamini–Hochberg correction. h, Performance of model with the selected bacterial species biomarkers for classification of patients with UC (n = 817) versus controls (n = 1,746) in all UC validation cohorts. i, Performance of model with the selected bacterial species biomarkers for classification of patients with CD (n = 1,065) versus controls (n = 1,873) in all CD validation cohorts. j, Model performance in distinguishing treated and treatment-naive patients with UC from controls in two downloaded public datasets. k, Model performance in distinguishing treated and treatment-naive patients with CD from controls in two downloaded public datasets. l, Model performance in distinguishing patients with UC from controls, compared using fecal calprotectin test in two downloaded public datasets. m, Model performance in distinguishing patients with CD from controls, compared using fecal calprotectin test in two downloaded public datasets. Shaded areas of ROC curves represent 95% CI of the AUC for each cohort.
Given that the drugs used to induce and maintain disease remission in IBD can alter the gut microbiome, we tested whether our models would be affected by treatment. Using metagenomic data from two public datasets (United States and the Netherlands)21 whereby treatment data were available for IBD cases, the UC model could discriminate treatment-naive (n = 14) and treated-UC patients (n = 62) from controls (n = 56), with AUCs of 0.74 and 0.89, respectively, while the CD model discriminated treatment-naive (n = 20) and treated-CD patients (n = 66) from controls (n = 56), with AUCs of 0.89 and 0.88, respectively, suggesting that the performance of the multibacteria biomarker panel is unlikely to be influenced by treatment (Fig. 3j,k).
For comparison of our models with a commonly used IBD screening test, fecal calprotectin, we utilized data from two public datasets (United States and the Netherlands)21 for which fecal calprotectin data were available (46 UC, 65 CD, 42 controls). Our diagnostic models had a numerically higher AUC than fecal calprotectin in the diagnosis of UC (AUC = 0.85 versus 0.81) and CD (AUC = 0.87 versus 0.79) (Fig. 3l,m). The multibacteria biomarker panel also showed a higher sensitivity (72 versus 54% for CD, 67 versus 57% for UC) and specificity (95 versus 86% for CD, 88 versus 86% for UC) than fecal calprotectin.
IBD specificity of diagnostic models in transethnic cohortsIn light of shared microbiota alterations across various diseases24, it is important to verify disease specificity for bacterial biomarkers. Hence, we assessed several in-house non-IBD disease metagenomic datasets from Hong Kong comprising subjects with various GI diseases (n = 439), including colorectal cancer (CRC, n = 160), colorectal adenoma (CA, n = 162), irritable bowel syndrome (IBS, diarrhea subtype, IBS-D, n = 117) and non-GI diseases (n = 291): obesity (n = 148) and cardiovascular disease (CVD, n = 143). Among UC bacterial biomarkers, depletion in R. torques and enrichment in C. spiroforme were unique to patients with UC compared with all other non-IBD diseases (Extended Data Fig. 8a). Among CD bacterial biomarkers, depletion of R. inulinivorans and B. obeum and an increase for B. fragilis and E. coli were specifically associated with CD (Extended Data Fig. 8b). To validate our models in an internationally diverse non-IBD cohort, we included 843 extra metagenomic data from non-IBD cohorts (212 CRC, 68 CA, 29 IBS-D, 170 obesity and 364 controls) from Austria, France, Germany, Japan, the United States and Denmark (Fig. 4a). The probability of disease generated by our models showed significant differences between IBD and non-IBD subjects (Fig. 4b,d). The UC diagnostic model discriminated patients with UC from non-IBD subjects with an AUC of 0.78 (Fig. 4c), whereas the CD diagnostic model distinguished CD from non-IBD subjects with an AUC of 0.72 (Fig. 4e). Overall, these results suggested that our multibacteria panel is specific to UC and CD.
Fig. 4: Performance of model with bacterial species biomarkers in discrimination of patients with UC or CD from other subjects with and without GI disorders in international cohorts.
a, Composition of international multidisease datasets from different countries and regions. b, Comparison of the probability of disease generated by the UC model based on ten UC bacterial species biomarkers in controls (n = 2,391) and in patients with CVD (n = 143), obesity (n = 318), CA (n = 230), CRC (n = 372), IBS-D (n = 146) and UC (n = 817). Data in boxplots show the median (center line), 25th and 75th percentiles (box limits) and 5th and 95th percentiles (whiskers). c, Performance of UC model in classification of patients with UC (n = 817) versus other non-IBD subjects (n = 3,600). d, Comparison of the probability of disease generated by the CD model based on nine CD bacterial species biomarkers in controls (n = 2,391) and in patients with CVD (n = 143), obesity (n = 318), CA (n = 230), CRC (n = 372), IBS-D (n = 146) and CD (n = 1,065). Data in boxplots show the median (center line), 25th and 75th percentiles (box limits) and 5th and 95th percentiles (whiskers). e, Performance of CD model in classification of patients with CD (n = 1,065) versus other non-IBD subjects (n = 3,600). Boxplots represent the minimum (Q1), median (Q3) and maximum. P values were calculated using the two-sided Wilcoxon rank-sum test. Shaded areas of ROC curves represent 95% CI of the AUC for each cohort.
Development of a general IBD modelBecause there is an unmet need for universal biomarkers to differentiate IBD from non-IBD subjects, we developed an IBD model using a total of 18 bacterial species identified for UC and CD (UC, ten species; CD, nine species; one species overlapping in both UC and CD). The discriminative power of the IBD model achieved an AUC of 0.91 (95% CI: 0.85–0.97) with a sensitivity of 92% and specificity of 75% in the discovery cohort, and an AUC of 0.81 (95% CI: 0.80–0.82) with a sensitivity of 78% and specificity of 70% in the validation cohort (controls, n = 2,027; IBD, n = 1,882). In the international multidisease cohort (IBD, n = 1,882; non-IBD, n = 3,600), which included subjects with both GI and non-GI diseases, our model could differentiate IBD from non-IBD with an AUC of 0.77 (95% CI: 0.75–0.78) (Extended Data Fig. 9a,b). In a pilot cohort, we performed direct comparison of our multibacteria biomarker panel with fecal calprotectin in samples from the above-mentioned in-house cohorts (36 patients with UC, 36 with CD and 36 with IBS). Our multibacteria biomarker panel (AUC = 0.91; sensitivity, 79%; specificity, 92%) showed numerically higher performance than fecal calprotectin (AUC = 0.86; sensitivity, 68%; specificity, 89%) in distinguishing patients with IBD from those with IBS (Extended Data Fig. 9c).
Development of m-ddPCR-based multibacteria biomarker panelTo translate the metagenome-derived multibacteria biomarker panel into a simple and affordable clinical tool, we developed a m-ddPCR-based method to quantify selected bacterial species in fecal samples. Three reactions were designed to measure the abundance of bacterial species and to ensure there was no cross-reaction among the primers and probes of targeted species (Fig. 5a). We quantified the abundance of bacterial species by m-ddPCR and correlated this with with the abundance of species generated from metagenomics in UC (205 UC, 84 controls) and CD (172 CD, 86 controls). Quantification by metagenomic sequencing and m-ddPCR showed strong correlations (Spearman r = 0.34–0.73 for UC biomarkers and 0.49–0.94 for CD biomarkers), suggesting that both measurements are reliable and consistent (Fig. 5b,c). From m-ddPCR results, we identified significant differences in the six depleted bacterial species and one enriched bacterial species in UC compared with controls, while the other three enriched bacterial species showed increasing trends in patients with UC compared with controls (Fig. 6a). The random forest diagnostic model constructed using m-ddPCR data yielded an AUC of 0.88 (sensitivity, 85.0%; specificity, 81.8%) for UC diagnosis in the discovery cohort (Fig. 6b). In CD, we also identified significant differences in the abundance of six depleted and three enriched bacterial species in CD compared with controls (Fig. 6c). Using m-ddPCR data from the multibacteria biomarker panel, we constructed a random forest diagnostic model that showed an AUC of 0.87 for CD (sensitivity, 90.2%; specificity, 76.0%) (Fig. 6d). Furthermore, the UC model achieved an AUC of 0.89 (Fig. 6b) while the CD model achieved AUCs of 0.75 and 0.73 (Fig. 6d) in the independent validation cohorts. We compared the probability of disease values derived from the metagenomic model and m-ddPCR model and found that differences in values between the two models were −0.03 (95% CI: −0.05 to −0.01) in UC and −0.07 (95% CI: −0.08 to −0.05) in CD (Extended Data Fig. 10), indicating that the findings from m-ddPCR were consistent with those derived from metagenomics.
Fig. 5: Panel design of m-ddPCR and correlation between the abundance of bacterial species biomarkers determined by metagenomics and m-ddPCR.
a, Panel design of m-ddPCR for UC and CD bacterial species biomarkers. b,c, Correlation between the abundance of ten UC (b) and nine CD bacterial species biomarkers (c), as determined by metagenomics and m-ddPCR. Shaded areas correspond to 95% CI for the regression fit. The correlation coefficient and two-sided P value are given by Spearman correlation.
Fig. 6: Bacterial species biomarkers in patients and controls as determined by m-ddPCR.
a, Relative abundance of ten bacterial species biomarkers in UC and controls in the discovery cohort (205 UC, 84 controls). b, Diagnostic performance of UC model with ten bacterial species biomarkers, as determined by m-ddPCR in the discovery cohort (test set, n = 62) and the Hong Kong (HK) cohort (n = 108). c, Relative abundance of nine bacterial species biomarkers in CD and control groups in the discovery cohort (172 CD; 86 controls). Gray diamonds represent mean values. d, Diagnostic performance of CD model with nine bacterial species biomarkers, as determined by m-ddPCR in the discovery cohort (test set, n = 66), the Hong Kong cohort (n = 153) and Australia (AUS) cohort (n = 177). e, Diagnostic performance of fecal calprotectin and UC model with ten bacterial species biomarkers, as determined by m-ddPCR in the Canada cohort (left; 100 UC, 53 Controls) and Taiwan cohort (right; 40 UC, 40 controls). f, Diagnostic performance of fecal calprotectin and CD model with ten bacterial species biomarkers, as determined by m-ddPCR in the Canada cohort (left; 100 CD, 53 controls) and Taiwan cohort (right; 40 CD, 40 controls). g, Comparison of the probability of disease (POD), calculated by the UC/CD model using m-ddPCR data and fecal calprotectin, between patients with inactive or active UC/CD and controls in the Canada and Taiwan cohorts. h, Diagnostic performance of fecal calprotectin and the UC model with ten bacterial species biomarkers determined by m-ddPCR in distinguishing patients with inactive UC (n = 81) and controls (n = 93). Shaded areas of ROC curves represent 95% CI of the AUC for each cohort. Data in boxplots show the median (center line), 25th and 75th percentiles (box limits) and 5th and 95th percentiles (whiskers). P values were calculated using the two-sided Wilcoxon rank-sum test.
Comparison between m-ddPCR panel and fecal calprotectinFor comparison of the diagnostic performance of our multibacteria biomarker panel with that of fecal calprotectin, we performed both tests on fecal samples from two independent cohorts from Canada (100 UC, 100 CD, 53 controls) and Taiwan (40 UC, 40 CD, 40 controls), with analysis blinded relative to each test. The multibacteria biomarker panel showed better performance than that of fecal calprotectin in UC (Fig. 6e; Canada, AUC = 0.74 versus 0.63; Taiwan, 0.79 versus 0.57), and performed slightly better than, or was comparable to, fecal calprotectin in the CD model (Fig. 6f; Canada, AUC = 0.77 versus 0.75; Taiwan, 0.71 versus 0.71). In the subgroup analysis, the CD multibacteria biomarker panel could differentiate patients with active and inactive CD from controls. In addition, the UC multibacteria biomarker panel showed higher performance than fecal calprotectin in discriminating inactive UC from controls (AUC = 0.78 versus 0.56) (Fig. 6g,h).
留言 (0)