
記住我


The agreement between the two radiologists regarding AAA growth classification was excellent (Cohen’s kappa coefficient, 0.97; 95% CI: 0.75–1.19; p < 0.001).
Enrolment of participantsWe conducted sample size estimation during the pre-experiment phase with a significance level (α) of 0.05 (two-tailed) and power (1-β) of 0.90. Consequently, a sample size of 78 patients was obtained. Between March 2014 and March 2024, 352 consecutive patients underwent endovascular repair for AAAs and regular postoperative follow-up enhanced CT. Ultimately, 79 patients were included in this study. Table 1 summarises the detailed demographic and clinical characteristics.
Table 1 Demographic and clinical characteristics of participantsUnivariate analysis among non-growing and growing AAA after EVARTable 1 presents the statistical data on the clinical characteristics of patients with growing or non-growing AAA after EVAR. LDL (2.46 vs 3.03, p = 0.01), HDL (0.93 vs 1.08, p = 0.02), and TC (4.10 vs 4.87, p = 0.02) showed significant differences between the growing or non-growing AAA groups, whereas no significant differences were found in the remaining clinical parameters.
Table 2 summarises the statistical data of the radiomics features of the PVAT surrounding growing or non-growing AAAs after EVAR. It comprises 1 shape feature and 13 texture features, including GLCM, GLDM, and GLRLM features. Significant differences between the two groups were observed, including surface area-to-volume ratio (0.63 vs 0.70, p = 0.04), correlation (0.53 vs 0.50, p = 0.04), an informational measure of correlation 1 (0.14 vs 0.13, p = 0.03), Inverse variance (0.46 vs 0.47, p = 0.04), maximal correlation coefficient (0.63 vs 0.57, p = 0.04), Maximum probability (0.22 vs 0.20, p = 0.03), dependence non-uniformity normalised (0.05 vs 0.06, p = 0.02), Dependence variance (29.88 vs 26.96, p = 0.01), large dependence emphasis (141.17 vs 124.55, p = 0.02), long-run emphasis (4.76 vs 4.20, p = 0.01), run length non-uniformity normalised (0.50 vs 0.52, p = 0.01), run percentage (0.64 vs 0.66, p = 0.01), run variance (1.80 vs 1.50, p = 0.01), and short-run emphasis (0.72 vs 0.74, p = 0.04). Regarding histogram features, we did not find any evidence of differences between the two groups. Regarding texture features, including GLRLM, GLSZM, and NGTDM features, we also did not find statistically significant results. Table 2 shows the detailed results.
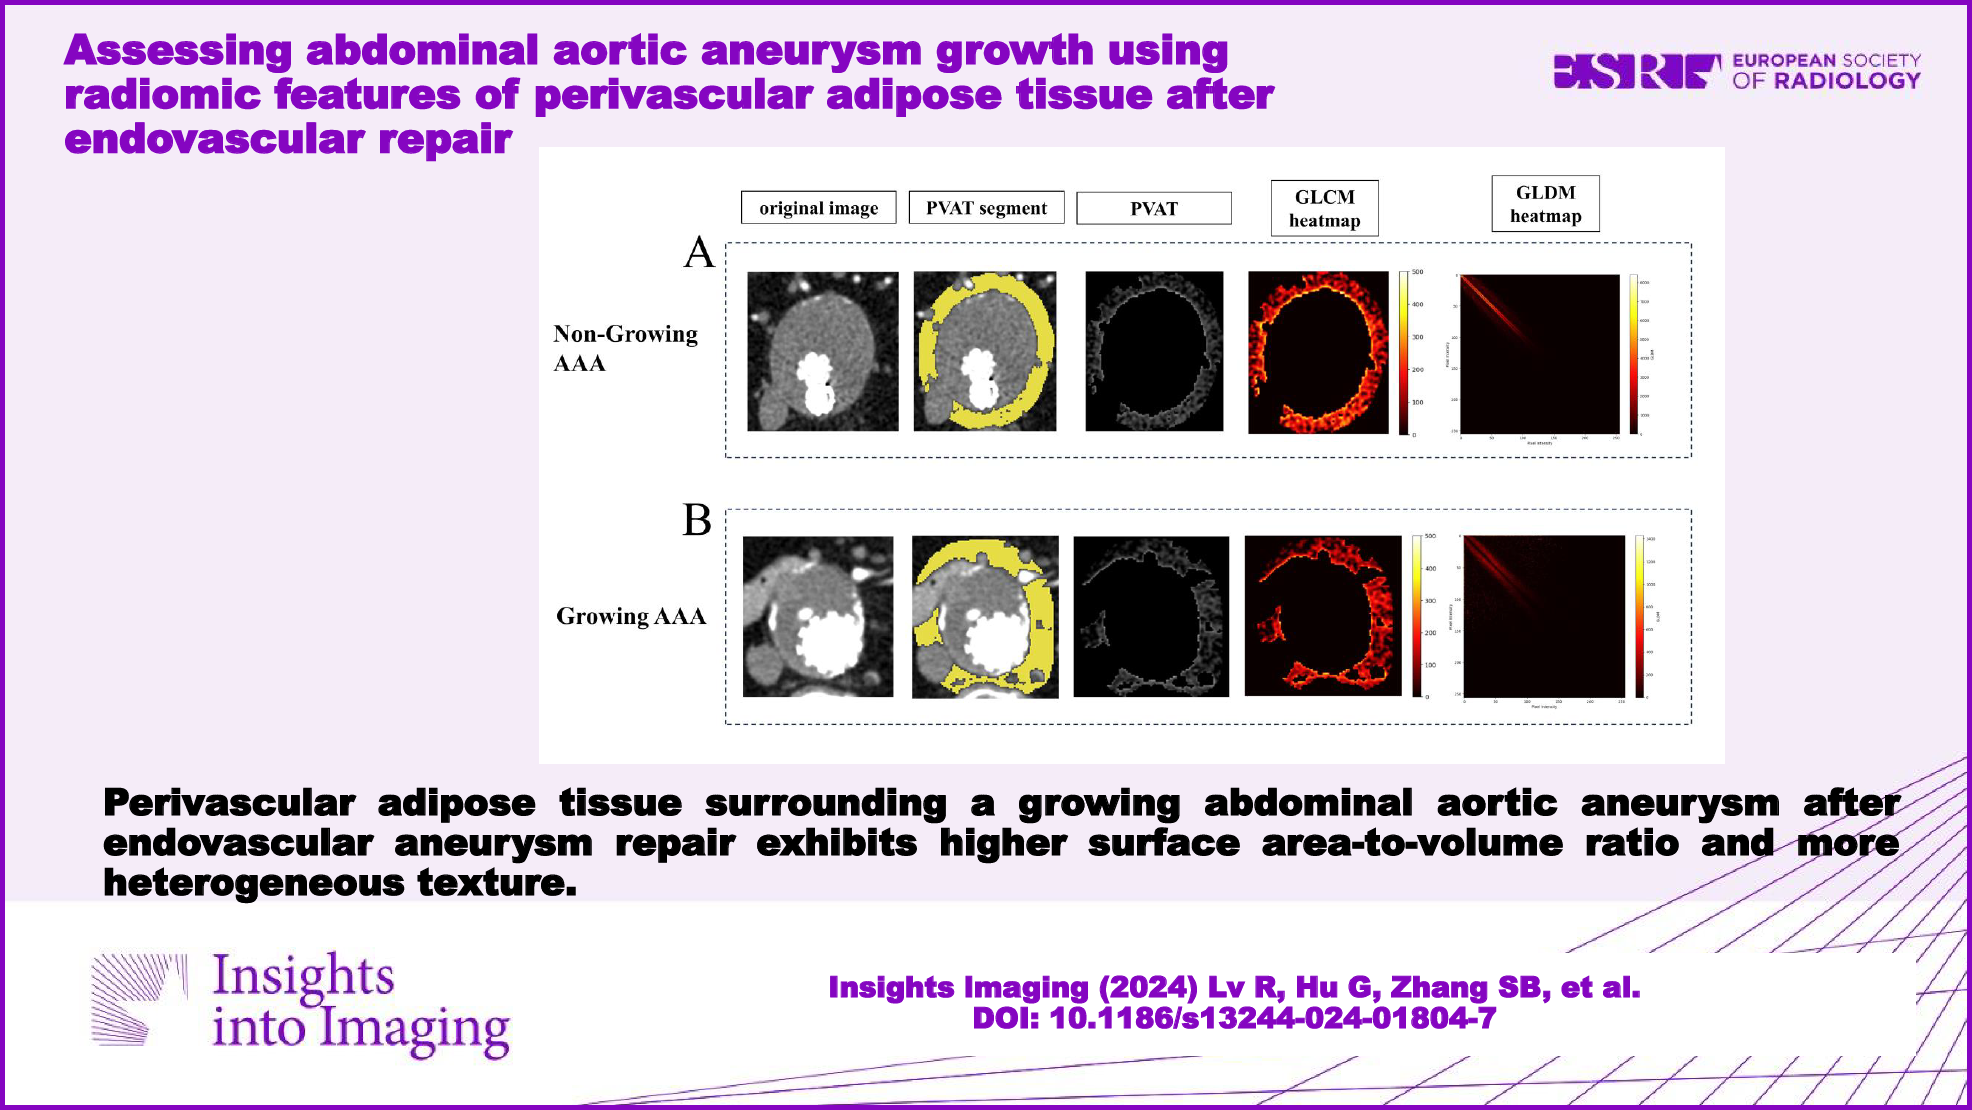
Table 2 Univariate analysis of radiomics features of PVAT among non-growing and growing AAAFigure 3 illustrates two examples of the texture of PVAT surrounding growing or non-growing AAAs. Comparing the GLCM texture heatmaps of PVAT, growing AAAs exhibited darker regions with lower GLCM values, whereas non-growing AAAs exhibited brighter regions with higher GLCM values. The GLDM texture heatmaps showed that growing AAAs exhibited patterns farther from the diagonal lines. In Fig. 3, differences in the texture of PVAT were visually observed between the two groups.
Fig. 3
The visualisation of texture features. A A 68-year-old male in the non-growing AAA group. The first image in the top row displays the arterial phase enhanced CT slice of the maximum axial plane of the AAA. The second image from the top represents the manual segmentation of PVAT conducted by radiologists. The third image depicts the extracted PVAT. The fourth and fifth images display the heatmaps of the GLCM and GLDM, respectively. B A 74-year-old male in the growing AAA group. The image of (B) represents the same meaning as (A). AAA, abdominal aortic aneurysm; PVAT, perivascular adipose tissue; GLCM, grey level co-occurrence matrix; GLDM, grey level dependence matrix
Binary logistic regression analysis among non-growing and growing AAA after EVARAmong the 79 patients, 19 (24%) had non-growing AAA. The variables included in the binary logistic regression model were determined using univariate analysis (p = 0.05). The dependence variances of PVAT and TC were included in the binary logistic regression model.
The ORs for these two features are 0.84 (95% CI: 0.72–0.98, p = 0.03) and 2.24 (95% CI 1.20–4.17, p = 0.01), respectively. The AUC of this model was 0.78 (95% CI: 0.65–0.91, p < 0.01), with a sensitivity of 68% and specificity of 87%. Additionally, by comparing the model combining radiomic and clinical features with models using only radiomic features or clinical features separately, their AUCs were 0.69 (95% CI: 0.55–0.83, p = 0.02) and 0.69 (95% CI: 0.54–0.84, p = 0.02), respectively. Table 3 lists the evaluation indices of the three models. All three models showed statistical significance (Omnibus test, p < 0.01) and had good goodness-of-fit (Hosmer–Lemeshow test, p > 0.05). We found that the clinico-radiological integrated model outperformed the individual models. Figure 4 shows the ROC curves of the three models.
Table 3 Evaluation of logistic regression model for AAA growthFig. 4
ROC curves of radiomic signature in predicting AAA growth classification in different models. A Clinico-radiological integrated model. B Radiomic model. C Clinical model. AAA, abdominal aortic aneurysm; AUC, area under the curve
留言 (0)