
記住我


The mean age of the included patients was 57.63 years, with a higher predominance for men over women (68.4% vs 31.6%, respectively). HCV was the most common cause of liver disease (63.2%). Other aetiologies included bilharziasis, and autoimmune liver disease. Four cases out of the 38 (10.5%) had HCC. Via endoscopy, oesophageal varices were detected in 30 cases (78.9%), whereas the remaining cases had gastric varices. Risky varices were encountered in 12 cases (31.6%). In patients with oesophageal varices, grade I, II, and III were detected in 66.7%, 20%, and 13.3% of cases, respectively. Liver and spleen sizes had mean values of 16.69 cm and 13.09 cm, respectively. The mean diameter of the main PV was 10.85 mm. Regarding collaterals detected on MRI examination, most cases (42.11%) had no collaterals. The splenic hilar collaterals were the most collaterals among our patients (26.32%). Patients’ demographics, and endoscopic and MRI data were summarized in supplementary Table S1.
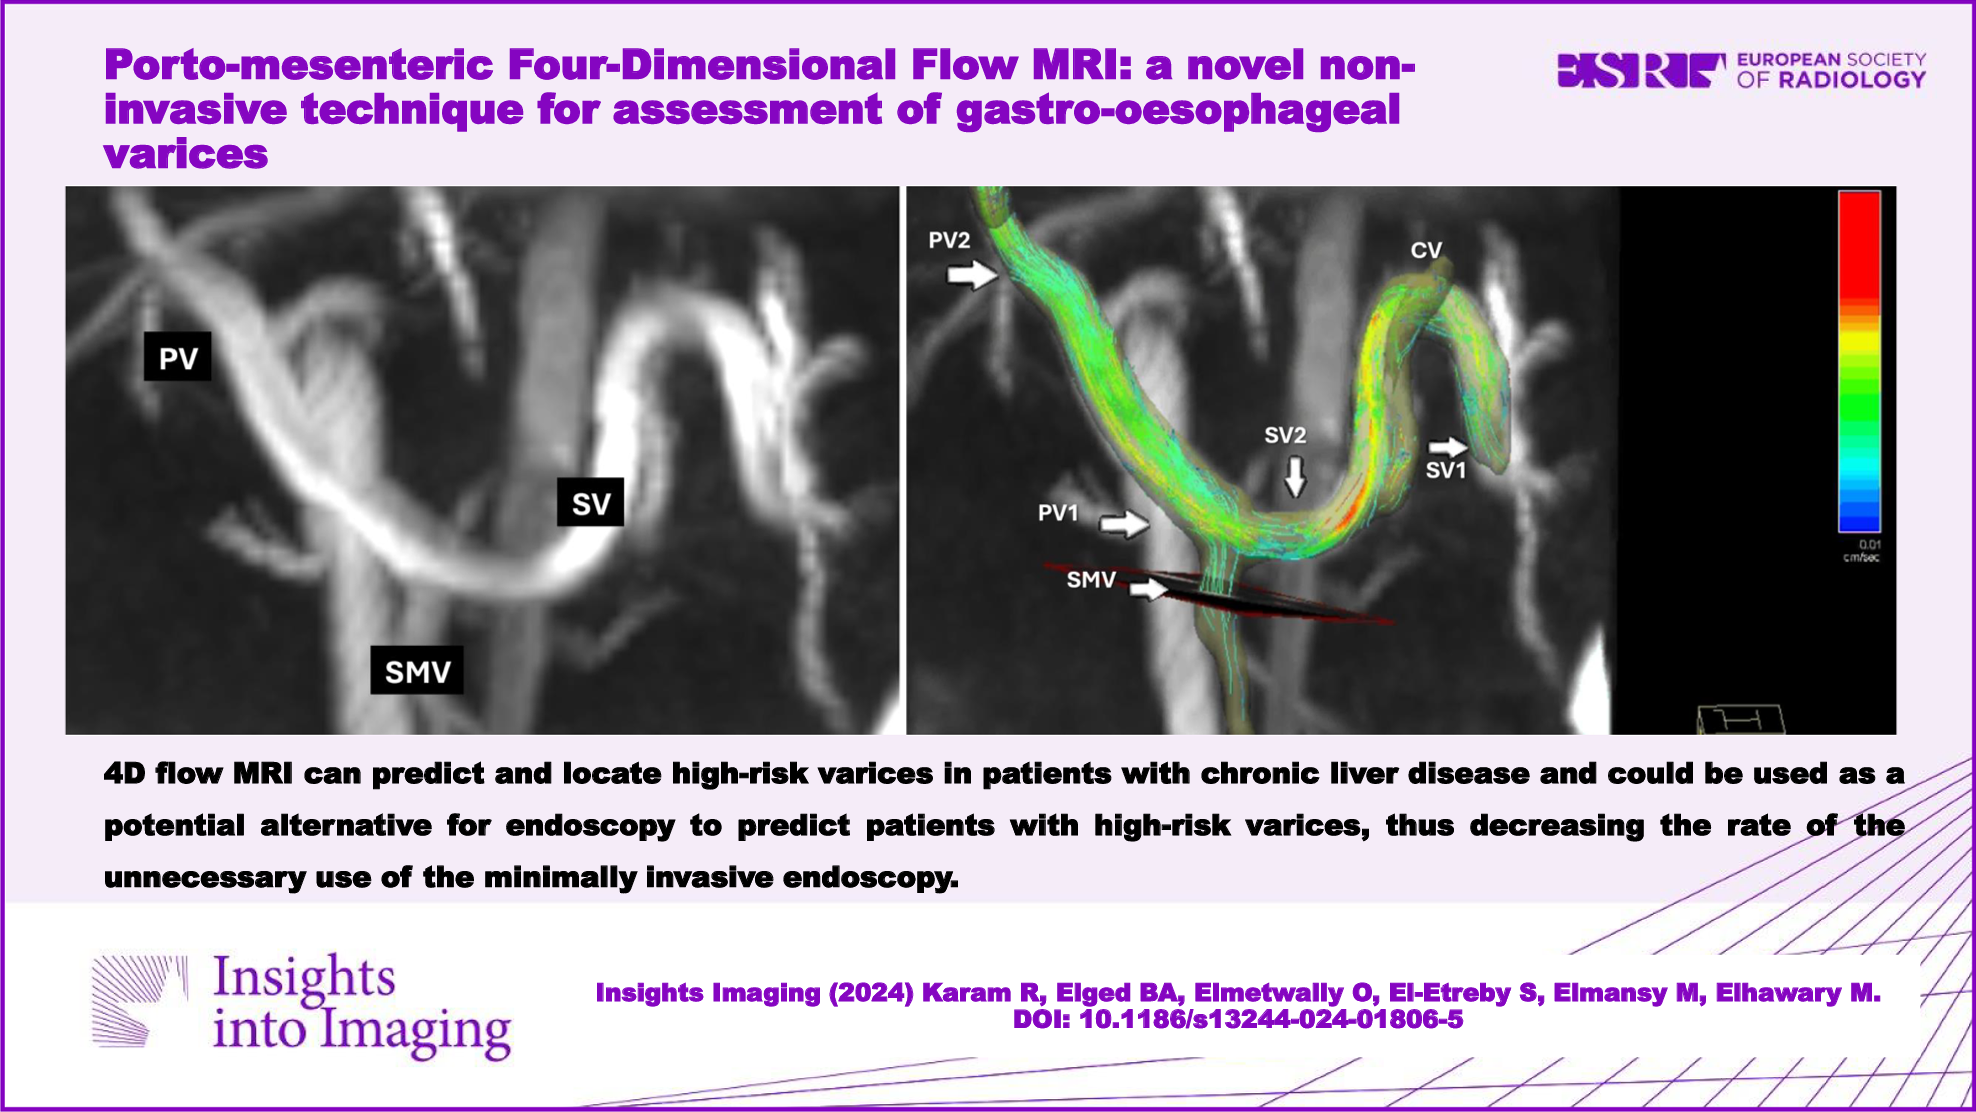
As shown in Table 1, on comparison between patients with oesophageal vs gastric varices, we noted a significant increase in splenic size, as well as an increase in the prevalence of collaterals in patients with gastric varices (p = 0.037 and < 0.001, respectively). Most of the measured flow, velocity, and fractional change parameters did not show notable statistical differences between the two groups, apart from four measurements, which increased significantly in patients with oesophageal compared to gastric varices. These significant parameters included SV1 average flow (0.4 vs 0.14 L/min, respectively, p = 0.022), SV2 average flow (0.29 vs 0.08 L/min, respectively, p < 0.001), SV2 peak flow (0.41 vs 0.11 L/min, respectively, p < 0.001), and SV2 peak velocity (14.77 vs 8.55 cm/s, respectively, p = 0.001).
Table 1 Comparison between patients with oesophageal vs gastric varicesPatients with grades II and III had a higher prevalence of collaterals compared to grade I patients (p = 0.003). Patients with higher variceal grades had significantly lower PV2 average flow (p = 0.018), PV2 peak flow (p = 0.049), PV fractional average flow change (p = 0.001), and PV fractional peak flow change (p < 0.001). In contrast, the same patients expressed significantly higher PV1 average flow (p = 0.022), SMV peak flow (p = 0.038), and SV2 peak velocity (p = 0.047) compared to grade I cases. Table 2 illustrates the previous data.
Table 2 Comparison between the three grades of oesophageal varicesOesophageal variceal grade had a significant positive correlation with PV1 average flow (r = 0.362, p = 0.049), SMV peak flow (r = 0.459, p = 0.011), and SV2 peak velocity (r = 0.454, p = 0.012), whereas it had a significant negative correlation with PV2 average flow (r = −0.522, p = 0.003), PV2 peak flow (r = 0.431, p = 0.017), PV fractional average flow change (r = −0.67, p < 0.001), and PV fractional peak flow change (r = −0.73, p < 0.001) (not expressed in the tables) (Fig. 2 and supplementary Table S2).
Fig. 2
Correlation between oesophageal grade and A PV1 average flow, B PV2 average flow, C PV2 peak flow, D SMV peak flow, E SV2 peak velocity, F PV fractional average flow, and G PV fractional peak flow
As expressed in Table 3, patients with risky varices had larger liver sizes (p = 0.009) and a higher prevalence of venous collaterals (p = 0.002). Patients with risky varices had higher SV2 peak velocity compared to non-risky cases. On the other hand, the high-risk cases expressed significantly lower PV2 average flow, PV2 peak flow, PV fractional average flow change, and PV fractional peak flow change compared to non-risky ones. There was no significant difference between patients with risky varices and those with non-risky ones regarding PV, SV, SMV, or CV diameter.
Table 3 Comparison between risky and non-risky varicesROC curve analysis revealed the following findings for the prediction of risky varices (Fig. 3):
PV2 average flow had sensitivity and specificity of 100% and 76.9%, respectively, when a cut-off value of < 0.417 L/min was applied (accuracy = 84.6%, area under the curve (AUC) = 0.808, p = 0.003).
PV2 peak flow had an 83.3% sensitivity and 61.4% specificity, with an accuracy of 78.6% (cut-off value < 0.471 L/min, AUC = 0.731, p = 0.024).
Using a cut-off value of > 14.71 cm/s, SV2 velocity had a sensitivity and specificity of 83.3% and 76.9%, respectively, with an accuracy of 81.2% (AUC = 0.756, p = 0.012).
PV fractional average flow change has a 100% sensitivity and an 84.6% specificity when a cut-off value of < − 0.210 was applied (accuracy = 89.2%, AUC = 0.910, p < 0.001).
PV fractional peak flow change had an 83.3% sensitivity and 92.3% specificity when we used a cut-off value of < − 0.348 (accuracy = 87.1%, AUC = 0.936, p < 0.001).
Fig. 3
ROC analysis for PV2 average flow (A), PV2 peak flow (B), SV2 peak velocity (C), PV Fractional average change (D), and PV Fractional peak flow change (E) in the prediction of risk varices
These data are expressed in the Supplementary Table S3.
Univariate regression analysis revealed that enlarged liver size, lower P2 average flow, lower P2 peak flow, lower PV fractional average flow change, and lower PV fractional peak flow change were significant risk factors for high-risk varices. Nonetheless, only the last two parameters maintained their significance in the multivariate analysis (Table 4).
Table 4 Regression analysis for prediction of risky varicesValidation of the 4D flow measurements was done in this study by comparing the flow results at the five anatomical points derived from the 4D flow MRI with those derived from Doppler US in 7 patients among the 38 ones enroled in this study. Regarding agreement between the 4D flow MRI results and Doppler US results, we found good reliability for the PV1 average flow (ICC = 0.843, 95% CI = 0.085–0.973, p value = 0.020), good reliability for PV2 average flow (ICC = 0.870, 95% CI = 0.423–0.976, p value = 0.002), excellent reliability for SV1 average flow (ICC = 0.974, 95% CI = 0.850–0.996, p value < 0.001), moderate reliability for SV2 average flow (ICC = 0.552, 95% CI = 0.160–0.923, p value = 0.17) and good reliability for SMV average flow (ICC = 0.890, 95% CI = 0.493–0.980, p value = 0.002). In addition, we validated the 4D flow measurements indirectly depending on the concept of continuity (conversion of mass). Comparison of the average flow in PV2 and the summation of the average flow in SV2 and SMV revealed good reliability (ICC = 0.842, 95% CI = 0.564–0.943, p value < 0.001).
Interobserver agreement between the two radiologist (reader 1 and reader 2) who interpreted the 4D flow MRI revealed good reliability for the PV1 average flow (ICC = 0.771, 95% CI = 0.350–0.933, p value = 0.002), excellent reliability for PV1 peak velocity (ICC = 0.947, 95% CI = 0.802–0.986, p value < 0.001), good reliability for PV2 average flow (ICC = 0.873, 95% CI = 0.360–0.934, p value = 0.002), excellent reliability for PV2 peak velocity (ICC = 0.983, 95% CI = 0.938–0.995, p value < 0.001), good reliability for SV1 average flow (ICC = 0.797, 95% CI = 0.246–0.945, p value = 0.009), good reliability for SV1 peak velocity (ICC = 0.811, 95 % CI = 0.530–0.921, p value < 0.001), moderate reliability for SV2 average flow (ICC = 0.679, 95% CI = 0.169–0.902, p value = 0.008), good reliability for SV2 peak velocity (ICC = 0.884, 95% CI = 0.626–0.967, p value < 0.001), good reliability for SMV average flow (ICC = 0.781, 95% CI = 0.373–0.936, p value = 0.001) and excellent reliability for SMV velocity (ICC = 0.989, 95% CI = 0.959–0.957, p value < 0.001).
留言 (0)