Cell culture
Immortalized human mast cell line (LUVA) was purchased from Applied Biological Materials (ABM). Cells were maintained in StemPro-34 SFM (ThermoFisher Scientific, 10639011) supplemented with 2mM of L-glutamine, 10,000 U/ml of Penicillin-Streptomycin, and 50 mg of Primocin (InvivoGen, ant-pm-05). Cells were maintained in a 37 °C/5% CO2 humidified chamber. LUVA cells were treated with 100 μm of carboplatin (Santa Cruz Biotechnology, CAS 4157.5-94-4) and 10nM of paclitaxel (NIH Developmental Therapeutics Drug Cancer panel), with DMSO (Sigma Aldrich, D54879) used as a corresponding control. All treatments were for 48-hours. Cell viability analysis was performed to ensure that the chemotherapy treatment did not lead to a significant decrease in LUVA cell viability (Supplementary Fig. 1). Viability was assessed after the 48-hour timepoint with the addition of 10ul/well of CellTiter 96® Aqueous One Solution cell proliferation MTS assay (Promega, G3580O). Subsequently, cells incubated for 1 h at 37 °C/5%CO2 and read at 492 nm to assess viability.
Patient samples
A total of 36 and 29 matched HGSOC pre-and post-NACT formalin-fixed, paraffin-embedded (FFPE) patient tumors were included in this retrospective study, for the hematologic mast cell stain, and Tryptase/Carboxypeptidase A3 (CPA3) staining, respectively. Histamine staining was performed in 20 patients from the original 36 patient cohort used for the hematologic mast cell stain. By definition of HGSOC, all patients included in this analysis had grade 3 disease. Pre-NACT specimens were from the patient’s diagnostic biopsy and post-NACT treatment tumors were obtained at the patient’s interval debulking surgery. Pre-NACT tumors were obtained via diagnostic laparoscopy or exploratory laparotomy, as appropriate for the clinical scenario and individual surgeon discretion. All patients received frontline carboplatin and paclitaxel therapy. All tissue was obtained, and respective experiments managed under The Women and Infants Hospital Review Board protocol approval #1817644-11. Detailed patient clinical outcomes for the hematologic-based mast cell stain and Tryptase/CPA3 stain, are shown in Tables 1 and 2, respectively.
Table 1 Patient clinical outcomes hemotoxic mast cell stainTable 2 Patient clinical outcomes tryptase and CPA3 immunostainingImmunohistochemistry
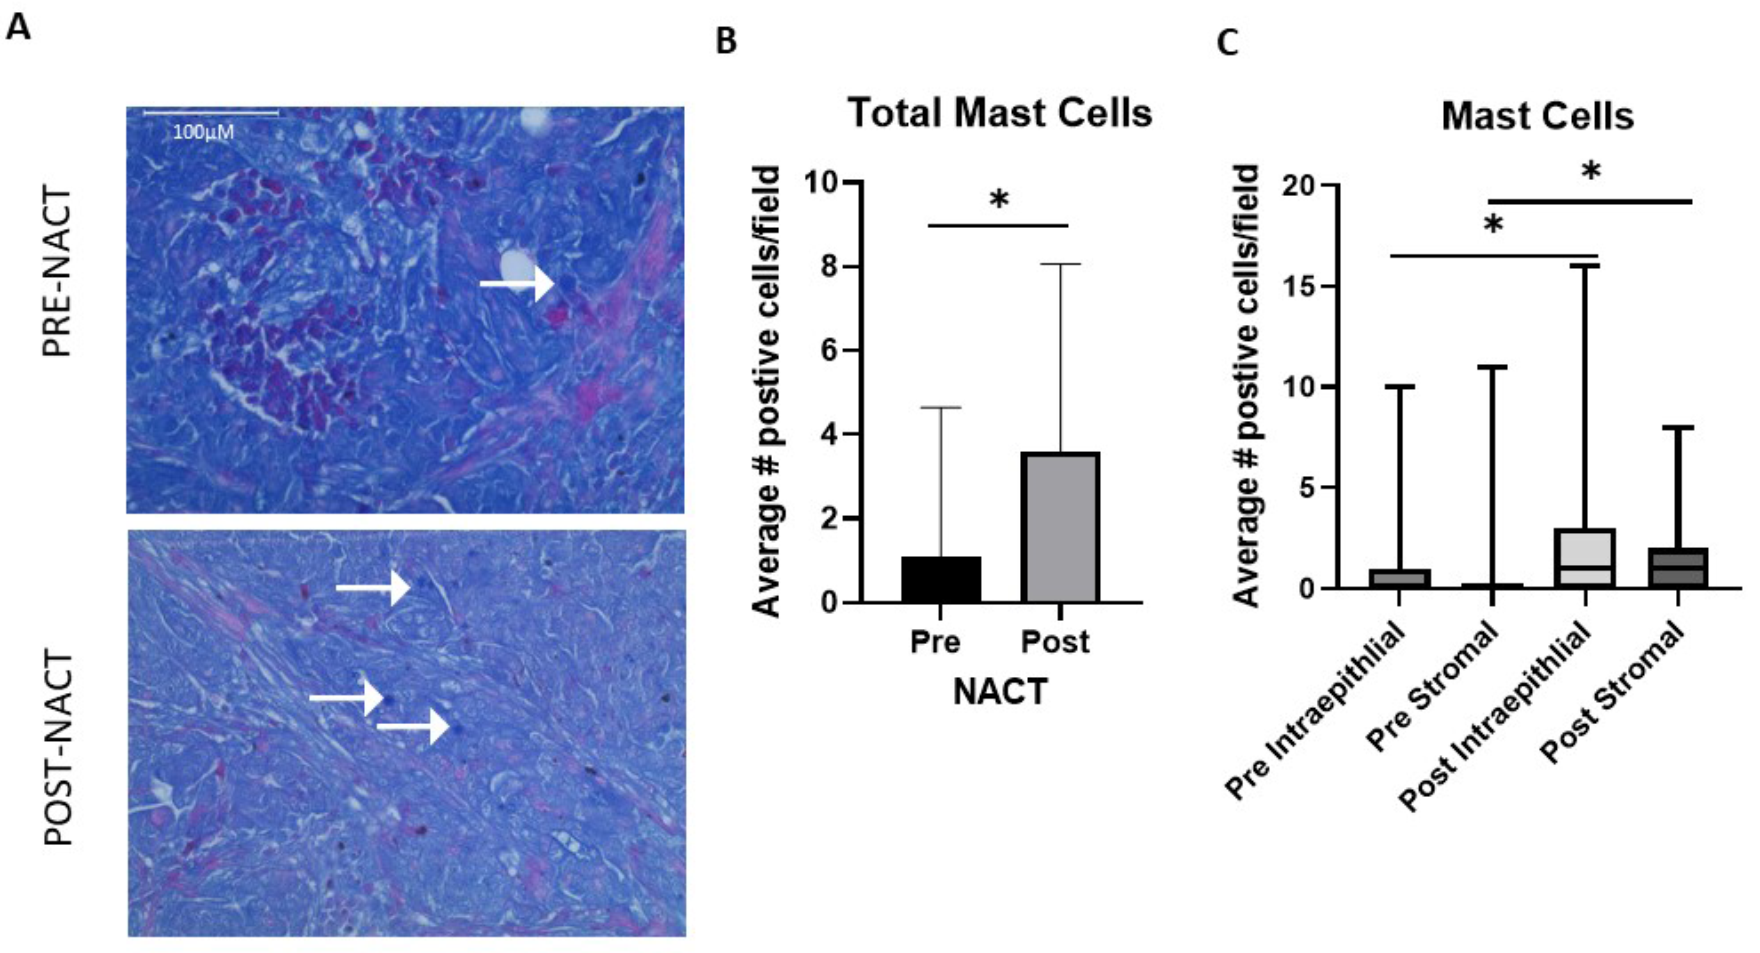
A commercially available combined eosinophil-mast cell hematologic staining kit (ab150665) was used to evaluate mast cell levels in 36 matched pre- and post-NACT FFPE HGSOC tumors. Staining was performed following the manufacturer’s protocol, without the optional step of counterstaining in Hematoxylin (Modified Mayer’s solution). In this kit mast cells were defined as bright blue, eosinophils were defined as bright red, and nuclei stained a dull blue.
Fluorescent immunohistochemistry
Fluorescent Immunohistochemistry to evaluate histamine levels and Tryptase+/CPA3 + cells in 29 matched pre- and post-NACT FFPE HGSOC tumors was performed as previously described in [5, 8]. Primary and secondary antibodies along with respective dilutions were as follows:
Tryptase (Abcam, ab2378, 1:50).
CPA3 (Abcam, ab251685, 1:50).
Histamine (Novus Biologicals, NBP2-45266, 1:50).
Anti-Rabbit DyLight™488 (Vector Laboratories, DI-1488, 1:1,000).
Anti-Mouse DyLight™594 (Vector Laboratories, DI-2594, 1:1,000).
Microscopy
The mast cell hematologic staining was visualized and imaged using an Evos M5000 Fluorescence imaging system using a 20x objective. Histamine and corresponding DAPI images were acquired with a spinning disk confocal Nikon Eclipse Ti microscope at a 10x objective. Finally, Tryptase, CPA3, and corresponding DAPI images were obtained from a Zeiss Axio Imager M1 and were acquired using diode lasers 402, 488, and 561 using a 20x objective. Representative images for Tryptase+/CPA3 + mast cells were taken at a 40x objective.
Image analysis
Ten randomly selected fields were captured for each slide for the hematologic based stain. Mast cells that were bright blue were counted and Women and Infants Hospital staff pathologists were consulted if any mast cells were in question. For histamine intensity and Tryptase+/CPA3 + mast cell counts, three and ten randomly selected fields per case were selected based on DAPI staining, respectively. All images were processed using Image J. For histamine intensity, image analysis was performed on grayscale 8-bit images and were thresholded for specific staining, with mean and integrated optical density (IOD) calculated. For Tryptase+/CPA3 + mast cells, the total number of positive tryptase, CPA3, and Tryptase+/CPA3 + cells were counted per field. Examples of images of matched HGSOC patient pre- and post-NACT tissue used to quantify Tryptase+/CPA3 + cells can be seen in Supplementary Figs. 2–4.
Quantitative PCR
RNA isolation and subsequent quantitative PCR was performed as previously described [5]. Validated human primers were purchased from Bio-Rad (AREG, CCL2, TGFβ1, VEGFA, TNF, IL-2, CCL7, IL-10, TGFβ2). Custom primer sequences (Invitrogen) are as follows:
18s rRNA-F-CCGCGGTTCTATTTTGTTGG.
18s rRNA-R-GGCGCTCCCTCTTAATCATG.
Statistical analysis
GraphPad Prism was employed for all statistical analyses. Student-t-tests were performed to determine differences in pre- and post-chemotherapy exposed HGSOC patient tissue and LUVA cells. Kaplan-Meier survival curve analysis was performed to assess hematologic mast cell counts and Tryptase and Tryptase/CPA3 positive mast cells with PFS and OS with log-rank p-values, hazard ratios and 95% confidence intervals determined. All p-values reported were 2-tailed and unadjusted.


留言 (0)