Cell culture
BEAS-2B, lung cancer cell lines (A549, H1299, H226, and H2170), and 293 T cells were obtained from the American Type Culture Collection (ATCC) and the Shanghai Cell Bank of the Chinese Academy of Sciences. BEAS-2B cells were cultured in BEGM medium (Lonza, CC-3171). H1299, H226, and H2170 cells were cultured in RPMI-1640 medium (Gibco, C11875500BT). A549 cells were cultured in Ham's F12 medium (Servicebio, G4560-500ML). 293 T cells were cultured in DMEM (Gibco, C11995500BT). All medium were supplemented with 10% foetal bovine serum (Gibco, 10099141C) and 1% penicillin‒streptomycin (Servicebio, G4003-100ML). All cells were incubated at 37 °C incubator with 5% CO2.
Lung cancer tissues
The 102 pairs of clinical lung cancer tissue samples and paracancerous tissues used in this study were obtained from the lung cancer tissue sample bank established by our group. All samples were obtained from the First Affiliated Hospital of Guangxi Medical University. All research subjects signed an informed consent form. The age, sex, height, weight, smoking history, drinking history, disease history, pathological classification, tumour diameter, tumour stage and other clinical medical data of the patients were collected within 15 d after surgery (Table S1). The study was approved by the Ethics Committee of The First Affiliated Hospital of Guangxi Medical University.
RNA extraction and RT‒qPCR
Total RNA was extracted from tissues and cells using TRIzol reagent (Invitrogen, 15,596,018) and quantified with a Nanodrop One spectrophotometer (Thermo Fisher Scientific, ND-ONEC-W). The RNA was reverse transcribed to cDNA using a GoScript™ Reverse Transcription System (Promega, A5002) kit. The primers used for quantitative PCR (qPCR) were synthesized by Sangon Biotech (Shanghai, China). For detailed primer sequences, refer to Table S2. A GoTaq® qPCR Master Mix (Promega, A6001) kit was used for qPCR, GAPDH was used as an internal reference, and relative expression was calculated using the 2−ΔΔCt method.
m7G-circRNA epitranscriptomic microarray
Total RNA was extracted from lung cancer tissues and quantified with a NanoDrop ND-1000 spectrophotometer, and then, microarray hybridization was performed according to Arraystar's standard protocols. Immunoprecipitation was performed using an anti-m7G antibody to enrich m7G-modified RNA; unmodified RNA markers were extracted from the supernatant. In accordance with the principle of Arraystar RNA labelling, RNA was treated with RNase R and labelled as complementary RNA (cRNA) with Cy5 and Cy3. The cRNAs were combined and hybridized to the Arraystar Human circRNA Epitranscriptomic Microarray (8 × 15 K, Arraystar) (GSE232281).
Plasmid construction and transfection
The circFAM126A, HSP90, and AKT1 overexpression plasmids and the corresponding control empty vectors (Fenghui Biotechnology, Changsha, China) were constructed, and the plasmid sequences were validated by sequencing. Plasmid extraction was performed with a Midi Prep Kit (QIAGEN, 12,145). Overexpression was performed using Lipofectamine® 3000 Transfection Reagent (Invitrogen, L3000015). First, 3.5 × 10⁵ cells were seeded in 6-well plates and cultured for 12 h. When the cells reached 70%-80% confluence, 1 µg of plasmid was added to the 6-well plates for transfection, and the medium was replaced with new complete medium 8 h later. Subsequent experiments were performed after 48 h of culture. In addition, small interfering RNAs (siRNAs) were used for transient silencing. All siRNAs and the corresponding scrambled controls were synthesized by RiboBio Co., Ltd. (Guangzhou, China) (Table S2). siRNAs were transfected into cells using a riboFECT CP transfection kit (RiboBio, C10511-05). 2.5 × 10⁵ cells were seeded in 6-well plates and cultured for 12 h. When the cells reached 30%-40% confluence, 20 nM siRNA was added to each well for transfection, and culture was continued for 48 h before subsequent experiments were performed.
Establishment of cell lines stably transfected with circFAM126A
The circFAM126A stable overexpression plasmid (circFAM126A OE) was constructed in our laboratory. After the plasmid was constructed successfully, the lentivirus was packaged in 293 T cells, and the lentivirus-containing supernatant was collected 48 h after transfection. Then, 500 µL of the virus-containing supernatant was added to A549 cells and incubated for 48 h. The fluorescence intensity was evaluated under a fluorescence microscope (AMG EVOS, Mill Creek, WA, USA). Stably transfected cell clones were selected using a monoclonal method.
Verification of the circular structure of circFAM126A
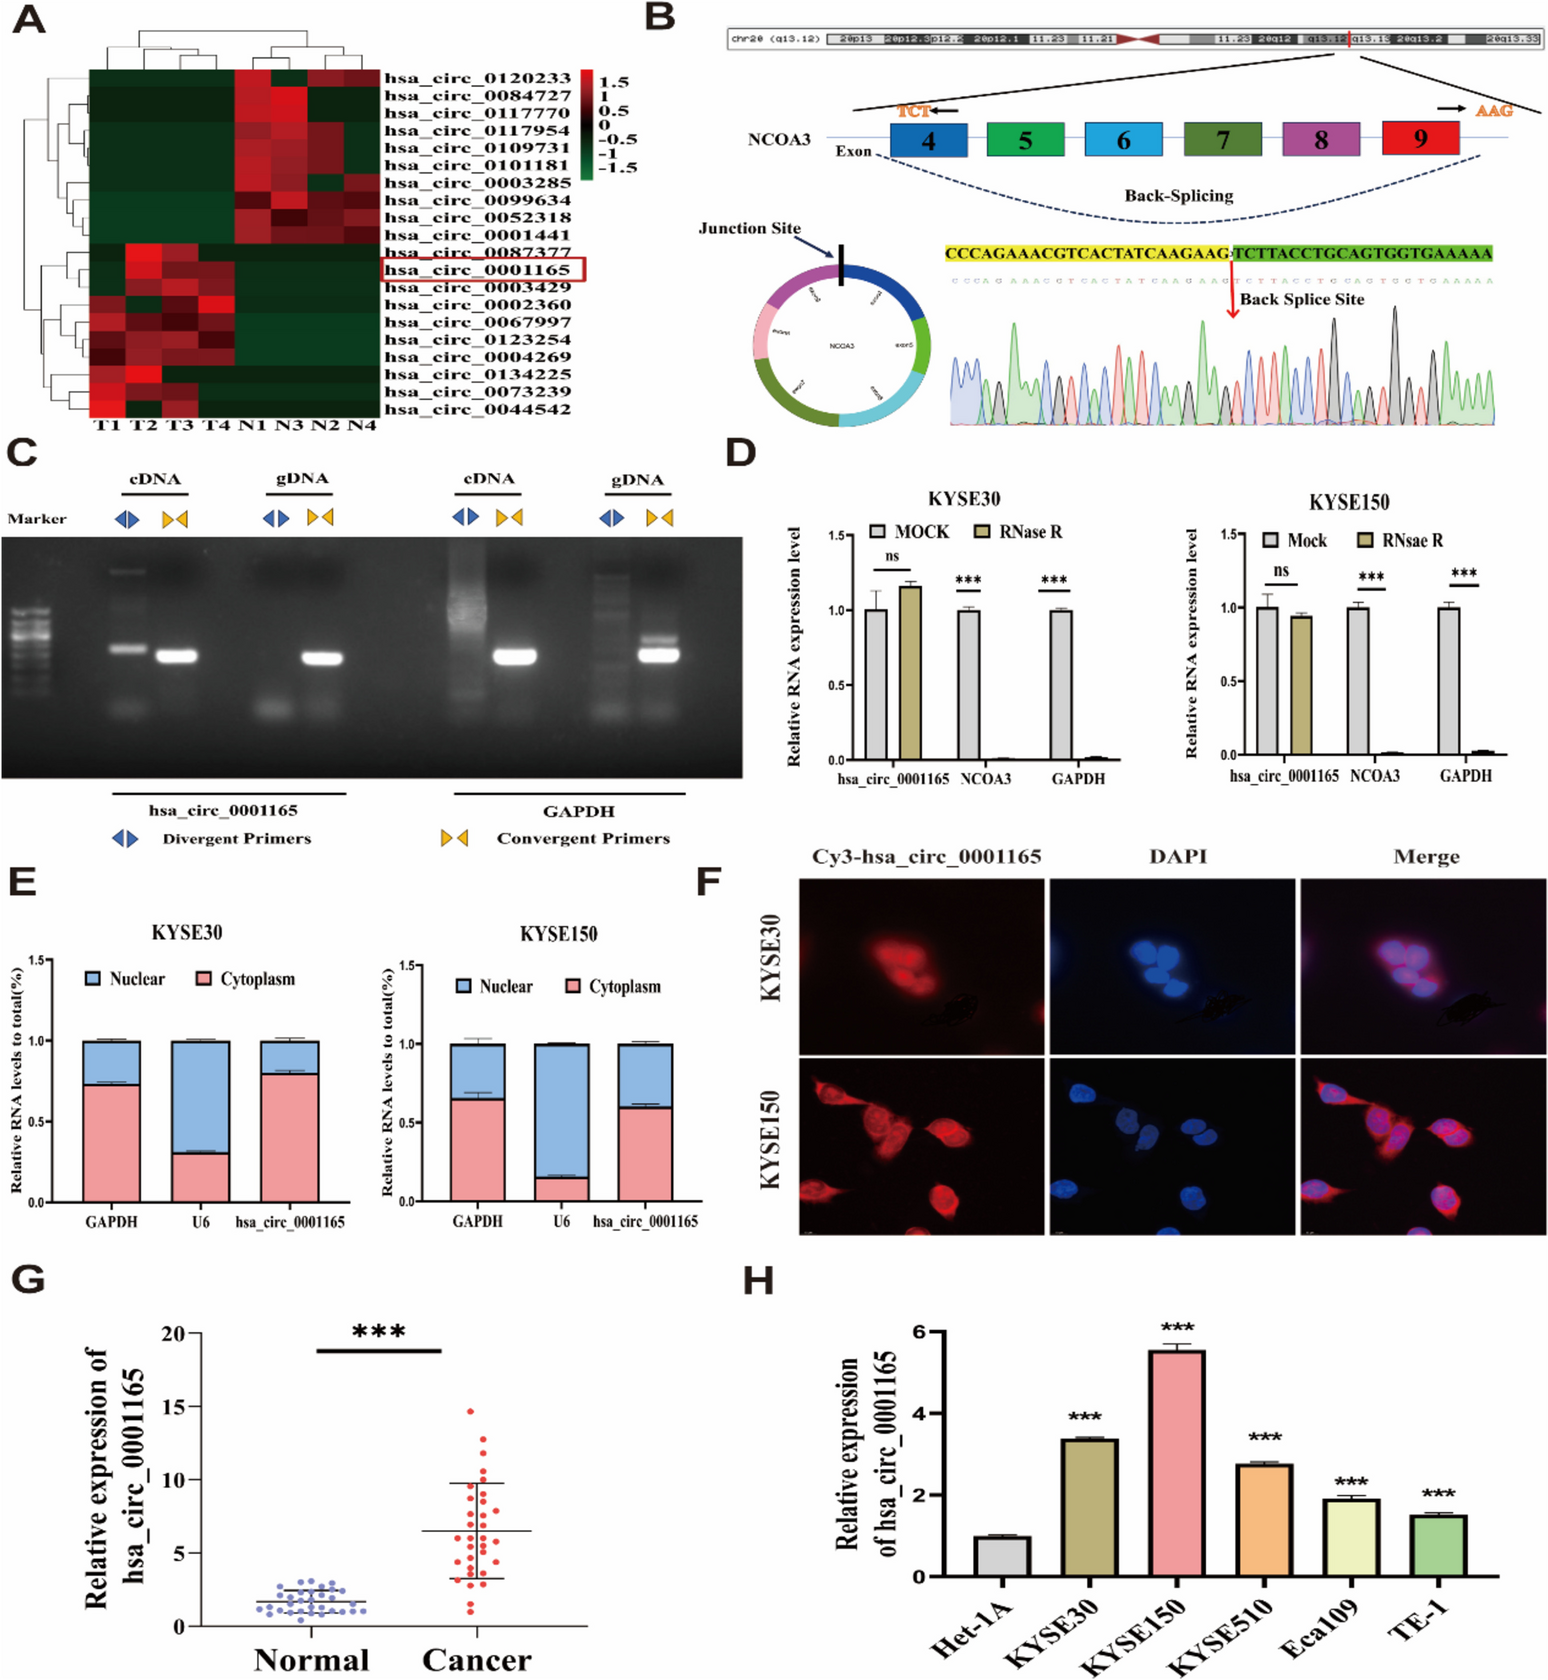
Total RNA (1 µg) was digested with 3 U/µg RNase R at 37 °C, and the digestion product was subjected to RT‒qPCR. These results indicated that circFAM126A was more resistant to RNase R digestion than FAM126A. A549 cells (4.5 × 10⁵) and H1299 cells were seeded in a 6-well plate and cultured for 12 h. The medium was replaced with fresh complete medium containing 2 µg/mL actinomycin D (MedChemExpress, HY-17559), and the cells were collected at 0, 4, 8, and 12 h. Total RNA was extracted, and the expression of circFAM126A and FAM126A mRNA was measured via RT‒qPCR.
FISH
The subcellular localization of circFAM126A was determined in A549 cells and H1299 cells using a FISH kit (RiboBio, C10910). The specific circFAM126A fluorescence in situ hybridization (FISH) probe was labelled with FAM and synthesized (Sangon Biotech, China) (Table S2). A549 cells and H1299 cells were seeded on round coverslip, fixed with 4% paraformaldehyde (PFA), permeabilized with precooled permeabilization solution (0.5% Triton X-100 in PBS) for 5 min at 4 °C, blocked with prehybridization buffer for 30 min at 37 °C, and then hybridized with the circFAM126A-specific FISH probe at 42 °C in the dark for 16 h. Then, the nuclei were stained with 10 µL of DAPI for 10 min in the dark, and the samples were covered with coverslips. Fluorescence imaging of the circFAM126A subcellular localization was performed using an LSM800 confocal microscope (Zeiss).
Nucleocytoplasmic separation experiment
A PARIS™ (Invitrogen, AM1921) kit was used to conduct nucleocytoplasmic separation to further analyse the subcellular localization of circFAM126A. A total of 1 × 10⁷ A549 cells and H1299 cells were collected, and cytoplasmic and nuclear RNA were extracted with a nuclear‒cytoplasmic fractionation kit. The expression of circFAM126A was measured by RT‒qPCR, with GAPDH serving as a cytoplasmic marker and U6 serving as a nuclear marker.
Cell viability assay
A Cell Counting Kit-8 (CCK-8; Dojindo, CK04) was used to evaluate cell viability. A549 cells and H1299 cells (5 × 10³ cells/well) were seeded in a 96-well plate and cultured for 12 h prior to siRNA transfection for 48 h. A549 cells and H1299 cells (8 × 10³ cells/well) were seeded in a 96-well plate, cultured for 12 h, transfected with the expression vector and incubated for 48 h. CCK-8 reagent was mixed with complete culture medium at a ratio of 1:10, and the mixed medium was added. After an incubation at 37 °C for 1.5 h, the absorbance was measured at 450 nm.
EdU incorporation assay
A Cell-Light EdU Apollo 567 In Vitro Kit (RiboBio, C10310-1) was used to evaluate cell proliferation. A549 and H1299 cells (5 × 10³ cells/well) were seeded in a 96-well plate. After cultured for 12 h perform siRNA transfection. A549 and H1299 cells (8 × 10³ cells/well) were seeded in a 96-well plate, cultured for 12 h, transfected with the expression vector and incubated for 48 h. After an incubation for 48 h, the samples were labelled with EdU, fixed and stained. Cell imaging was performed using the EVOS® FL Auto Imaging System, and DAPI-positive cells and EdU-positive cells were then counted using ImageJ.
Detection of apoptosis by flow cytometry
An Annexin V-FITC/propidium iodide (PI) double-staining apoptosis detection kit (KeyGen Biotech, KGA107) was used to detect apoptosis. A549 cells and H1299 cells (2.5 × 10⁵ cells/well) were seeded in a 6-well plate, cultured for 12 h prior to siRNA transfection, and incubated for 48 h. A549 cells and H1299 cells (3.5 × 10⁵ cells/well) were seeded in a 6-well plate, cultured for 12 h, transfected with the expression vector and incubated for 48 h. The cells were collected by detachment with EDTA-free trypsin (Solarbio, T1350), centrifuged, resuspended in binding buffer, and then stained with Annexin V-FITC (5 µL) and PI (5 µL). Apoptosis was quantified using a CytoFLEX flow cytometer (Beckman Coulter).
Wound healing assay
A549 cells and H1299 cells (2.5 × 10⁵ cells/well) were seeded in a 6-well plate and cultured for 12 h prior to siRNA transfection for 48 h. A549 cells and H1299 cells (3.5 × 10⁵ cells/well) were seeded in a 6-well plate, cultured for 12 h. Transfected with the expression vector and incubated for 48 h. When the cell confluence reached nearly 100%, a 200 μL RNase-free pipette tip was used to make a straight and even scratch on the cell surface. Then, 0 h and 48 h after scratching, images were captured at the same position using a microscope (Olympus, Japan). After image acquisition, the wound areas at 0 h and 48 h after wounding were compared and statistically analysed.
Transwell migration assay
A549 cells and H1299 cells (2.5 × 10⁵ cells/well) were seeded in a 6-well plate and cultured for 12 h prior to siRNA transfection for 48 h. A549 cells and H1299 cells (3.5 × 10⁵ cells/well) were seeded in a 6-well plate, cultured for 12 h, transfected with the expression vector and incubated for 48 h. Then, the cells were detached and resuspended in serum-free medium. A migration chamber (Corning, USA) was filled with serum-free medium and equilibrated in a cell culture incubator for 1 h. Then, complete medium (700 μL) was added to the lower compartment, and 400 μL (1 × 10⁴ cells) of the cell suspension was added to the upper compartment and incubated for 24 h. The cell samples were fixed with methanol and stained with crystal violet. The cells were removed from the upper surface of the membrane, and the number of migrated cells was determined using the EVOS® FL Auto Imaging System.
Subcutaneous tumour formation assay in nude mice
Ten 4-week-old female BALB/c nude mice were randomly divided into two groups (the stable circFAM126A overexpression group and the control group). After acclimation in a specific pathogen-free (SPF) environment for one week, 2 × 10⁷ cells were injected subcutaneously into the right axillary region of each nude mice. The tumour volume was measured using callipers every 3 days (volume = length × height2 × 0.5). After 28 days, the nude mice were photographed and then sacrificed, and the tumours were harvested. A portion of the tissue was fixed with 4% PFA for immunohistochemistry, and a portion was frozen at -80 °C for subsequent Western blot (WB) analysis. All animal experiments performed in this study were approved by the Ethics Committee of Guangxi Medical University.
Dot blot (DB) assay
Total RNA was extracted from A549 cells with TRIzol reagent (Invitrogen, 15,596,018). One microgram of RNA was applied to nylon membranes (Beyotime, FFN10), dried, and crosslinked with 1500 J of UV radiation for 5 min. The membranes were blocked with 5% skim milk for 30 min and incubated with an anti-m7G antibody overnight at 4 °C. Nylon membranes were washed with TBST and incubated with a horseradish peroxidase (HRP)-conjugated secondary antibody (Proteintech, SA00001-1) for 1 h prior to chemiluminescence imaging using the Clinx S6 system. The membranes were washed with TBST and incubated with 0.1% methylene blue (Solarbio, G1300) for 5 min before imaging.
WB analysis
Cells were lysed in cell lysis buffer (10 mM Tris–HCl (pH 7.4), 1% SDS, and 1 mM Na3VO4) to extract total protein. Protein concentrations were determined using the Pierce™ BCA Protein Assay Kit (Thermo Fisher Scientific, 23,227). Equal amounts of protein were separated on 8‒10% sodium dodecyl sulfate‒polyacrylamide gel electrophoresis (SDS‒PAGE) gels and transferred to polyvinylidene fluoride (PVDF) membranes at a constant voltage of 25 V for 4.5 h or a constant current of 200 mA for 1‒2 h. Membranes were blocked with 5% skim milk for 1 h and incubated overnight at 4 °C with the primary antibody. After washing, an anti-rabbit or anti-mouse secondary antibody was added, and the membranes were incubated at room temperature for 1 h. Chemiluminescence imaging was then conducted with the Clinx S6 system. Grayscale values of protein bands were analysed with ImageJ. The primary antibodies used were as follows: anti-HSP90 (Proteintech, 60,318–1-Ig), anti-AKT1 (SANTA, sc-5298), anti-p-AK (S473) (Cell Signaling Technology, 4060 T), anti-HK2 (Proteintech, 22,029–1-AP), anti-PKM2 (60,268–1-Ig), anti-LDHA (19,987–1-AP), anti-β-actin (Affinity, AF7018), and anti-β-tubulin (Affinity, AF7011). The secondary antibodies used were as follows: anti-rabbit IgG (Cell Signaling Technology, 7074S) and anti-mouse IgG (Proteintech, SA00001-1).
Glucose uptake and lactate production assays
A549 cells and H1299 cells (2.5 × 10⁵ cells/well) were seeded in a 6-well plate and cultured for 12 h prior to siRNA transfection for 48 h. A549 cells and H1299 cells (3.5 × 10⁵ cells/well) were seeded in a 6-well plate, cultured for 12 h, transfected with the expression vector and incubated for 48 h. Glucose uptake and lactate production were measured using a glucose assay kit (Beyotime, S0201S) and lactate assay kit (Solarbio, BC2230). Glucose and lactate concentrations were normalized to the protein concentration.
Protein stability assays
A549 cells stably overexpressing circFAM126A (4.5 × 10⁵ cells/well) were seeded in a 6-well plate. After 12 h, fresh complete medium containing 100 µg/mL cycloheximide (CHX; Mdbio, Inc., C012-1 g) was added, total cellular proteins were collected at 0, 6, 12 and 24 h, and WB experiments were performed. A549 cells stably overexpressing circFAM126A (4.5 × 10⁵ cells/well) were seeded in a 6-well plate. After 12 h, fresh complete medium containing 10 µM MG132 (Sigma, M7449) was added, and total cellular protein was collected 24 h later, followed by WB analysis.
CLIP
Crosslinking immunoprecipitation (CLIP) experiments were performed using a CLIP kit (BersinBio, Guangzhou, China, Bes3014). Prior to the experiment, the medium was replaced with fresh medium containing 100 µM 4-thiouridine (Sigma, T4509), and the culture was continued for 16 h to enhance the binding between proteins and RNAs. Then, the samples were irradiated with 365 nm ultraviolet light for 10 min. Afterwards, the cells were lysed, and m7G-RNA complexes were captured with an anti-m7G antibody. The complexes were subjected to sequential digestion with DNase I, RNase T1, and proteinase K, and RNA was eluted. Primers were designed separately based on the full-length circFAM126A sequence, which was truncated into 14 segments of 50 bp each, and the primer information can be found in Table S2. The enrichment efficiency of the protein‒RNA binding sites was determined by qPCR.
MeRIP
Methylated RNA immunoprecipitation (MeRIP) experiments were performed using a MeRIP kit (IEMed, Guangzhou China, IEMed-K305). The cells were lysed with TRIzol reagent, total cellular RNA was extracted, the RNA was fragmented via sonication and immunoprecipitated with an anti-m7G antibody, the precipitated RNA was collected and washed, and the antibody enrichment efficiency was assessed using RT‒qPCR.
TRAP
Tagged RNA affinity purification (TRAP) experiments were performed using a TRAP Kit (BersinBio, Guangzhou, China, Bes5101). The GST-MS2 fusion expression vector and circFAM126A-MS2 stem‒loop structure tandem repeat vector used for the experiments were constructed by IEMed Biomedical Technology (Guangzhou, China). The MS2, circRNA-MS2, and GST-MS2 vectors were cotransfected into A549 cells, and the GST-MS2-circFAM126A complexes were collected after cell lysis. The complexes were subsequently pulled down by glutathione-labelled magnetic beads, and the collected and eluted complexes were subjected to silver staining and mass spectrometry (MS) analysis.
RIP
RNA immunoprecipitation (RIP) experiments were performed using a RIP Kit (BersinBio, Guangzhou, China, Bes5101) to further analyse the interactions between circFAM126A and downstream proteins. First, 2 × 10⁷ A549 cells were cultured and collected, lysed with polysome lysis buffer, equilibrated with Protein A/G magnetic beads, and subjected to immunoprecipitation with an anti-HSP90 antibody to pull down HSP90 and its associated bound RNAs. Finally, the RNA precipitates were eluted and collected, and circFAM126A enrichment was examined via RT‒qPCR.
Immunofluorescence (IF) staining
A549 cells and H1299 cells (2 × 10⁴ cells/well) were seeded in a 12-well plate containing coverslips and cultured for 12 h. After fixation, the cells were blocked with blocking solution at room temperature for 1 h. Added the primary antibody and incubated overnight at 4 °C. Then, added fluorescently labelled secondary antibody and incubated in the dark with for 1 h at room temperature. DAPI (Boster Biological Technology, AR1176) was added to stain the nuclei, and fluorescence imaging was conducted with an LSM800 confocal microscope (Zeiss). The following primary and secondary antibodies were used: anti-HSP90 (Proteintech, 60,318–1-Ig), anti-p-AKT (S473) (Cell Signaling Technology, 4060 T), anti-mouse IgG (Cell Signaling Technology, Inc., 4408S) and anti-rabbit IgG (Cell Signaling Technology, Inc., 8890S).
Co-IP
Coimmunoprecipitation (Co-IP) experiments were performed using a Co-IP kit (BersinBio, Guangzhou, China; Bes3011) to investigate protein‒protein interactions. Briefly, 2 × 10⁷ cells were collected and lysed with cell lysis buffer to obtain total cellular protein. Then, 2 µg of antibody was added, and the cells were incubated overnight at 4 °C with vertical mixing. Protein A/G-MagBeads were added to capture the antibody‒protein complexes, the enriched proteins were eluted, and WB was performed to detect the target proteins.
Immunohistochemical (IHC) analysis
Tissues from tumours transplanted into nude mice were embedded in paraffin, sectioned, deparaffinized, and rehydrated. After sequential incubations with primary and secondary antibodies, the sections were stained with haematoxylin and eosin (H&E) (Solarbio, China). Images were acquired at 200 × and 400 × magnification under a light microscope (Leica, Mannheim, Germany). The antibodies used for IHC analysis were specific for Ki67 (Servicebio, GB121142), Bcl-2 (Cell Signaling Technology, Inc., 15071 T), and RhoA (Servicebio, GB115176).
Statistical analysis
The data in this study are presented as the means ± standard deviations. Comparisons of quantitative data between two groups were conducted using paired sample t tests (normally distributed data) or rank-sum tests (nonnormally distributed data). A receiver operating characteristic (ROC) curve was constructed to evaluate the potential diagnostic value of circFAM126A. Pearson’s correlation analysis was performed to evaluate correlations between variables. Statistical analyses were performed using SPSS 25.0 (IBM, Chicago, USA), and GraphPad Prism 7.0 (San Diego, USA) was used for graphing. All tests were two-tailed, and a P value < 0.05 was considered statistically significant. All experiments were performed with three biological replicates, and the data presented represent the results of at least three independent experiments.


留言 (0)