
記住我


A total of 199,429 women were included in the analysis. Among these, 733 women developed EOC (0.39%) within the 10-year risk prediction period. Characteristics of eligible participants at baseline are summarised in Table 1. The EOC incidence rates estimated in the UK Biobank for each age group were in line with the UK population incidences [21] (Supplementary Fig. 2).
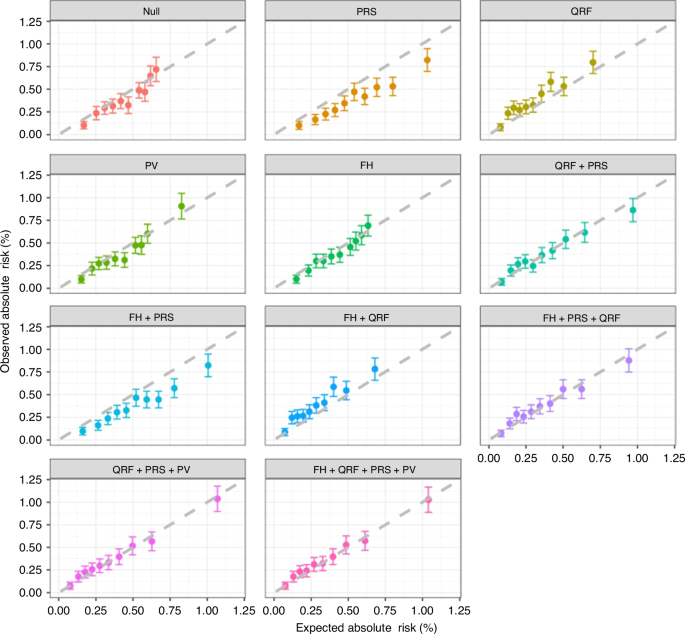
Table 1 Summary of characteristics of 199,429 eligible participants at baseline.Model discrimination and calibrationWhen the PRS, QRFs and PVs were each considered individually in the model in addition to age, the discriminative ability was similar (AUCs = 0.64–0.65 vs 0.61 for age alone; Table 2). There was some evidence of systematic overprediction of risks when considering PRS alone across the deciles of predicted risks (E/O = 1.38, 95% CI: 1.29–1.49; calibration slope = 1.06, 95% CI: 1.05–1.08). The model considering QRF alone underestimated the EOC risk overall (E/O = 0.80, 95% CI: 0.75–0.86), but this was driven by some deciles. The calibration slope was only slightly lower than 1 (calibration slope = 0.96, 95% CI: 0.94–0.97) (Table 2 and Fig. 1). The calibration slope when considering PVs alone was 1.02 (95% CI: 1.00–1.03) (Table 2 and Fig. 1). As expected, when QRF, PRS and PV were jointly considered in the model, the discriminative ability of the model was greater than any of the individual factors (AUC = 0.68, 95% CI: 0.66–0.70). This model was well calibrated (E/O = 0.99, 95% CI: 0.92–1.06; calibration slope = 1.00, 95% CI: 0.98–1.01, Table 2 and Fig. 1). The addition of FH of breast and prostate cancer to age also improved the discrimination (AUC = 0.63), but addition of FH to the model including QRF + PRS + PV model did not further improve the discriminative ability (Table 2 and Fig. 1). However, for completeness and since FH is included in practice, we considered the full model, including FH in all subsequent analyses. The patterns were similar when using Harrell’s C-index as the measure of discrimination.
Table 2 Calibration and discrimination of 10-year risk prediction of EOC by the BOADICEA model using individual or different risk factor combinations in the entire cohort, by age group and in pathogenic variant (PV) carriers.Fig. 1: Observed and predicted 10-year EOC risks under individual or different combinations of risk factors*.
*Women were grouped into deciles based on their predicted risks. Each dot represents the mean observed and predicted risk in the decile and the error bar represents the 95% confidence intervals. The dashed line is the reference line with slope equals to 1, on which the observed risk equals to the predicted risk. When the confidence interval intersects with the reference line, the predicted risk in that decile is not significantly different from the observed risk. If the confidence interval of a decile deviates from the reference line, there is a suggestion of either overprediction (below the line) or underprediction (above the line) of EOC risks by the BOADICEA model. Null age-only model, PRS polygenic risk scores, PV pathogenic variants, QRF questionnaire-based risk factors, FH family history.
Model performance by age groupThere were 110,885 women younger than age 60 years (323 incident EOC patients) and 88,544 women aged 60 years or older (450 incident EOC patients). When considering the full model (QRF, PRS, PV and FH of breast/prostate cancer), there was some underprediction of the overall risk (E/O = 0.87, 95% CI: 0.78–0.97) in the <60 years age group. However, the observed risks were consistent with those predicted in all deciles and the calibration slope was consistent with 1 (slope = 0.98, 95% CI: 0.95–1.00). The model was well calibrated in the ≥60 years age group (E/O = 1.03, 95% CI: 0.94–1.13; calibration slope = 1.01, 95% CI: 0.98–1.03; Fig. 2). The discriminative ability was similar between the two age groups with AUCs of 0.65–0.66 (Table 2).
Fig. 2: Observed and predicted 10-year EOC risks by age under the full model.
a Age <60 (N = 110,885); b age ≥60 (N = 88,544). Women were grouped into deciles based on their predicted risks. Each dot represents the mean observed and predicted risk in the decile and error bar represents the 95% confidence intervals.
Model performance in PV carriersA total of 1231 women carried PVs in one of the six EOC susceptibility genes. Among those, 44 developed EOC during the 10-year risk prediction period. Compared to the model considering PV alone, the addition of QRF and PRS provided a wider range of risks. The later model predicted risks that were in line with the observed risks in deciles of predicted risk, but the observed risks in each decile were associated with wide confidence intervals due to the small number of incident cancers. For this model, the overall E/O was 0.77 (95% CI: 0.57–1.04) and the calibration slope was 0.91 (95% CI: 0.80–1.02) with some evidence of underestimation in the 8th and 9th deciles (Fig. 3). The full model, that also included FH of breast and prostate cancer (but not EOC) showed similar patterns (Fig. 3). Compared with the model considering PV only, the full model improved the AUC from 0.73 (95% CI: 0.67–0.80) to 0.76 (95% CI: 0.69–0.82; Table 2).
Fig. 3: Observed and predicted 10-year EOC risks in pathogenic variant carriers (N = 1231) under the model considering PV only, PV + PRS + QRF and PV + PRS + QRF + FH.
Women were grouped into deciles based on their predicted risks. Each dot represents the mean observed and predicted risk in the decile, and the error bar represents the 95% CIs.
Risk classificationThe 10-year risk thresholds for defining the four risk groups, using the age-dependent and the age-independent approach, are shown in Supplementary Fig. 3. The model considering only FH of breast and prostate cancer or FH and QRFs identified 0% of women with RR of 2.9 or greater or 10-year risk of 1.4% or greater. The full model considering FH, QRF, PRS and PV classified 97.7%, 1.7%, 0.4% and 0.2% women in the RR < 2.0, 2.0–2.9, 2.9–6.0 and ≥6.0 categories and 96.6%, 2.5%, 0.7% and 0.2% women in 10-year risk <1%, 1–1.4%, 1.4–3%, and ≥3% respectively (Supplementary Table 1). When defining individuals in the top 10%, 30% and 50% of the predicted risk distribution as at risk, it identified 19.8%, 41.8%, and 64.7% of incident EOC patients (Supplementary Table 2).
With age-dependent thresholds, the full model classified 1.1%, 0.2% and 0.3% of women younger than age 60 in the 2.0 ≤ RR < 2.9, 2.9 ≤ RR < 6.0 and RR ≥ 6.0 categories, identifying 2.8%, 0.9% and 7.1% of incident EOC patients occurring in the 10-year period, respectively. Whereas among women aged 60 years or older, 2.5%, 0.5% and 0.1% were in the 2.0 ≤ RR < 2.9, 2.9 ≤ RR < 6.0 and RR ≥ 6.0 categories, accounting for 4.5%, 2% and 1.3% of incident EOC patients respectively (Supplementary Table 3). Using the age-independent 10-year risk thresholds, the model classified a larger proportion of higher-risk women in the age ≥60 than age<60 group, with 5.1%, 1.4% and 0.2% of women aged 60 years or older in 1%≤risk<1.4%, 1.4% ≤ risk <3% and risk ≥3% categories, identifying 11.5%, 2.7% and 2.0% incident EOC patients respectively (Supplementary Table 3).
In the PV carriers, using RR thresholds, the model considering PV only classified 13.6%, 42.1% and 44.4% carriers in the 2.0 ≤ RR < 2.9, 2.9 ≤ RR < 6.0 and RR ≥ 6.0 categories, identifying 2.3%, 31.8% and 65.9% of incident EOC occurred respectively. In contrast, the full model considering all factors classified 17.4%, 29.4% and 36.4% women in these categories, identifying 4.6%, 22.7% and 65.9% of incident EOC patients. Similar outcomes were observed using age-independent 10-year risk thresholds (Supplementary Tables 4 and 5).
留言 (0)