Materials and reagents
Isopropanol and water (UPLC/MS grade) were purchased from Honeywell (VWR, NL). Leucine enkephalin (LeuEnk) was purchased from Sigma–Aldrich (St. Louis). Sodium hydroxide was purchased from Merck (Darmstadt, Germany).
Samples and logisticsNon-clinical reference samples
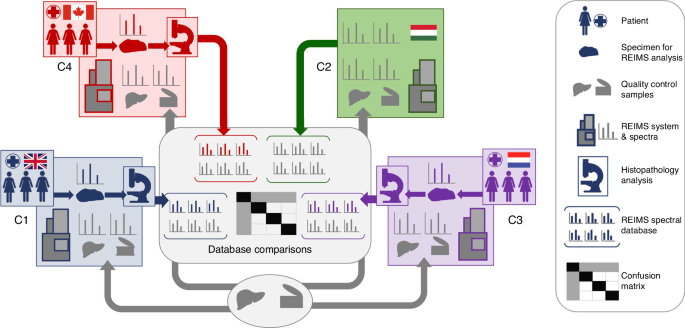
Reference samples consisted of: (1) NIST reference meat homogenate (Standard reference materialⓇ 1546a, National Institute of Standards and Technology, NIST); and (2) two individual batches of pork liver procured by Imperial College London (Center 1 (C1), London, United Kingdom and shipped to three other participating centres comprising Waters Research Center, Budapest, Hungary (C2); Maastricht MultiModal Molecular Imaging Institute, Maastricht The Netherlands (C3); and Queen’s University, Kingston Canada (C4). Pork liver samples were shipped from C1 to the other sites on dry ice and stored in low-temperature (−80 °C) freezers until analysis (Fig. 1) as previously described [12].
Clinical samples
Human breast tissue was collected at three sites affiliated with clinical centers, from patients who underwent surgery for invasive breast cancer over 2018-2019 (Fig. 1). Informed consent was obtained, and study approval was granted as per the following local medical ethics committees: Imperial College London (C1); East of England—Cambridge East Research Ethics Committee, REC reference 14/EE/0024; Maastricht University (C3), medical ethics committee of Maastricht University Medical Center (MUMC+) permit No. METC 16-4-168; and Queen’s University (C4) Health Sciences Research Ethics Board, permit No. 6023032. After macroscopic examination, a site-specific breast pathologist (four pathologists in total) selected tumour and/or normal tissue samples from 6-8 breast cancer surgery cases from each site. Samples were stored in a low-temperature freezer (−80 °C) until REIMS analysis was performed.
Sampling with electrosurgery
All tissues were allowed to reach room temperature before analysis and placed on a return electrode. If necessary, samples were wetted with deionised water. Electrosurgical dissection was carried out using commercial electrosurgical generators (C1: COVIDIEN Ltd. Triad, Ireland; C2: ERBE Elektromedizin GmbH ICC-350, Germany; C3/C4: COVIDIEN Ltd. Force Fx) providing power-controlled sinusoidal 330 kHz alternating current. Tissue was sampled using a custom diathermy pencil with a smoke evacuation line (Waters Research Center, Budapest Hungary). Each sampling event was conducted for 3–5 s.
Settings for the sampling of non-clinical samples
The generator was used in cut mode with an optimized power setting (i.e. 10 W for the NIST reference meat homogenate, 20 W for the pork liver samples). In order to maximize reproducibility, the diathermic knife was maintained in a semi-vertical position above the tissue during sampling. NIST and pork liver reference material was analyzed before and after each series of breast measurements, and used as quality control to assess instrument variability across sites. Measurements were performed two times per day, on two consecutive days for each sample. Each measurement consisted of 3–5 sampling points, typically lasting 4–8 s in duration.
Settings for the sampling of clinical samples
Previous work revealed lipid class-dependent differences in signal intensity in ‘cut’ as compared with ‘coagulation mode’ [4]. Thus, we analyzed all samples retrospectively using both modes where possible. In a clinical setting, we anticipate that this would enable continuous intraoperative tissue classification if the surgeon switches mode. Optimized generator power settings used, included 15–70 W in cut mode, or 10–30 W in coag. The blade on the diathermic knife was cut in half to maximize the aspiration of the plume into the mass spectrometer.
REIMS – qTOF instrumentation
At each site, data was acquired on a XevoTM G2-XS quadrupole time-of-flight (qTOF) mass spectrometer fitted with a REIMS source (version III, research use only) (Waters, Wilmslow UK). Operating parameters were kept constant among sites, and instrument status was verified using a common checklist based on a harmonized REIMS protocol across all four sites [12]. Briefly, instruments were connected to a 7 bar gas (pressurized air or Nitrogen) supply. Time-of-flight (TOF) and backing pressures were in the range of <e−7 and 1.3 mbar, respectively. The smoke produced by electrocautery was aspirated via a Venturi pump connected to the REIMS interface. The heated coil in the REIMS source was kept at 8-900 °C. Data were acquired in “sensitivity” and negative ionization mode within the mass-to-charge m/z range of 100–1500. The mass resolution was above 15.000 full width at half-maximum. Instrument calibration was performed or checked with sodium formate before each measurement series. A solution of leucine-enkephalin at a concentration of 0.05 ng/µl (prepared in isopropanol) was continuously infused during acquisition at a flow rate of 150 µl/min for external lock mass correction. MS/MS fragmentation of molecular species was carried out using nitrogen as collision gas with 30–45 eV collision energy according to the exact mass and molecular species type.
Histopathology examination of clinical samples
After REIMS analysis, the remaining tissues were fixed in formalin (Unifix, Klinipath) and embedded in paraffin. Tissue sections were then stained with Haematoxylin and Eosin (H&E) and examined by a breast pathologist. One or two pathologists at each of the three clinical centres (four pathologists in total) examined the tissues obtained and analyzed at their respective centres using standard-of-care methods. A representative tissue section from each specimen was assessed microscopically for the percentage of cancerous versus non-neoplastic tissue surrounding the area analyzed by REIMS, as annotated by the pathologists (Supplementary Figure S1). Spectra were assigned the label ‘breast cancer’ if the region surrounding the sampling point contained at least 30% breast cancer. Spectra containing < 30% breast cancer were excluded. Spectra containing only 100% normal breast adipose surrounding the sampling point, were labelled as normal breast tissue. Spectra containing < 30% breast cancer were excluded. We adopted a ‘30% cancer’ criteria to balance the number of spectra available in the breast cancer class with the risk of sampling/labelling error that can occur by extrapolation of class labels for spectra generated for ablated tissue, based on the tissue surrounding the REIMS sampling area.
Data analysis
Mass spectral processing and multivariate data analysis were performed using the Abstract Model Builder (AMX) software ([beta] version 1.0.1581.0, Waters Research Center). All mass spectra were processed as follows: (i) background subtracted; (ii) mass shift corrected against the reference peak of deprotonated LeuEnk [M−H]− at m/z 554.26; (iii) binned to 0.1 Da (within the mass range m/z 600–1000—corresponding to the region of abundant phospholipids and triglycerides); iv) normalized against the total ion count (TIC). Multivariate analysis was based on principal component analysis/linear discriminant analysis (PCA/LDA). PCA was performed with a maximum of n = 25 dimensions and LDA with n-1 dimensions where n corresponds to the number of variables introduced in the model. Cross-validation tests were performed by building the site-specific classifiers to recognize the data generated on the other sites. Data points were marked as outliers if they deviated 5 x standard deviation (SD). Inter- and intra-site and user variability was assessed using cosine similarity measure and KNN-classifier and all relevant site-specific peaks were listed using HSIC Lasso using Python 3.10. To identify specific peaks differentially abundant in normal and cancerous tissue, we used a Support Vector Machine (SVM) based algorithm in Python 3.7 using sklearn.svm.SVC function with l1 norm and a parameter of C = 500 to select features. To explore the reproducibility of FA signatures in breast cancer tissue stratified by PIK3CA mutational status, we used a MicrobeLynx model (Waters) [16] based on selected FA peaks: m/z 279.23, 307.26, 305.25, 303.23, 331.26, 329.25; normalized to the sum of FA peaks. Briefly, a channel was created from each FA peak using the median and standard deviation of each class, and the likelihood of a novel sample being part of each channel’s distribution was calculated. The sample was classified into the class with the highest likelihood. Five-fold cross-validation was used to assess accuracy. The relative abundance of selected ions-of-interest is presented as box-and-whisker plots using the method of Tukey (Graphpad PRISM). Boxes depict the median and span the 25–75th percentile. Whiskers extend to the highest and lowest data point if ≤ the 75th percentile plus 1.5× the interquartile range (IQR), or ≥ the 25th percentile minus the IQR. Individual data points are not shown. Alternatively, data points are shown if > the 75th percentile plus 1.5× IQR or <25th percentile minus 1.5× IQR. In this case, the whiskers extend to the 75th percentile plus 1.5× IQR and the 25th percentile minus 1.5× IQR. Two-tailed t-tests (unpaired) were used to assess differences in the abundance of normally distributed m/z bins, ratios, or cosine similarity scores, where significance was indicated by p < 0.05. Welch’s correction was applied when comparing data with unequal variances. Code availability: All codes used in this study are available, with restrictions, by contacting the corresponding author.
PIK3CA mutation analysis
A PNA-Clamp PIK3CA Mutation Detection Kit (Panagene, PNAC-4001), was used to detect PIK3CA mutations in primary breast tumor samples, according to the manufacturer’s instructions. Briefly, DNA was extracted from 10 consecutive sections of 10 μm thickness tissue from FFPE blocks using the QIAamp DNA FFPE tissue kit (QIAGEN, 56404). Mutations in exon 9 (helical domain) and exon 20 (kinase domain) of PIK3CA were assessed. More specifically, reactions were performed using 10 ng DNA with a SYBR Green PCR reaction premix and primer premixes detecting E542, E545, Q546 and H1047 mutations using the TProfessional Thermocycler (Analytik Jena Biometra). The following cycle reactions were used: pre-denaturation for 5 min at 94 °C, followed by 40 cycles of 30 s at 94 °C (denaturation), 20 s at 70 °C (peptide nucleic acid clamping), 30 s at 63 °C (annealing) and 30 s at 72 °C (extension).


留言 (0)