
記住我


Experiments 1 and 2 provided evidence that, in the aggregate, multiple features influence people’ judgments of what counts as self-deception. Does this pattern obtain because laypeople effectively reproduce the theoretical dispute that occurs among theorists (what we call the Disagreement View)? Or, alternatively, are participants individually torn between conflicting intuitions (what we call the Conflict View)? To discriminate between these explanations for the results thus far, we turned to a within-subjects design in which participants considered 48 consecutive cases, and each participant’s responses were modeled separately (i.e., in by-participant models).
To illustrate the analytic approach in Experiment 3, suppose we conduct an experiment with two orthogonal factors, Factors A and B. Participant i’s judgments of self-deception (sdi) may therefore be modeled as the combination of two main effects and an interaction:
sdi = ai × FactorA + bi × FactorB + ci × FactorA × FactorB + intercepti
Specifically, the a coefficient represents the main effect of Factor A while b represents the main effect of Factor B. The effect of the interaction between Factors A and B is captured by c. Finally, e represents the intercept (the judgment of self-deception, sdi, when both Factors A and B are absent).
Our approach in Experiment 3 relies on model comparison to reveal which of several statistical models best represents participants’ responses. For example, suppose Participant 1 believes that Factor A is necessary and sufficient. If so, a model of Participant 1’s responses should reveal a positive a coefficient, whereas coefficients b and c should tend to zero. Thus, the best-fitting model for Participant 1 will be:
[Model I] sd1 = a1 × FactorA + intercept1
Similarly, for Participant 2, if they believe that Factor B is necessary and sufficient, and Factor A is irrelevant, then coefficient b should be positive, whereas coefficients a and c should tend to zero. Thus, the best fitting model of her data will be:
[Model II] sd2 = b2 × FactorB + intercept2
By the same logic, for Participant 3–who believes that a case of self-deception must exhibit Factors A and B, i.e., that A and B are necessary and sufficient criteria–coefficient c (of the interaction between Factors A and B) will be a positive value whereas coefficients a and b should approximate zero. Therefore, the best-fitting model will be Model III.
[Model III] sd3 = c3 × FactorA × FactorB + intercept3
Crucially, these best-fitting models reflecting a classical conceptual structure are simple models with a single regression term, the Criterion, which takes the value of 1 when every necessary and sufficient condition is met, and a value of 0 if any condition is unmet. Thus, it would correspond to a main effect when participants apply a single necessary and sufficient criterion, or an interaction when participants’ judgments of self-deception depend on the presence of two or more necessary and sufficient conditions. In Experiment 3 we fit a logistic regression model with a Criterion term, which has the following general form:
[Classical Model]
Now, suppose that Participant 4 does not view Factors A or B as necessary. Instead, both features (A and B) independently raise the probability that Participant 4 will classify a target case as self-deception. If so, a model of Participant 4’s responses will reveal that coefficients a and b are positive, whereas coefficient c tends to zero. Thus, the best fitting model will be an additive model with two regression termsFootnote 1:
[Model IV] sd4 = a4FactorA + b4FactorB + intercept4
Thus, in Experiment 3 we also fit a logistic regression model with m similarity dimension terms (Bowman et al. 2020; Minda and Smith 2002; Zaki et al. 2003), which has the following general form:
[Prototype Model]
$$ = }\frac^^_\times_ +c}}^^_\times_ +c}}$$
Finally, the closing step of this approach was to ask whether participants’ responses (considered individually) are best fit by a classical model (involving a single criterion term) or a prototype model (involving a set of similarity dimensions).
6.1 MethodThe pre-registration for Experiment 3 can be found on AsPredicted.org at the following link: https://aspredicted.org/N5K_4FR.
6.1.1 ParticipantsOne hundred and ten native English-speaking adults were recruited on Prolific and received £2.70 for their time (Mdntime = 12 min). In line with our pre-registration, we did not exclude any observations, hence our final sample included 110 participants (53 female, Mdnage = 33.5).
In Study 3 the target sample size was set to 100 for the purpose of yielding an intuitive estimate of the percentage of participants whose responses are best fit by each statistical model.
6.1.2 MaterialsWe adapted three of the four cover stories from Experiments 1 and 2 (Beth, Betty, and Don) to the experimental conditions of Experiment 3. Combining the variables antecedent, success and cause, we designed a battery of 16 sets for 3 cases, resulting in 48 cases in total.
6.1.3 ProcedureIn a 4 (Cause: intent, motive, bias, error) × 2 (antecedent: present vs. absent) × 2 (success: present vs. absent) within-subjects design, participants viewed 3 blocks of 16 cases. In each block, participants viewed all 16 factorial combinations of a particular scenario. Scenario blocks were presented in a randomized order across participants, and scenario was treated as a random effect.
After each case, participants answered the question “Is this a case of self-deception?” by selecting a “Yes” or “No” response. Unlike Experiments 1 and 2, where a sliding scale was employed, in this study we opted for a dichotomous response to minimize the time and effort demanded from participants, given the increased number of cases they were asked to classify. At the end of the study, participants provided basic demographic information about their gender and age.
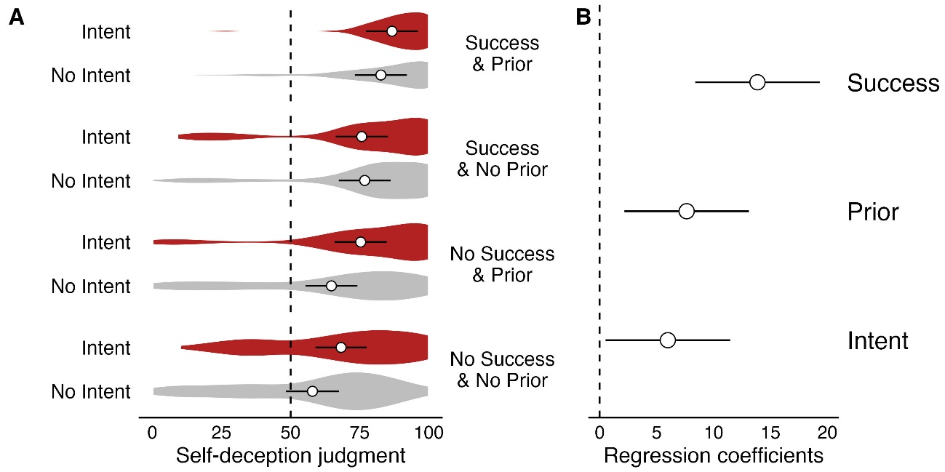
6.2 ResultsTable 5 reports proportions of self-deception judgments in each experimental condition. In a mixed-effects logistic regression, we examined the effects of cause, antecedent belief, and success on perceptions of self-deception. The aggregate analysis showed significant main effects of prior belief, χ²(1) = 127.12, success, χ²(1) = 1247.60, and cause, χ²(3) = 282.15, all ps < 0.001. Additionally, we found significant interactions between antecedent belief and success, χ²(1) = 52.74, and between success and cause, χ²(3) = 40.06, both ps < 0.001.
The interaction between success and cause revealed that mental states had a greater effect with success than without: When agents did not acquire a false yet congenial belief, intent raised self-deception judgments above the remaining levels of cause (all ps < 0.001), whereas the remaining mental states did not differ (ps > 0.20). When agents succeeded in acquiring the congenial belief, the levels of cause were all differentiated: self-deception judgments were more likely with intent than with motive, with motive than with bias, and with bias than with error (all ps < 0.001). Thus, as in Experiments 1 and 2, in the aggregate, the pattern of aggregate results revealed that all three factors (prior belief, mental cause, and success) influenced judgments of self-deception. To understand whether this aggregate pattern reflected interpersonal disagreement or intrapersonal conflict, we turned next to the analysis of each individual participant’s responses.
Table 5 Descriptive statistics for experiment 3: proportions of self-deception judgmentTo understand whether participants’ judgments revealed a classical structure (involving necessary and sufficient criteria) or a prototype structure (involving the summation of multiple similarity dimensions), we conducted a series of by-participant logistic regression models, and compared their model fit using the AIC fit index.
First, we fit a series of classical models to each participant, akin to Models I, II and III. In model comparisons against the null model, we obtained evidence that classical models of self-deception improved fit to the data for 105 out of 110 (95%) participants. Second, we fit a series of prototype models to each participant’s responses, stipulating varying sets of similarity dimensions, defining the probability of a self-deception judgment as the sum of weighted similarity dimensions–akin to Model IV. In model comparisons against the null model, we obtained evidence that prototype models of self-deception judgments improved fit to the data for 101 out of 110 (92%) participants. Table 6 reports AIC, accuracy and McFadden’s r2 of the best-fitting by-participant classical and prototype models.
Table 6 Best-fitting By-Participant models: AIC, accuracy and McFadden’s r2To establish whether a participant’s best-fitting classical model or their best-fitting prototype model provided significantly better fit to the data, we employed the convention that reductions in AIC greater than 2 provide evidence of improved model fit. This approach revealed that the prototype model provided better fit for 49 of 110 participants (45%), whereas the classical model yielded improved fit for 13 of 110 participants (12%), and the remaining 48 participants (44%) had an absolute difference in AIC between classical and prototype models smaller than 2 (see Fig. 3). In sum, a minority of participants applied a classical concept of self-deception (with necessary and sufficient criteria), while a majority applied a prototype concept (with two or more independent similarity dimensions).
Fig. 3
Best-Fitting Prototype versus Classical Model Comparisons: Differences in Akaike Information Criterion, r2 and p-values obtained by conducting a J-test (R. Davidson and MacKinnon 1981). Shaded dots represent statistical significance of the prototype and classical models according to parallel J-tests
We additionally conducted a J-test for each participant (R. Davidson and MacKinnon 1981) to compare the non-nested (i.e., prototype and classical) models. To perform a J-test, we first obtain the predicted values from the best-fitting classical model. These predicted values are then included as an additional predictor in the best-fitting prototype model, creating an augmented model within which the best-fitting prototype model is nested. With this inclusion, a conventional nested model comparison, i.e., the likelihood ratio test, is employed to compare the augmented model to the best-fitting prototype model. Evidence of improved model fit in the augmented model suggests that the best-fitting classical model predicts unique variance that is not captured by the best-fitting prototype model. The procedure is then mirrored by entering the predicted values from the best-fitting prototype model as an additional predictor in the best-fitting classical model.
The J-tests revealed a convergent pattern of results: For 64 (58%, 95% CI [48%, 67%]) participants, the J-test provided evidence that the prototype model significantly improved model fit by comparison to the classical model. Meanwhile, the corresponding J-test assessing whether the classical model improved model fit when compared to the prototype model was significant for only 35 (32%, 95% CI [23%, 41%]) participants. The results of the J-tests are displayed in Fig. 3.
To visually inspect the differences between prototype-based and classical concepts of self-deception on the classification task, we selected the three most popular prototype and classical concepts and plotted the observed and predicted probabilities in each of these six subgroups for all sixteen cases in ascending order (in Fig. 4). In the prototype concept groups (see Fig. 4, top row), we observe a gradual increase in self-deception judgments, resulting from the additive effects of multiple similarity dimensions. For example, one of the prototype models treated (i) prior belief, (ii) bias, (iii) intent, and (iv) success as similarity dimensions (middle column); and this model fit the data to 10 participants:
p(SD) =
This model assigned the most weight to the success dimension, followed by bias and intent, and the least weight to having a prior belief. The model predicted a p(SD) of 0.01 when the target lacked every attribute, and a p(SD) of 0.98 when it shared every attribute with the prototype.
In the classical concept groups (see Fig. 4, bottom row), the best-fitting models predicted an abrupt increase in self-deception judgments. This increase occurred when going from cases perceived to lack any necessary features of self-deception to cases that meet the necessary and sufficient conditions. Self-deception judgments were below the midpoint when the necessary and sufficient conditions are absent, and above the midpoint when they are present. One such model stipulated that (i) bias and (ii) success are necessary and sufficient criteria (left column); and this model fit the data to 9 participants:
Thus, the model predicted a p(SD) of 0.15 when the necessary and sufficient criteria were unmet, and a p(SD) of 0.80 when they were met.
Fig. 4
Observed and Predicted Probabilities of Self-Deception Judgment by Case
6.3 DiscussionThe purpose of Experiment 3 was to investigate whether the partial support for competing philosophical theories of self-deception is best understood as the result of interpersonal disagreement or intrapersonal conflict. Our findings revealed that only a minority of participants’ responses were better explained by classical models specifying the necessary and sufficient conditions of self-deception as a single criterion term. This, in turn, suggests that the phenomenon yielding the partial empirical support for competing theories observed in Experiments 1 and 2 is not interpersonal disagreement.
Most participants’ responses were better explained by an additive model of self-deception inspired by previous work on prototype concepts. One implication of this prototype model, as described above, is that various combinations of features can generate cognitive conflict, understood as an approximately equal probability of classifying versus not classifying the case as an instance of self-deception. (Specifically, this would be expected to happen when the summation of similarity weights plus the constant c approaches zero.) In turn, this intrapersonal conflict, when the evidence in favor and against a self-deception judgment is approximately equally strong, may resemble wavering support for competing intuitions and, in the aggregate, provide partial support for competing theories (as documented in Experiments 1 and 2).
留言 (0)