
記住我


This study analyzed data from a sub-cohort nested in the ongoing birth cohort, the Shanghai Preconception Cohort (SPCC). Briefly, SPCC was initially established to investigate the effect of parental periconceptional nutritional factors on congenital heart disease since 2016, with extension to other birth defects, child growth and development [23]. Couples attending pre-pregnancy physical examinations at Minhang district in Shanghai between March 2018 and November 2018, and met the following criteria were eligible for this cross-sectional study: (1) aged 18–45 years at enrollment; (2) planning for pregnancy within 6 months; (3) free of any genetic disorders, psychiatric diseases, hemorrhagic or hemolytic diseases, cardiovascular diseases, liver or kidney diseases, and did not have any infectious diseases recently; (4) did not take antineoplastic or antipsychotic drugs within 3 months; (5) able to follow instructions and complete the questionnaire.
Eligible participants were invited to complete 3-day dietary recalls at enrollment in this sub-cohort. Questionnaires and blood samples were collected following the whole SPCC data collection procedure. This study has been approved by the Ethics Committee of the Children’s Hospital of Fudan University, Shanghai, China (Institutional Review Board No.2016-49). Written informed consent was obtained from all participants before enrollment.
Data collectionDietary assessment was performed by an independent trained dietitian using consecutive 3-day 24-hour dietary recall. Portion-size food molds were used to assess the serving sizes. To calculate dietary intakes of folate and the relevant nutrients, the nutrient composition of each food was multiplied by the total quantity of food consumption and then summed over all food items based on Chinese Food Composition Table [24].
Data on socio-demographic characteristics, lifestyle factors were obtained through self-reported questionnaires. Trained coordinated staffs provided necessary instructions during face-to-face interviews and filled in the well-constructed questionnaires. Folic acid supplementation was recorded in detail, including the supplement brand name, daily dose, and how often the participants used supplements every month.
Venous blood samples were collected at enrollment using light-proof tubes and treated within 6 h by trained nurses following SPCC standard procedure. Samples were stored temporarily in a − 20◦C refrigerator at recruiting sites, shipped on dry ice weekly during transferring and stored in -80◦C refrigerator in the central laboratory of the Children’s Hospital of Fudan University for further biomarker assessment. Details of blood collection and storage could be found elsewhere [23]. Dietary assessment, questionnaires and blood collection of the same participant were all completed on the same day at enrollment.
Biomarker assessmentDetails of quality control on biomarker assessment were described in the previous SPCC papers [11, 23]. RBC folate, serum folate (in the form of 5-methyltetrahydrofolate), serum homocysteine, vitamin D, vitamin B12 and serum ferritin were measured in the central laboratory of the Children’s Hospital of Fudan University. All six biomarkers were analysed using electro-chemiluminescent competitive protein binding assays (ARCHITECT i2000SR Analyzer; Abbott Laboratories, USA). External quality control was conducted with the control laboratory data programme from Abbott Laboratories (Abbott Laboratories, Shanghai, China).
Genomic DNA extraction and genotypingGenomic DNA was extracted from 2 mL of EDTA anticoagulated whole blood sample using a magnetic bead-based kit (TGuide M16 Automatic Nucleic Acid Extractor (OSE-M16); Tiangen Biotech (Beijing) Co., China).
The genotyping of 8 key single nucleotide polymorphisms (SNPs) reported in association with one-carbon metabolism, and/or circulating folate and homocysteine, for MTHFR 677 C/T (rs1801133) and 1298 A/C (rs1801131), MTR 186 T/G(rs28372871) and 2756 A/G (rs1805087), MTRR 66 A/G (rs1801394) and c.56 + 781 A/C(rs326119), MTHFD1 1958 G/A(rs2236225), BHMT G/A(rs3733890) polymorphisms were performed using the TaqMan allelic discrimination assay on the platform of QuantStudio Real-Time PCR software (Applied Biosystems) with standard quality control. Between November 2022 and January 2023, genotyping of 5 other SNPs for FIGN C/G (rs2119289), SHMT G/A (rs1979277), RFC1 T/C (rs1051266), MTHFR G/A (rs3737965), MTR G/A (rs1131450) was further performed using the remaining blood samples.
Allelic and genotype frequencies for each SNP were based on reference value in East-Asian population in 1000Genomes study using online database [25]. SNPs genotyping failed in some participants because of a limited sample volume. Detailed SNPs information can be found in Table S1.
Potential covariatesData on Socio-demographic factors (age, sex, BMI, education level, occupation, smoking and alcohol drinking status), folate intake (food folate intake, total energy intake and folic acid supplementation), serum folate(ng/ml) and SNPs were chosen priori as candidate covariates affecting RBC folate level. Age was measured in years. BMI was calculated as weight in kilograms divided by height in meters squared (kg/m2). Education levels were categorized as high school or lower, diploma or bachelor and postgraduate degrees. Occupations were categorized as blue collar, white collar, farmer and others. The status of smoking, alcohol drinking and folic acid supplementation was summarized as binary (yes or no) within three months before enrollment. Total energy intake was included for dietary folate adjustment using the residual method [26]. Daily intake of total energy (kcal/d) and dietary folate(mg/d) was obtained by averaging the total amount from 3-day dietary recall. Food folate intake was also summarized as different threshold levels by every 100 mg/d increase. Dietary folate equivalent was obtained by multiplying the average supplemental folic acid intake by 1.7 and added to dietary folate intake. SNPs were coded as per risk allele increased (i.e. 0 for homozygote with the common allele, 1 for the heterozygote, and 2 for homozygote with the rare allele). The weighted joint effect of 8 SNPs and 13 SNPs were calculated by using Polygenic genetic risk scores (PG-GRS) [27], as the sum of weights for each allele corresponding to estimated genetic effect sizes of the associations between the SNP and RBC folate [28]. Because MTHFR 677 C/T (rs1801133) and 1298 A/C (rs1801131) are two genetic variants that showed most consistency in terms of the effect on blood levels of folate [16,17,18,19], these two were chosen as an independent covariate other than PG-GRS.
Statistical analysisDescriptive statistics were performed in total and by sex. Characteristics of study participants was expressed as the mean (standard deviation) for normally distributed variables, median (inter-quartile range) for skewed variables and frequency with percentage for categorical variables. Group comparisons were performed by two-sample t-test, Kruskal Wallis test and chi-square test respectively. P-value of < 0.05 was considered as significant group difference. Validation of blood biomarkers was assessed by pairwise correlations (Table S2).
Hierarchical linear regression was applied for covariate selection as RBC folate concentration being the dependent variable. Before fitting the model, assumptions that underpin multiple regression and linearity were tested as priori. Serum and RBC folate concentration was log-transformed to reach the normal distribution. RBC folate concentration was further normalized as the z-score within the sub-cohort for generalizability in the whole cohort. Dietary folate was included as categorical variable (1,>=100and < 200; 2, >=200and < 300; 3,>=300and < 400; 4,>=400). Unfortunately, dietary folate equivalent was not included for analysis because we found the supplemental folic acid intake was highly inaccurate as most of them did not take the supplementation or take it occasionally that had a poor memory about the true frequency of consumption. Thus, folic acid supplementation use (yes or no) was included instead.
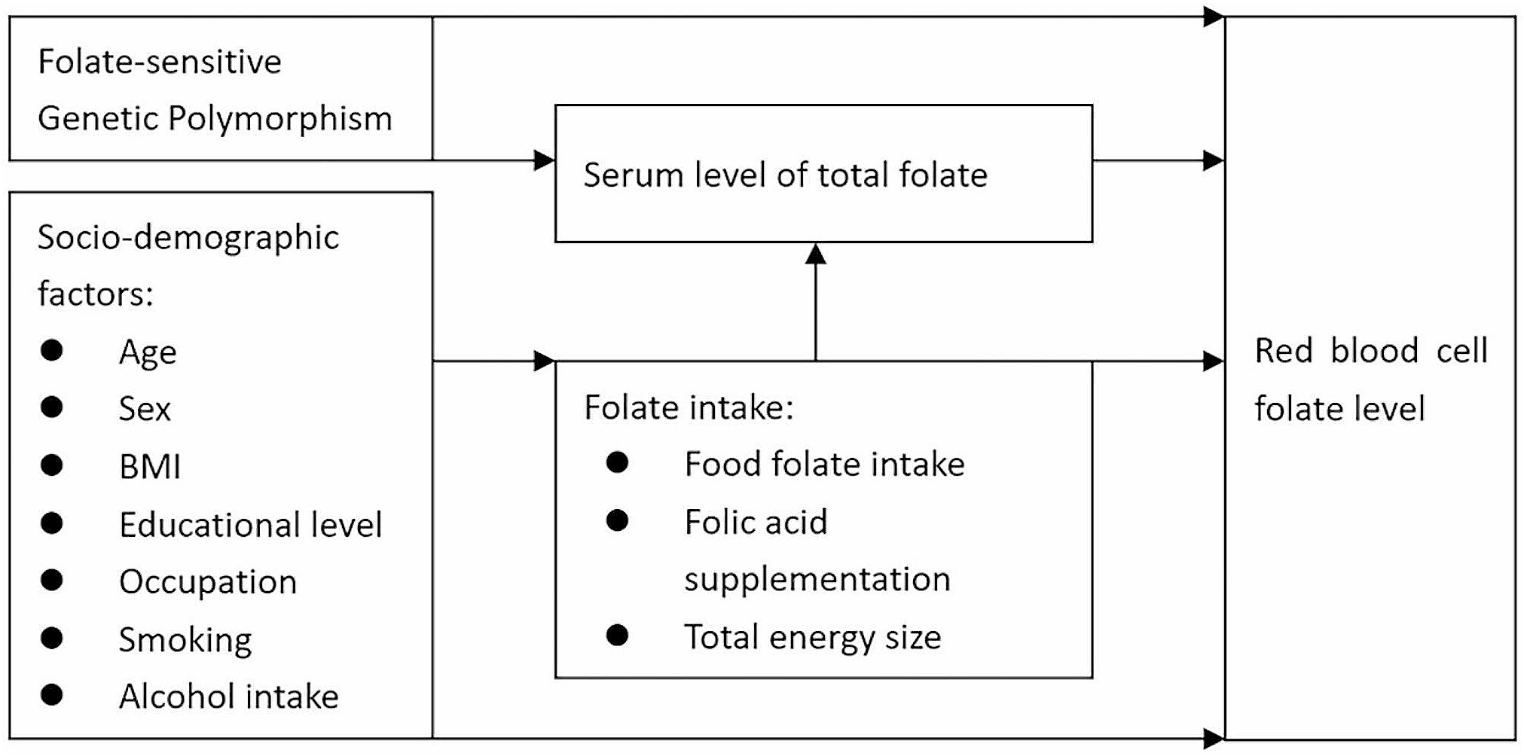
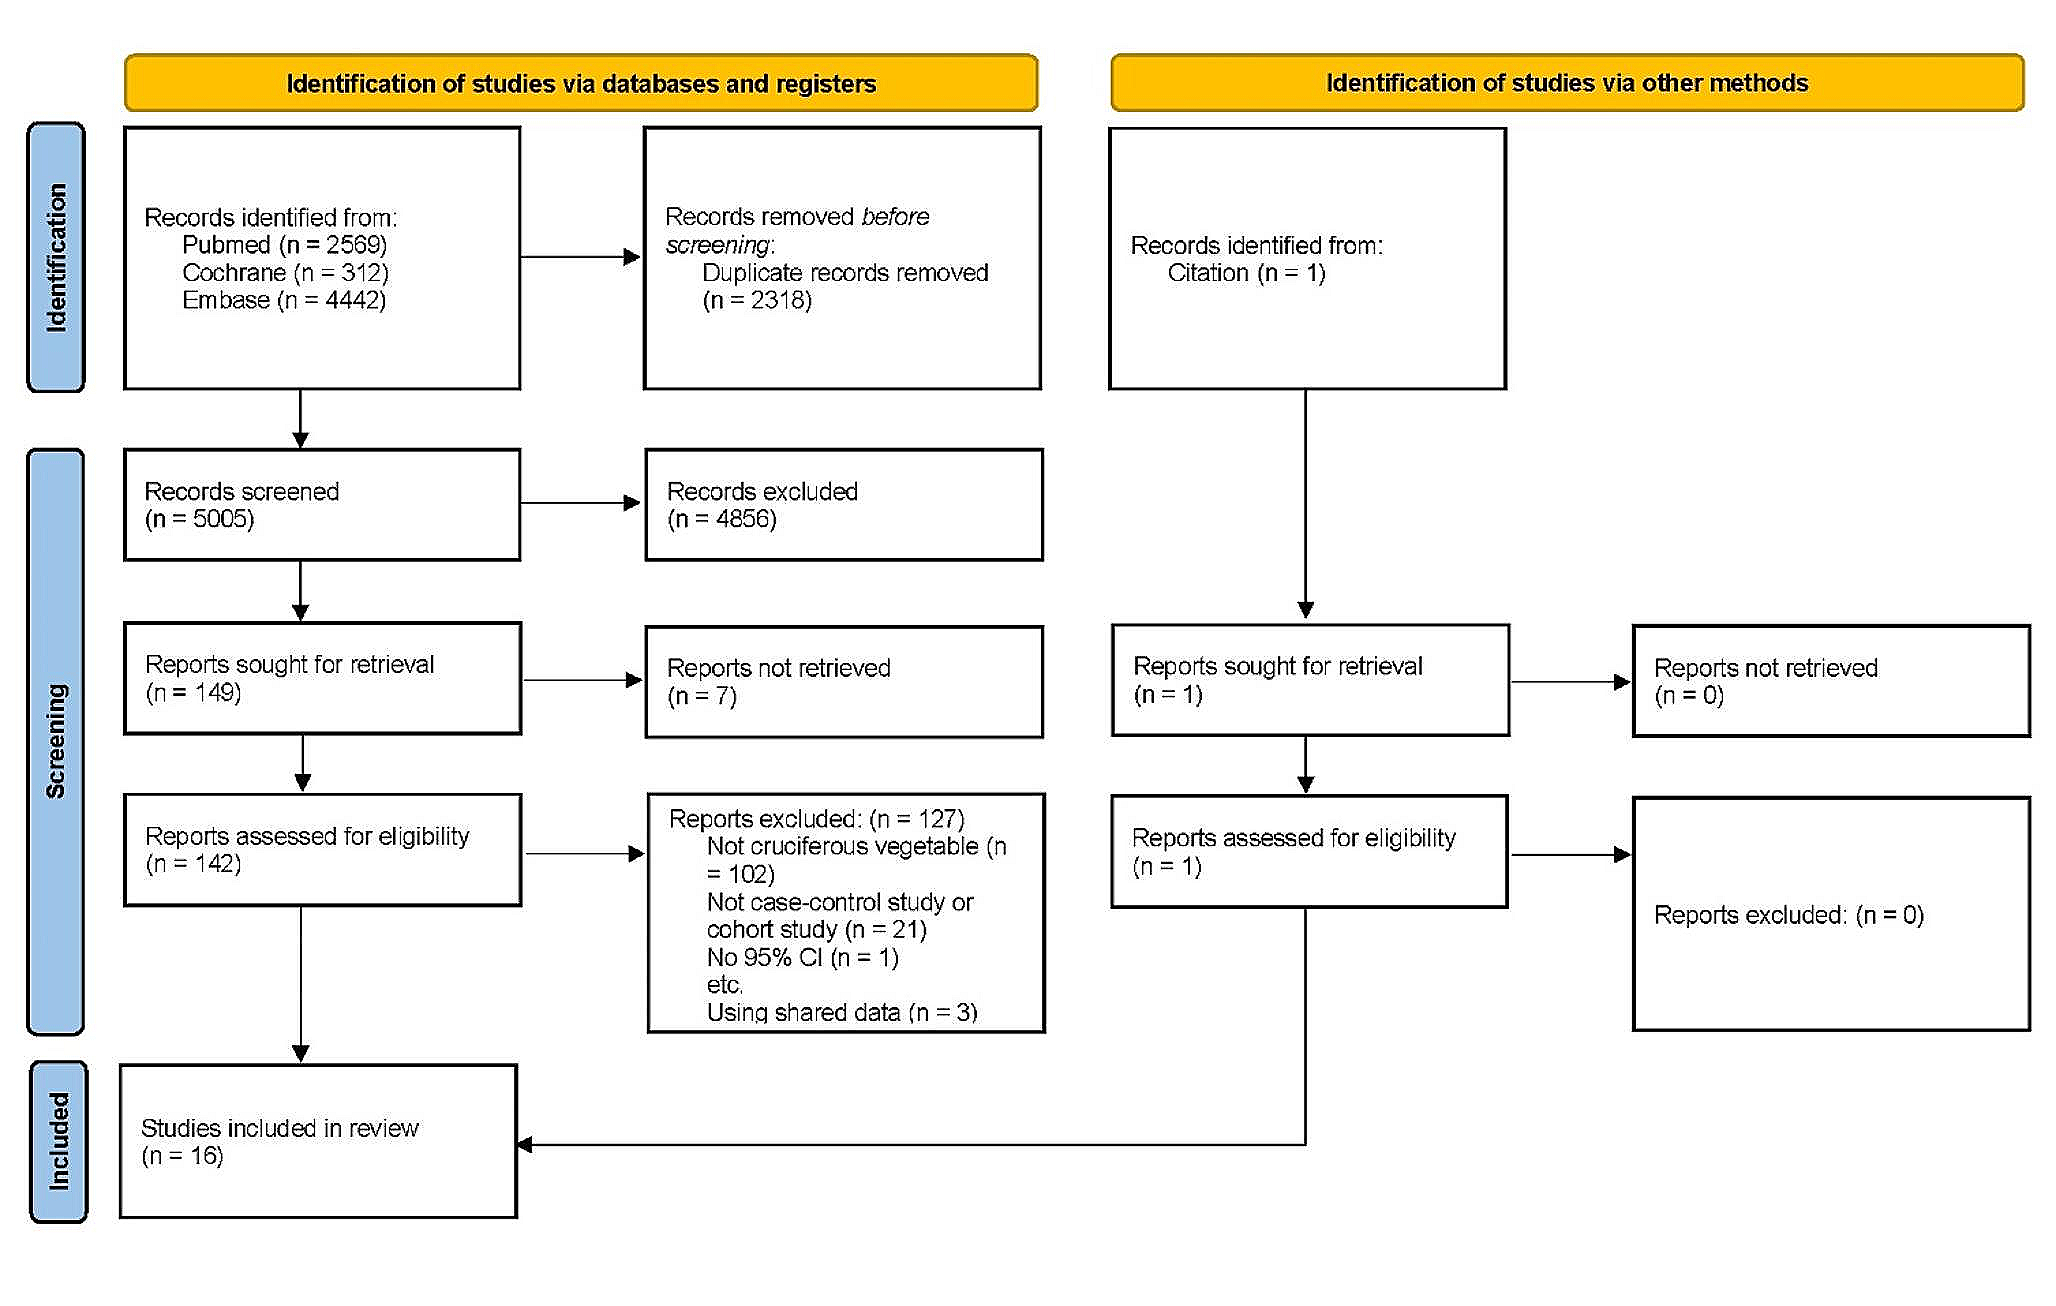
Hierarchical regression analysis allowed hierarchical selection for determining the forward inclusion of covariates [29]. Before then, a theoretical framework, including four blocks of factors associated with RBC folate level (Fig. 1) has been built based on the authors’ background knowledge and previous similar frameworks [30, 31]. The contribution of four blocks of covariates was identified step by step in explaining RBC folate level. The significant level was set at 0.05/4 = 0.0125, because four hierarchical regression models were performed during forward inclusion of blocks (block 1; block 1 + 2; block 1 + 2 + 3; block 1 + 2 + 3 + 4). Socio-demographic factors were entered as covariates in the first block, factors of folate intake were placed in the second block. Serum level of folate was included in the model as the third block and folate-sensitive genetic polymorphisms were the fourth block. Within the block, the variables were entered simultaneously. By fitting additional regression models, R-squared were used for comparisons between models to see if the latter performed better than the former model. After covariate selection, generalized linear model was used for prediction, as hierarchical regression only allowed continuous variables that might mask the true contribution from specific category in factor variables. A post-hoc analysis including generalized linear model and Bland-Altman plot [32, 33] was used for validation in another sub-cohort, which recruited participants from Kunshan city in China, if applicable.
Fig. 1
Theoretical framework of factors associated with RBC folate level in this study
To further check consistency of the findings, we considered a sex-stratified analysis, as well as missing data handling. We hypothesized a missing at random(MAR)missingness mechanism for incomplete data. Multiple imputation(MI) using chained equations (arbitrary missing pattern with 10 imputations) on missing data was conducted as sensitivity analysis for the main generalized linear models after covariate selection. The MI analyses were conducted applied to all the chosen covariates in the analysis model, imputed using either linear or ordered logistic regression, as applicable, dependent on other remaining covariates excluded from hierarchical selection.
We did not adjust for multiple testing in this study. The data analysis was performed through STATA (Version 15.1, StataCorp L.P., and College Station, TX).
留言 (0)