
記住我
Bullfrog belongs to Amphibia, Frog family, native to North America, is an aquaculture animal with high efficiency in producing high quality protein, which was introduced to our country from Cuba in the 1960s. Because of its short breeding cycle, water-saving and energy-saving, low investment, high yield, low technology content and other characteristics, bullfrog farming is prevalent in coastal areas of China, such as Fujian, Guangdong, Zhejiang, etc. Meanwhile, food and beverage enterprises gradually began to use bullfrog products. At the same time, various catering enterprises gradually began to use bullfrog products, forming a good situation of production and marketing, and many large-scale bullfrog farms have appeared in the country since 2010. With the development of domestic bullfrog catering and demand, superimposed on policy assistance, China’s bullfrog supply continues to grow, and become an important aquaculture species. 2022, the national bullfrog whole industry chain scale of nearly 100 billion yuan.
However, due to the lack of operable industry standards and regulation, the abuse of anti-disease drugs (Casali et al., 2005), serious pollution of aquaculture water and environmental degradation, it leads to overloading of the liver, intestines and other digestive organs of bullfrogs and abnormal lipid metabolism, which results in excessive accumulation of liver and abdominal fat, damaging the liver, gallbladder and intestinal organs, and causing diseases such as liver enlargement, hepatitis, enteritis, etc (Keum Taek et al., 2002), which seriously restricts growth and development of bullfrogs and even kills them in serious cases (Wei et al., 2023). Among them, abnormalities of hepatic lipid metabolism in bullfrogs have become a major obstacle to the development of bullfrog farming, causing great losses.
Glutathione is a tripeptide containing a y-amide bond and a sulfhydryl group, and consists of glutamic acid, cysteine and glycine, with the sulfhydryl group on cysteine as its active group. Glutathione has two main forms: reduced glutathione and oxidized glutathione. The ratio of reduced to oxidized glutathione (GSH/GSSG) is often used as a factor to assess cellular antioxidant capacity or cytotoxicity (Hamre et al., 2024). Reduced glutathione is the main state of existence, accounting for about 95% of the total, and is involved in glucose metabolism and the tricarboxylic acid cycle in the body. It can activate a variety of enzymes, such as sulfhydryl (-SH) enzymes - coenzymes, and thus affects the metabolism of sugars, proteins, and fats in the body (Alschuler, 2011). Glutathione can scavenge oxygen free radicals, antioxidant, detoxification and enhancement of immunity (Tsugawa et al., 2019).Glutathione has certain effect on the treatment of liver disease. The abnormalities of liver lipid metabolism in bullfrogs are mainly due to drug liver injury caused by overdosing and indiscriminate use of drugs. The main mechanism of drug induced liver injury is due to the toxicity of the drug itself and the immune reaction, most of the drugs are transformed by hepatocytes, and normal medication will not cause liver injury, but after overdose, a large number of drugs are transformed into water-soluble metabolites by hepatocytes, and the generation of these substances will greatly consume the glutathione in the hepatocytes, resulting in hepatocellular necrosis, and the exogenous glutathione can reduce the toxicity of the drug and the immune reaction, which will cause the liver cell necrosis. Supplementation of exogenous glutathione can reduce the toxic reaction of the drug as well as the immune response, thus playing a role in protecting hepatocytes. In addition, glutathione is also involved in many cellular metabolic activities (Semenova et al., 2022). Studies have shown that an imbalance of glutathione metabolism in the body will directly affect the health of the body, such as Alzheimer’s disease, Parkinson’s disease, cancer (Dirican et al., 2024), chronic liver disease and so on are related to it (Cosar et al., 2024). Studies have shown that exogenous glutathione can be extracted from yeast and plants by solvent extraction, fermentation, chemical synthesis and enzyme synthesis, and it can be used to treat and prevent liver and kidney injury as well as for the recovery of cancer patients after chemotherapy (Cai et al., 2024a). At the same time, glutathione has an inhibitory effect on a variety of viruses.
Although bullfrogs have been cultured in captivity for a long time, there is a gap in the study of bullfrog diseases, especially the study of hepatic lipid metabolism part. Therefore, on the basis of previous studies, this study investigated the therapeutic effects of glutathione on bullfrogs with abnormal hepatic lipid metabolism from the perspective of hepatic lipid metabolism and serum metabolomics, which will provide a reference for future in-depth research on the mechanism of glutathione’s action. We hope to provide technical support for the development of glutathione-related products and their rational application in bullfrog green and healthy aquaculture production, so as to reduce the abuse of antibiotics and contribute to food safety and environmental safety.
2 Materials and methods2.1 Test materialsGlutathione was provided by Angel Yeast Co.,Ltd.
Healthy bullfrogs and bullfrogs suffering from abnormal fat metabolism used in this study were purchased from Guanxing (Zhaoqing) Agricultural Science and Technology Co.
2.2 Experimental design and feeding managementThe aquaculture experiment was conducted at the Digital Fisheries Farm of Stargazer Agriculture. One hundred healthy bullfrogs and 200 bullfrogs with abnormal fat metabolism were selected to be temporarily reared for 2 weeks before the start of the experiment, during which the bullfrogs were fed basic feed twice a day to acclimatize them to the feed and culture environment. At the end of the temporary rearing period, we stopped feeding for 24 h. We selected 80 healthy bullfrogs with uniform size as the healthy group NC, and 50 bullfrogs with bacterial enteritis as the pathological group FI and the treatment group GSH. The initial weight of the test bullfrogs was (75 ± 5) g. The three experimental groups were cultured for 20 days and recorded. The water level of the tanks was three centimetres, the water temperature was 22°C, and the tanks were fed twice a day, with 0.5 g of glutathione per 100 g of feed for the GSH group, and the tanks were changed and cleaned 30 min before feeding. Observations were made in the morning, afternoon and evening of each day during the culture period to record the food intake, activity and mortality of the bullfrogs.
2.3 Sample collectionDuring the culture period, three bullfrogs were dissected from each group every 5 days to observe their gastrointestinal condition. After 20 days of culture, 14 bullfrogs were taken from each tank separately and executed by double destruction of medulla. The livers of 7 bullfrogs were dissected and some of them were fixed in Bern’s solution for liver morphology analysis. The remaining livers were put into sterilized cryopreservation tubes and quickly stored in liquid nitrogen for liver metabolomics analysis and metabolic enzyme activity determination. The other 7 bullfrogs were injected into 1.5 mL centrifuge tubes with a 1 mL syringe, and then centrifuged at 4°C for 10 min (12000 r/min, 4°C) after 24 h. The serum was separated and stored at -80°C for biochemical and metabolomic analyses.
2.4 Analysis of index measurements2.4.1 Liver histomorphometric analysisLiver tissues of 0.5 cm3 each were removed from Bourne’s fixative, dehydrated with different concentrations of alcohol using a biological tissue automatic dehydrator (KD-TS3A), paraffin-embedded tissues, trimmed the solidified wax blocks, and sliced with a tissue slicer (model: RM2235 slicer produced by leica, Graaf, Germany) with a thickness of 6 μm; the slices were deparaffinized and stained with hematoxylin a After deparaffinization, the slices were stained with hematoxylin and eosin (H.E.), and the slices were sealed and observed and photographed with an orthogonal fluorescence microscope (Leica DM5500B).
2.4.2 Analysis of blood antioxidant indexesPreparation of serum: 7 bullfrogs were taken from each of the NC group, FI group and GSH group for blood sampling, placed at room temperature for 4~5 h. After precipitating the serum, the serum was centrifuged at 12 000 r/min for 10 min, and then the serum was taken and stored at -80°C for spare.
The kits were purchased from Nanjing Jianjian Bioengineering Institute, and the activities of alkaline phosphatase ALP, acid phosphatase ACP and superoxide dismutase SOD were determined according to the instructions.
2.4.3 Analysis of liver antioxidant indexesSeven bullfrogs were taken from each of the NC, FI and GSH groups for liver tissue extraction, and the livers were quickly put into liquid nitrogen after removal, and then stored in a -80°C refrigerator for the detection of liver antioxidant indexes.
The kits were purchased from Nanjing Jianjian Bioengineering Institute, and the methods for the determination of total cholesterol (TC), total bile acids (TBA), high-density lipoproteins (HDL), low-density lipoproteins (LDL), and triglycerides (TG) were in accordance with the instructions.
2.4.4 Serum full-spectrum metabolism-LCMS metabolomics analysis2.4.4.1 Pre-treatment(1) Remove the samples stored at -80°C, thaw in an ice-water mixture, and pipette 100 μL of sample into a 1.5 mL EP tube;
(2) Add 300 μL of protein precipitant methanol-acetonitrile (V:V=2:1, containing mixed internal standard, 4 μg/mL), vortex and shake for 1 min;
(3) Ultrasonic extraction in an ice-water bath for 10 min, and leave at -40°C overnight;
(4) Centrifuge for 10 min (12000 rpm, 4°C), aspirate 150 μL of the supernatant with a syringe, filter it using a 0.22 μm organic phase pinhole filter, transfer it to an LC injection vial and store it at -80°C until LC-MS analysis.
(5) Quality control (QC) samples were prepared by mixing equal volumes of extracts from all samples.
(6) Note: All extraction reagents were pre-cooled at -20°C before use.
2.4.4.2 Liquid chromatography-mass spectrometry analysis conditionsThe analyzing instrument was a liquid-mass spectrometry system consisting of a Waters ACQUITY UPLC I-Class plus/Thermo QE ultra-high performance liquid tandem high-resolution mass spectrometer.
2.4.4.3 Chromatographic conditionsChromatographic column: ACQUITY UPLC HSS T3 (100 mm×2.1 mm, 1.8 um); column temperature: 45°C; mobile phase: mobile phase: A-water (containing 0.1% formic acid), B-acetonitrile; flow rate: 0.35 mL/min; injection volume: 3 μL. Finally, the elution gradient is shown in Table 1.
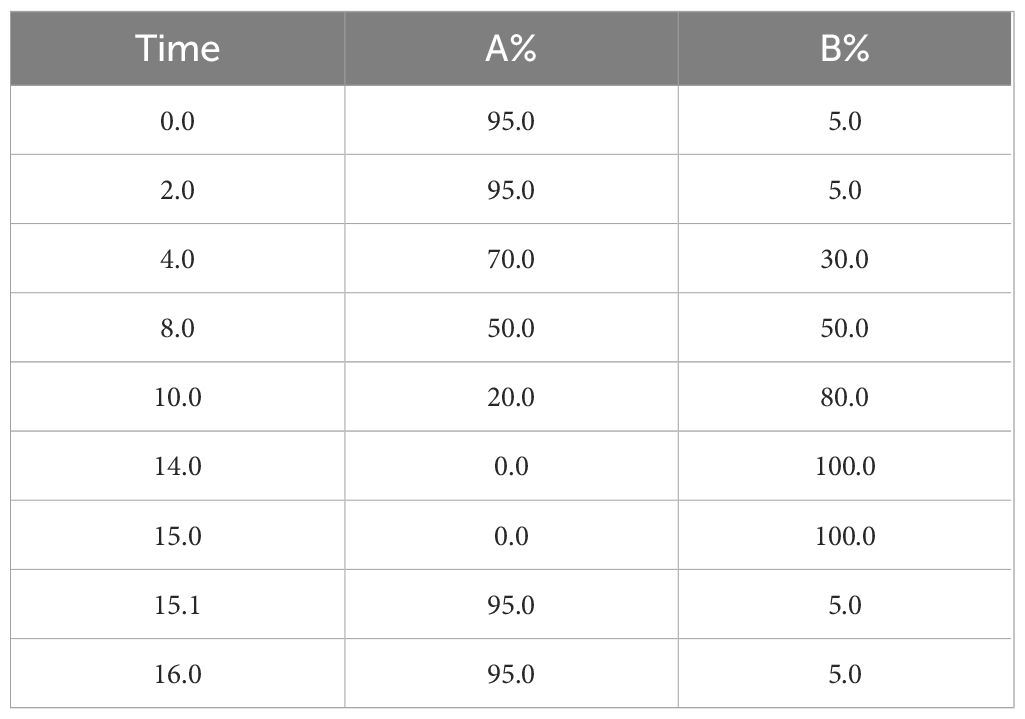
Table 1. Elution gradients.
2.4.4.4 Mass spectrometry conditionsThe mass spectrometry parameters are shown in Table 2.
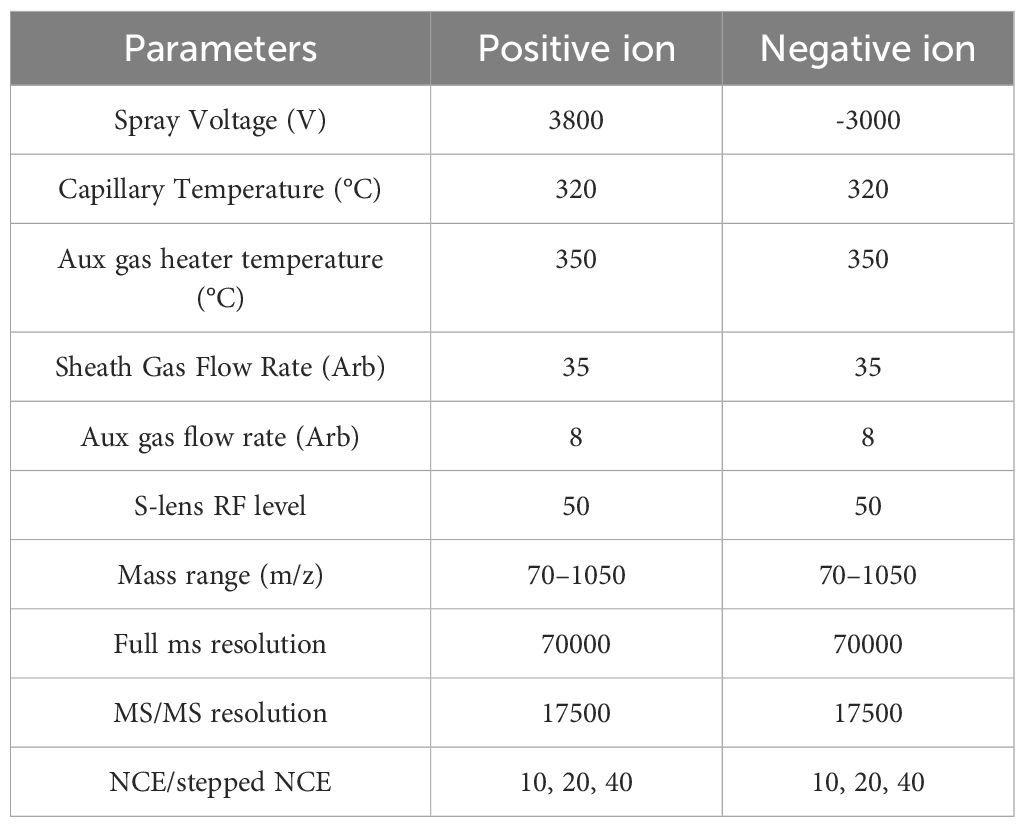
Table 2. Mass spectrometry parameters.
2.4.5 Full-spectrum liver metabolism-LCMS metabolomics analysis2.4.5.1 Pre-treatment(1) Weigh 30 mg of tissue and add 300 μL of methanol-water (V:V=1:1, containing mixed internal standard, 0.1 mg/mL, methanol configuration);
(2) Add two small steel beads, pre-cool at -20°C for 2 min, and add to a grinder (60 Hz, 2 min);
(3) Add 300 μL of chloroform, vortex for 30 s, ultrasonic extraction for 10 min, leave at -20°C for 20 min, centrifuge for 10 min (12000 rpm). Centrifuge for 10 min (12000 rpm, 4°C), take 200 μL of the lower chloroform layer into a new centrifuge tube;
(4) Add 300 μL of chloroform-methanol (V:V=2:1) into the centrifugal tube with the lower layer of solution, vortex for 30 s, and ultrasonic extraction for 10 min in an ice-water bath;
(5) After standing at -20°C for 20 min, centrifuge for 10 min (12000 rpm, 4°C), take 200 μL of the lower chloroform layer and combine with the previous 200 μL, totaling 400 μL;
(6) Take 200 μL into the LC-MS injection vial and evaporate it dry. The lipid residue in the LC-MS injection vial was redissolved with 300 μL of isopropanol-methanol (V:V=1:1), vortexed for 30 s, and sonicated with ice water for 3 min, then the solution was transferred to a 1.5 mL centrifuge tube, and left to stand at -20°C for 2 h. The solution was then centrifuged for 10 min (12000 rpm, 4°C) and centrifuged for 10 min (12000 rpm, 4°C);
(7) Centrifuge for 10 min (12000 rpm, 4°C), 150 μL of supernatant was loaded into an LC-MS injection vial with a liner tube for LC-MS analysis;
(8) Quality control (QC) samples were prepared by mixing equal volumes of extracts from all samples, and the volume of each QC was the same as that of the sample. Note: All extraction reagents were pre-cooled at -20°C before use.
2.4.5.2 Liquid chromatography-mass spectrometry analysis conditionsThe analyzing instrument was a liquid-mass spectrometer system consisting of ACQUITY UPLC I-Class plus ultra-high performance liquid tandem high-resolution mass spectrometer.
2.4.5.3 Chromatographic conditionsColumn temperature: 55°C; mobile phase A: acetonitrile: water = 6:4 (v/v, containing 10 mM ammonium acetate); mobile phase B: isopropanol: acetonitrile = 9:1 (v/v, containing 10 mM ammonium acetate); flow rate: 0.26 mL/min; injection volume: 3 μL and the elution gradient is shown in Table 3.
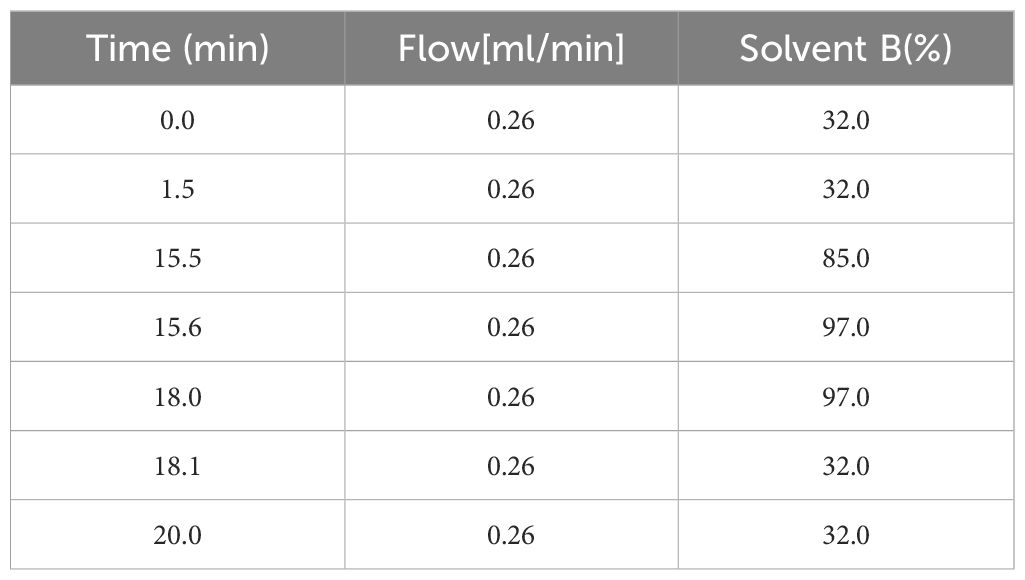
Table 3. Elution gradients.
2.4.5.4 Mass spectrometry conditionsMass spectral parameters are shown in Table 4.

Table 4. Mass spectrometry parameters.
2.5 Data analysisAll the experimental data were statistically analyzed using Excel and SPSS 26.0 software, and one-way ANOVA (one-way ANOVA) with Duncan’s multiple test was used for comparison, and the experimental data were expressed as the mean ± standard error, and the significance level was set at (P<0.05).
3 Results3.1 Effect of glutathione feeding on the survival rate of bullfrog cultureThe survival rate of bullfrogs in the experimental group was improved after 20 days of glutathione feeding to bullfrogs (Table 5), the mortality rate of the FI group reached 98.0% in 20 days, and the mortality rate of the GSH group fed with glutathione was 68.6%, which was a 29.4% reduction in the mortality rate.
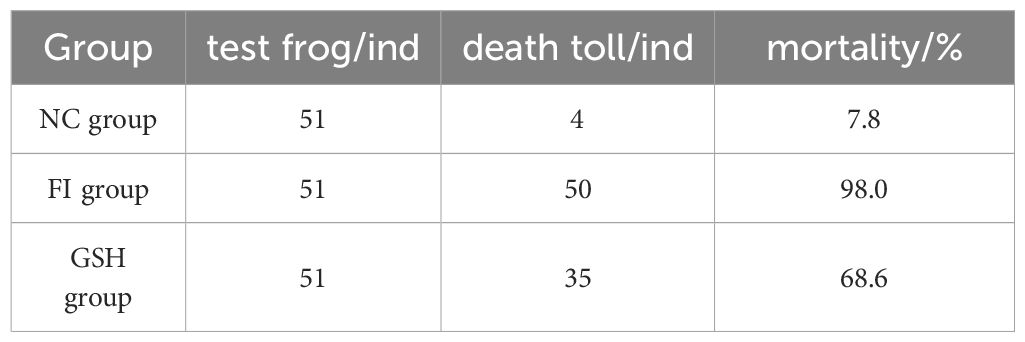
Table 5. Comparison of mortality of bullfrogs in NC, FI and GSH groups after 20 days.
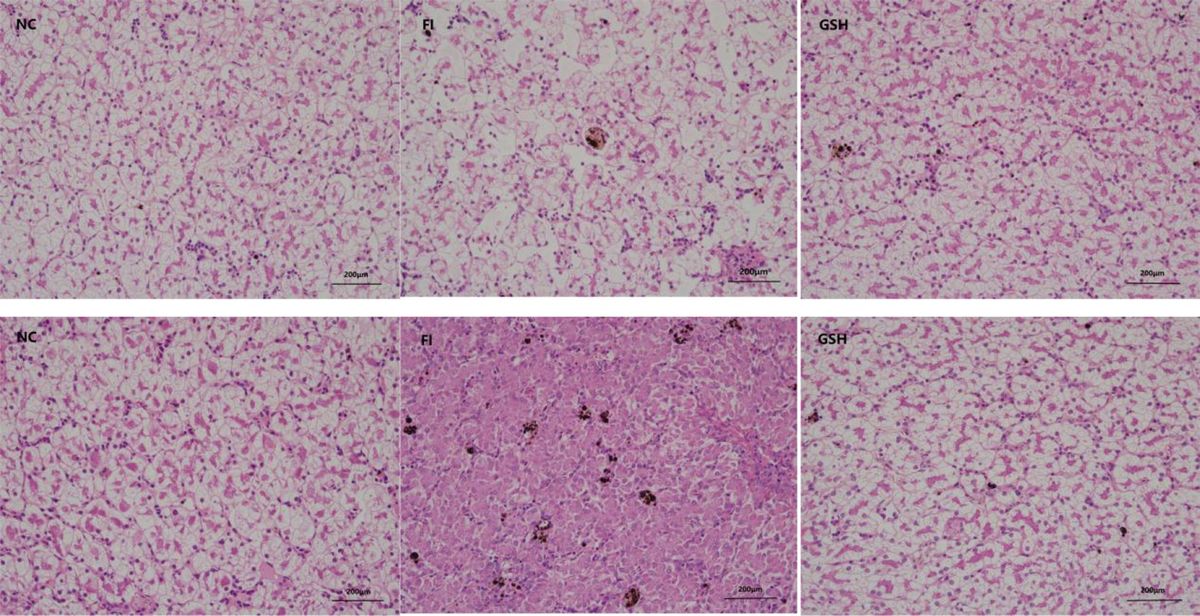
3.2 Effect of glutathione feeding on the morphology of bullfrog liverThe results of liver tissue sections in the experiment are shown in Figure 1, which shows that glutathione has some restorative and therapeutic effects on the liver of bullfrogs.
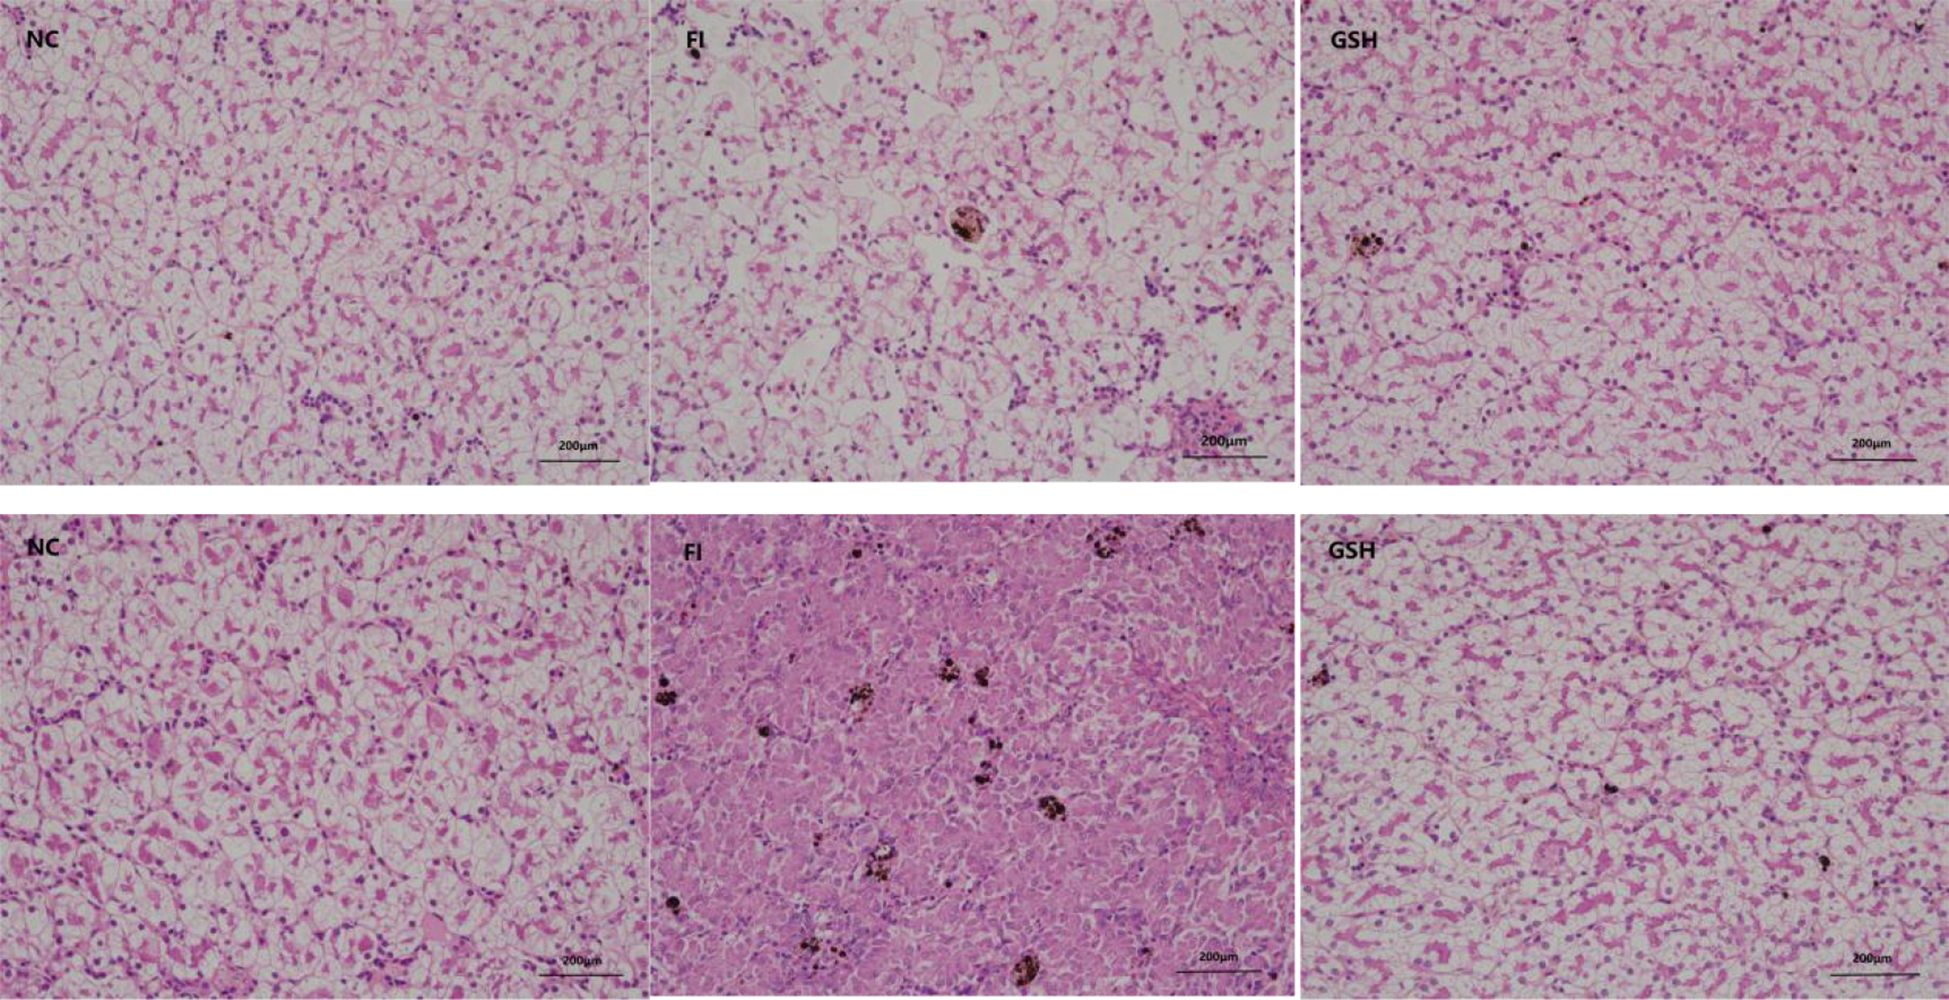
Figure 1. Three sets of bullfrog liver sections. From left to right, NC, FI and GSH groups.
3.3 Effects of glutathione feeding on the activities of immunity-related enzymes in bullfrog serumAs shown in Figure 2, SOD activity was elevated and AKP activity was decreased in the serum of bullfrogs in the glutathione group compared to the FI group. Among them, ACP activity was significantly lower than that in the FI group (P < 0.05).
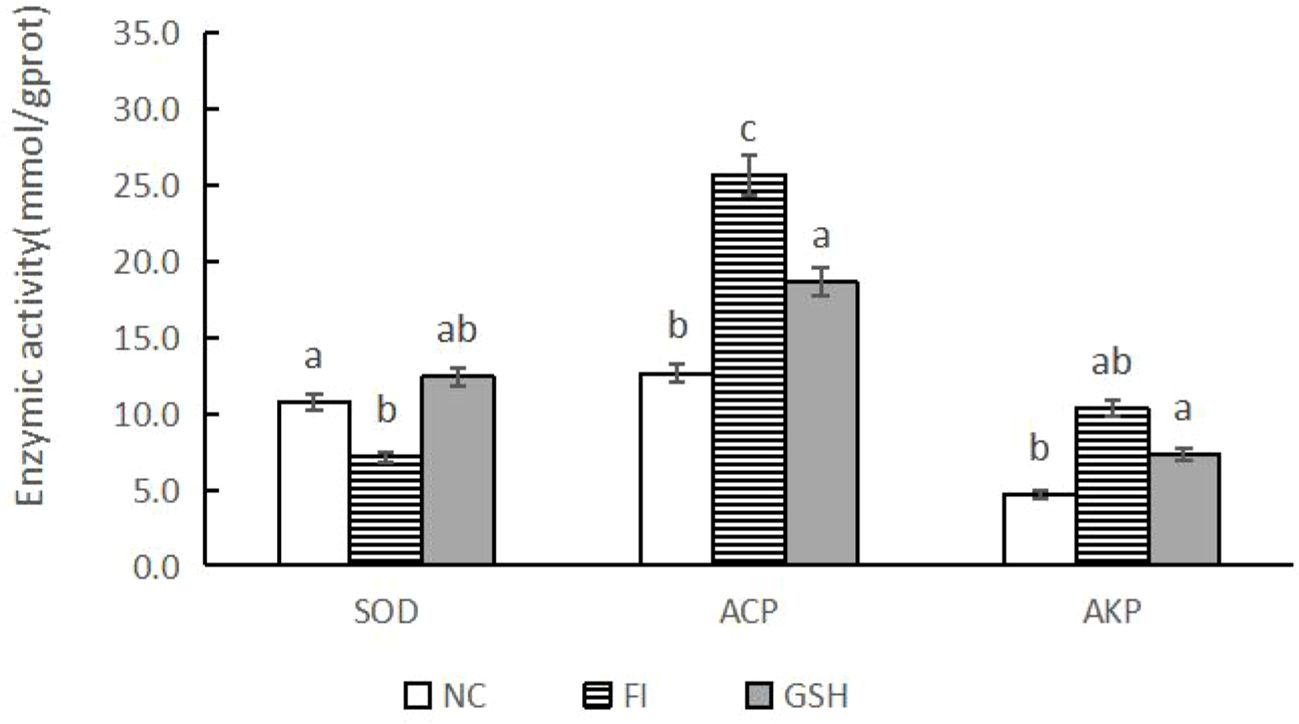
Figure 2. Serum immunometabolizing enzyme activities of bullfrogs in NC, FI and GSH groups. Different lowercase letters labeled on the columns indicate significant differences (P < 0.05).
3.4 2.4Effects of glutathione feeding on the activities of related metabolic enzymes in bullfrog liverAs shown in Figure 3, compared with the FI group, the activities of HDL-C and T-CHO were significantly higher in the liver of bullfrogs fed with glutathione; the activities of LDL-C, TBA and TG were significantly lower (P < 0.05).
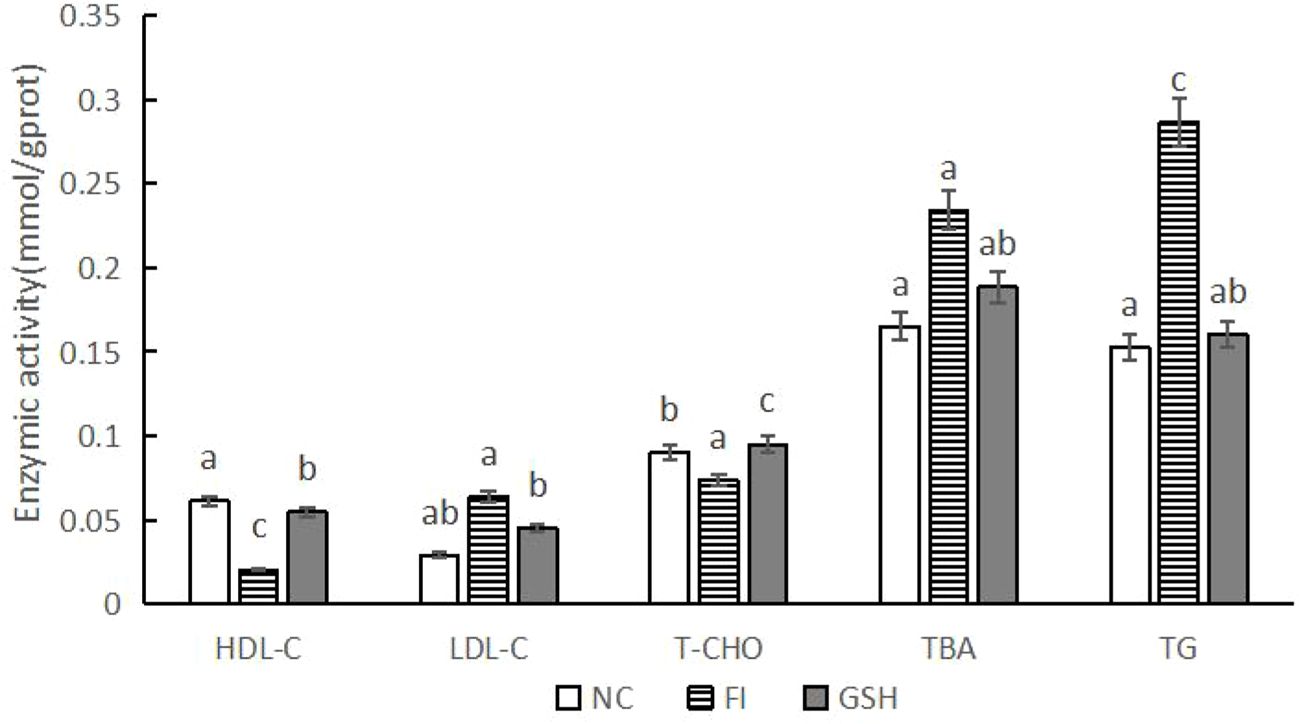
Figure 3. Hepatic lipid metabolizing enzyme activities of bullfrogs in NC, FI and GSH groups. Different lowercase letters labeled on the columns indicate significant differences (P < 0.05).
3.5 Modulation of serum metabolites in bullfrogs by glutathione mix feeding3.5.1 Sample raw data and principal component analysisPCA is an unsupervised analysis that responds to the raw data and helps to view the data as a whole. Partial Least Squares-Discriminant Analysis (PLS-DA) is a supervised discriminant statistical method that uses partial least squares regression to model the relationship between metabolite expression and sample grouping to achieve prediction of the sample category. The addition of grouping variables in PLS-DA can make up for the shortcomings of the PCA method, and the parameter R2X (cum) can be used to judge the validity of the model.PLS-DA In addition to the parameter R2X (cum), it also includes the explanation rate R2Y (cum) and the prediction rate Q2 (cum), and the closer the two are to 1, it means that the PLS-DA model can better explain and predict the differences between the two groups of samples, which represents the better the model prediction ability. As can be seen from Figures 4, the samples of NC, FI and GSH groups are all in the 95% confidence interval, and can be spatially separated uniformly without overlap, indicating that there are significant differences in metabolites between the two groups, and that they are able to be analyzed in the next step.
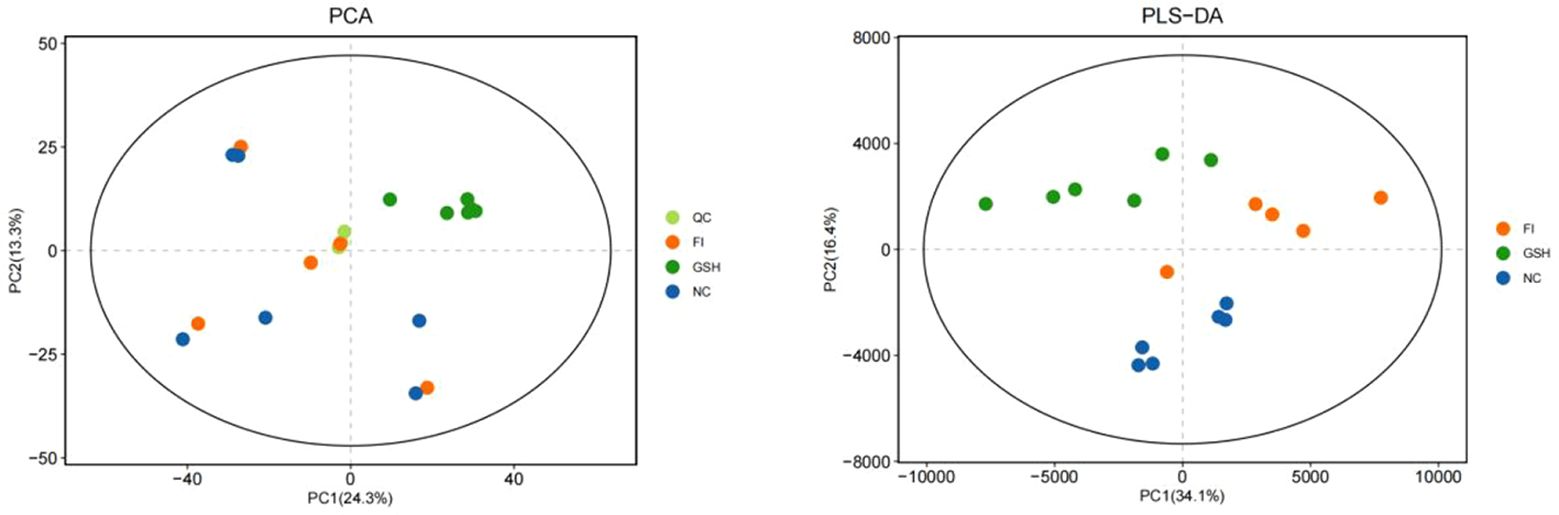
Figure 4. PCA versus PLS-DA plots of serum metabolites in the NC, FI, and GSH groups.
3.5.2 Screening of differential metabolitesA combination of multidimensional and unidimensional analyses was used to screen the differential metabolites between groups. The variable weight value (VIP) in Orthogonal Partial Least Squares-Discriminant Analysis is a measure of the expression pattern of each metabolite, the explanatory ability and depth of influence on the categorical discrimination of samples in each group, to explore meaningful differential metabolites, and then use the T-test to verify whether the differential metabolites between groups are significant. As shown in Figure 5, a total of 230 differential metabolites were screened in the NC, FI and GSH groups. As can be seen from Volcano Figure 6, the FI group up-regulated 6 differential metabolites and down-regulated 12 differential metabolites relative to the NC group; the GSH group up-regulated 48 differential metabolites and down-regulated 68 differential metabolites relative to the NC group; and the FI group up-regulated 48 differential metabolites and down-regulated 48 differential metabolites relative to the GSH group.
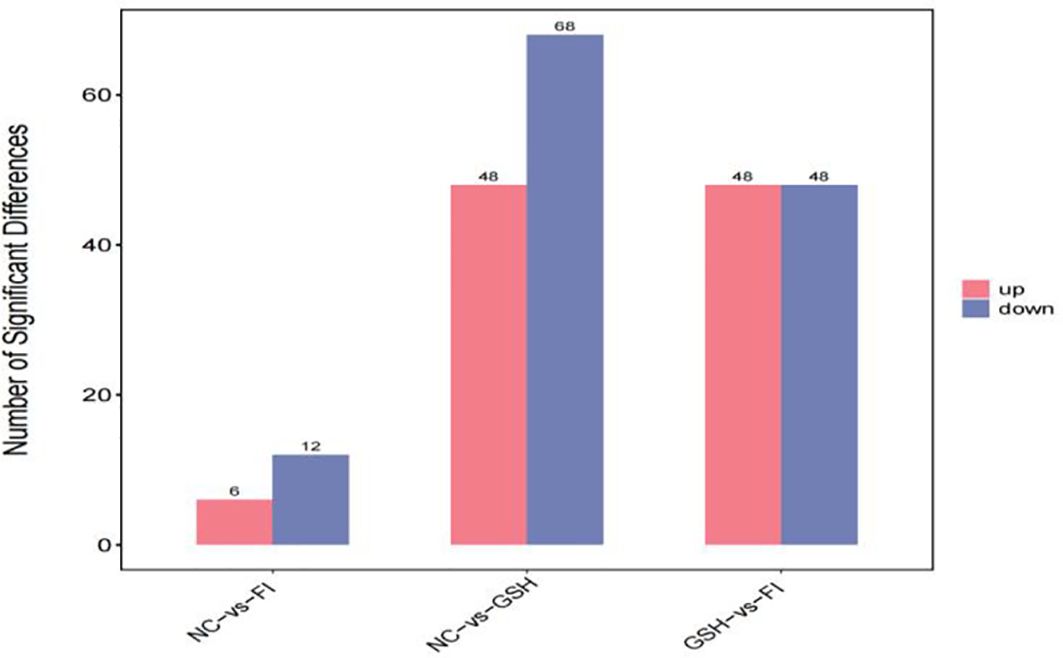
Figure 5. Differential metabolite quantity statistical chart.
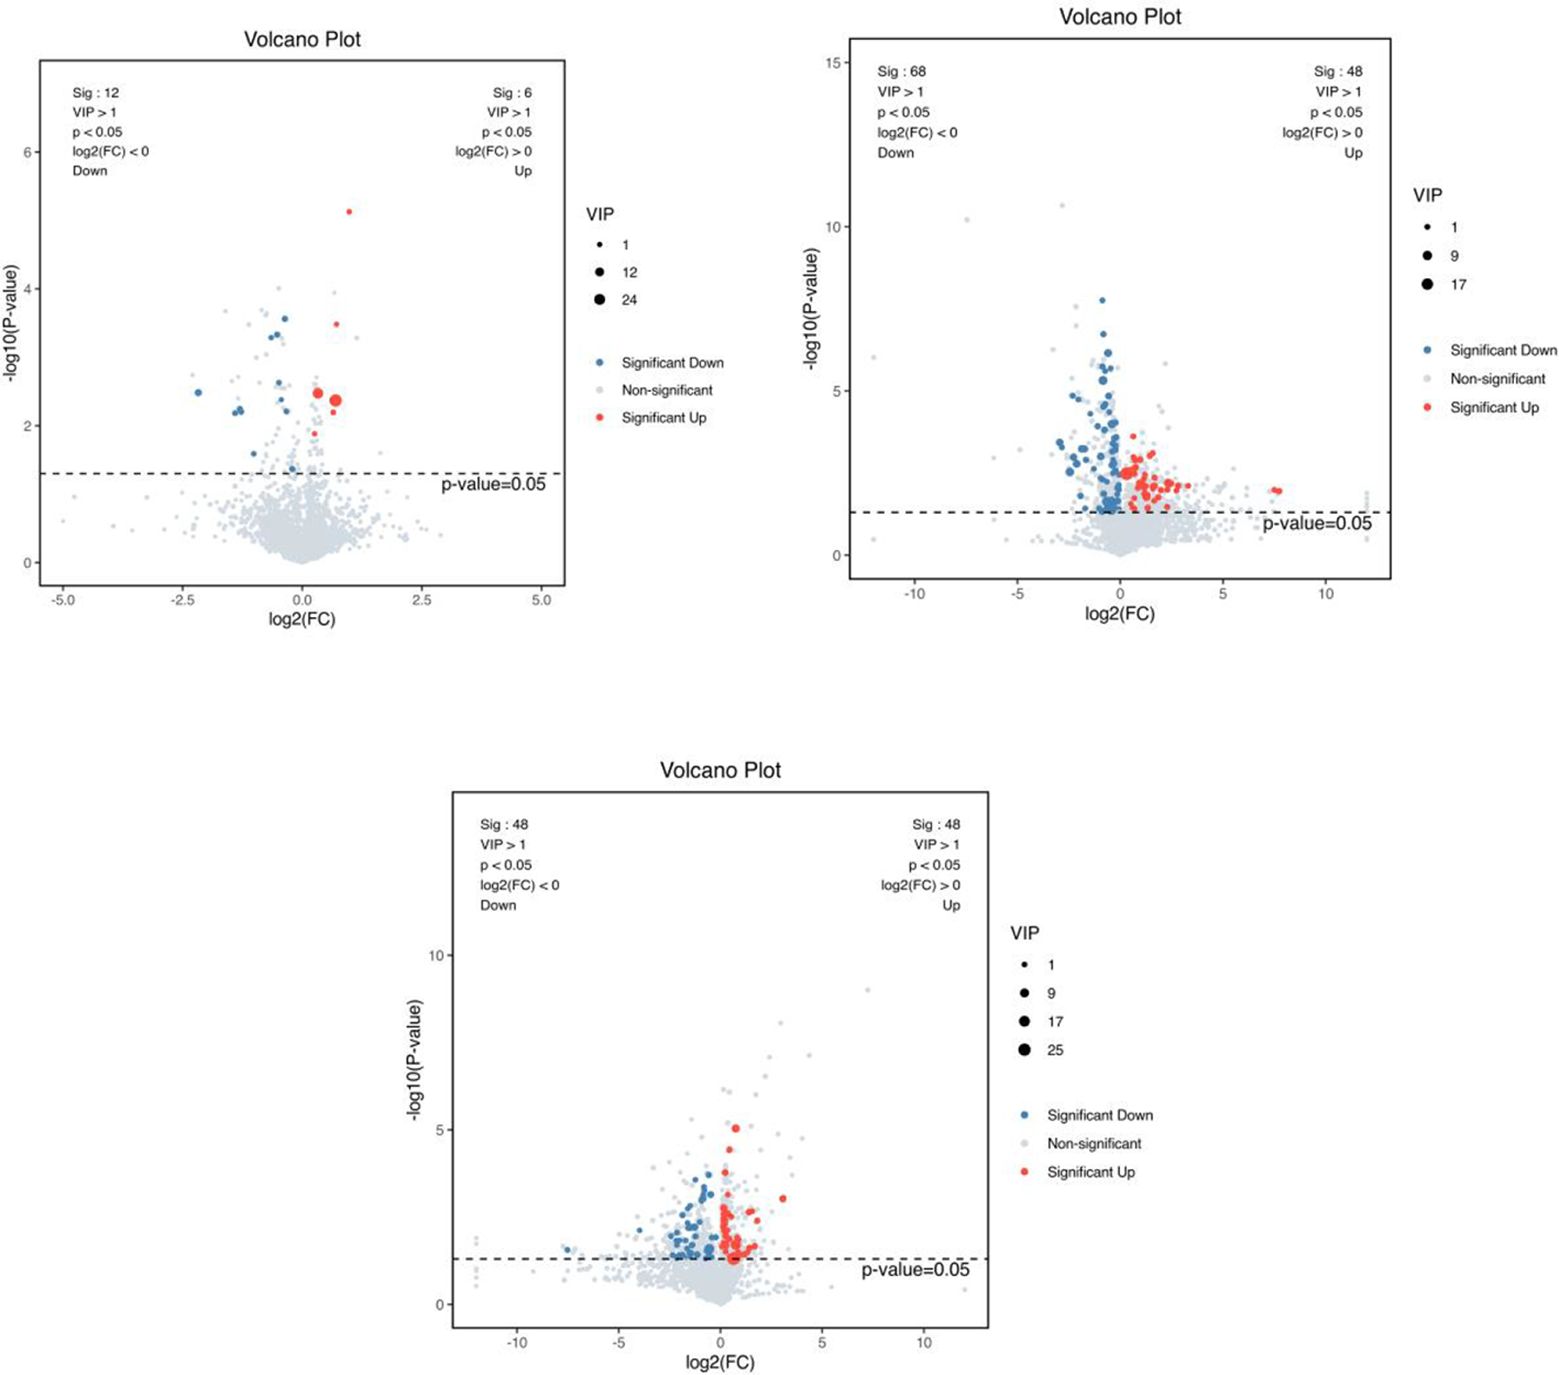
Figure 6. VIP values and screened differential metabolite volcano plots. From left to right, FI group relative to NC group, GSH group relative to NC group and FI group relative to GSH group. The red dots represent differential metabolites that were significantly up-regulated in the experimental groups, the blue dots represent differential metabolites that were significantly down-regulated, and the gray dots represent metabolites that were not significantly different. Each point in the graph represents a metabolite, the horizontal coordinate is the log2 (FC) value of the comparison between the two groups, and the vertical coordinate is the -log10 (p-value) value, with the red dots representing significantly up-regulated differential metabolites (P<0.05, VIP>1 and FC>1) and the blue dots representing significantly down-regulated differential metabolites (P<0.05, VIP>1 and FC<1).
3.5.3 Significantly different metabolitesIn order to visualize the expression differences of intestinal samples and metabolites among different samples, this study performed hierarchical clustering of the expression levels of all significant differential metabolites among the top 50 significant differential metabolites according to VIP sorting. The results are shown in Figures 7. Significant differential metabolites in the three comparisons were PE-NMe2 (20:2(11Z,14Z)/15:0), PC (22:2(13Z,16Z)/12:0), L-Alloisoleucine, PS (O-18:0/13:0), Photinus Luciferin, 5beta-Cholestan-3alpha,4alpha,11beta,12beta,21-Pentol-3,21-Disulfate, Ixocarpanolide, 2-Piperidinone, PS [(18:2(9Z,12Z)/22:5(4Z,7Z,10Z. 13Z,19Z)-O(16,17)], SM [d18:0/24:1(15Z)(OH)], 2e,13z-Octadecadienal, N-Butylformamide, Hypoxanthine, L-Proline, (2s)-2-(4-Chloroanilino) Propanoic Acid, 2-(2-Hydroxypropan-2-Ylamino)Propan-2-Ol.
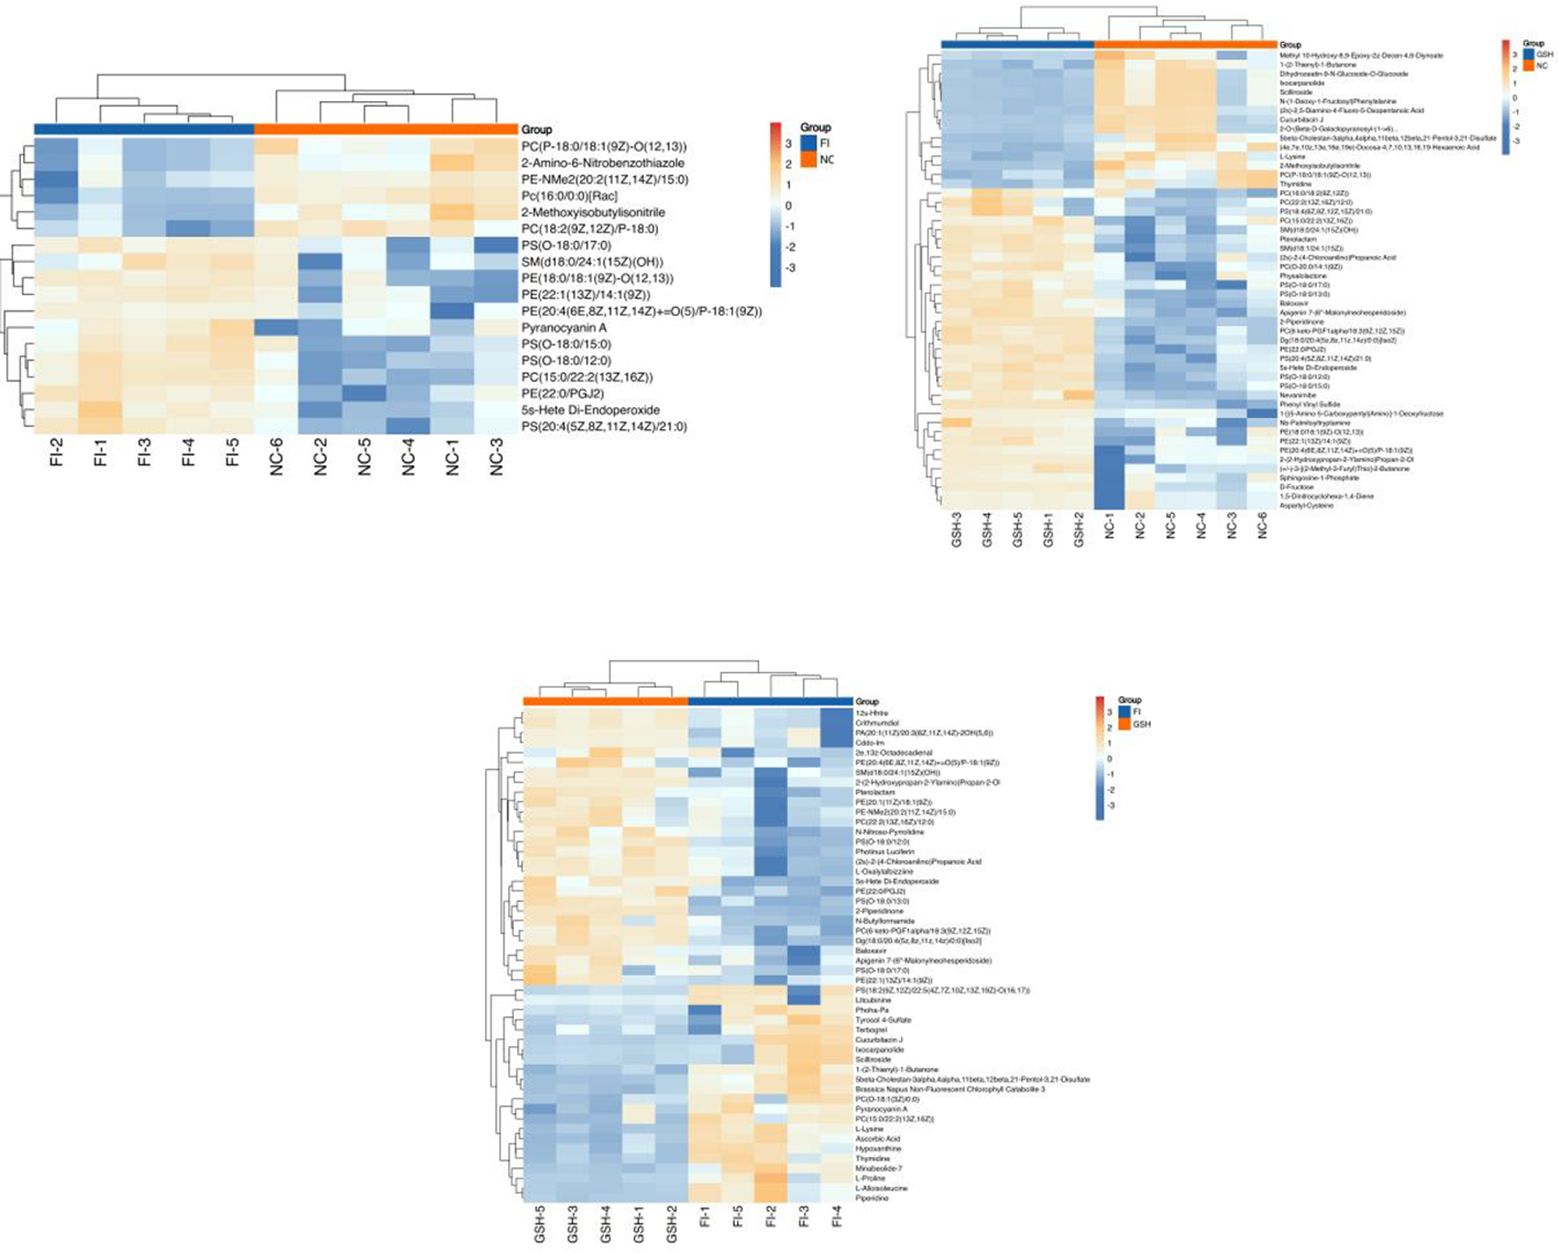
Figure 7. Heatmap of the top 50 differential metabolites of VIP ranking. From left to right, FI group relative to NC group, GSH group relative to NC group and FI group relative to GSH group. Horizontal coordinates indicate sample names and vertical coordinates indicate differential metabolites. The color from blue to red indicates that the expression abundance of the metabolite is from low to high, i.e., the redder it is, the higher the expression abundance of the differential metabolite.
3.5.4 Metabolic pathway enrichment analysisIn this study, two groups of intestinal samples were analyzed using the LC-MS metabolomics approach and the differences between the two groups were statistically significant. Based on KEGG metabolic libraries, metabolic pathways with significant differences in metabolites were identified. As shown in Figures 8, the major pathways preliminarily analyzed and found to differ between the FI and NC groups were Autophagy-other, Autophagy-animal, Glycosylphosphatidylinositol (GPI) pathway, Calcium signaling pathway, Linoleic acid metabolism, Sphingolipid metabolism; the main pathways differing between the FI group and the GSH group were Gap junction, Aminoacyl-tRNA biosynthesis, Pyrimidine Metabolism, D-Amino acid metabolism. the different pathways shared by the three groups were Autophagy-other, Autophagy-animal, Glycosylphosphatidylinositol (GPI)-anchor biosynthesis, Necroptosis, Glycerophospholipid metabolism.
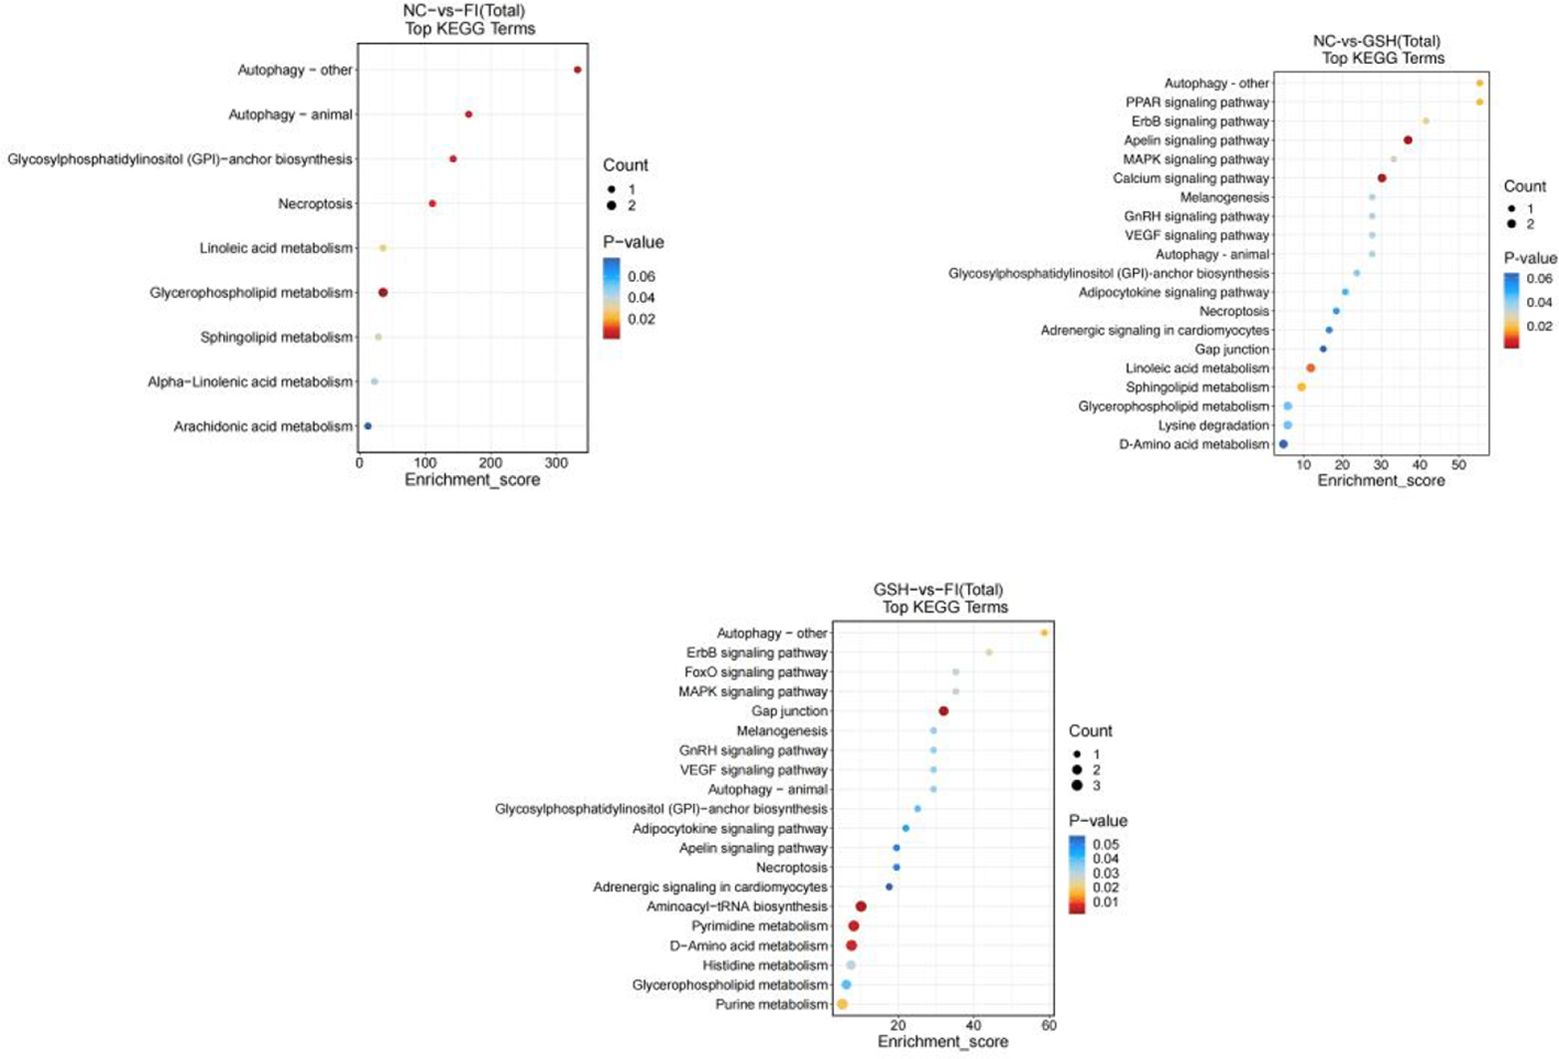
Figure 8. Enrichment bubble diagram of TOP-20 metabolic pathway. From left to right, FI group relative to NC group, GSH group relative to NC group and FI group relative to GSH group. The horizontal coordinate Enrichment Score in the graph is the enrichment score, and the vertical coordinate is the pathway information of top20. The pathways with larger bubbles contain more differential metabolites, the bubble color changes from blue-red, and their enrichment pvalue values are smaller and more significant.
3.6 Modulation of hepatic lipid metabolites in bullfrogs by glutathione mix feeding3.6.1 Sample raw data and principal component analysisAs can be seen from Figure 9, the samples of NC, FI and GSH groups were all in the 95% confidence interval, and could be spatially separated evenly without overlap, indicating that there were obvious differences in metabolites among the three groups, and they were able to be analyzed in the next step.
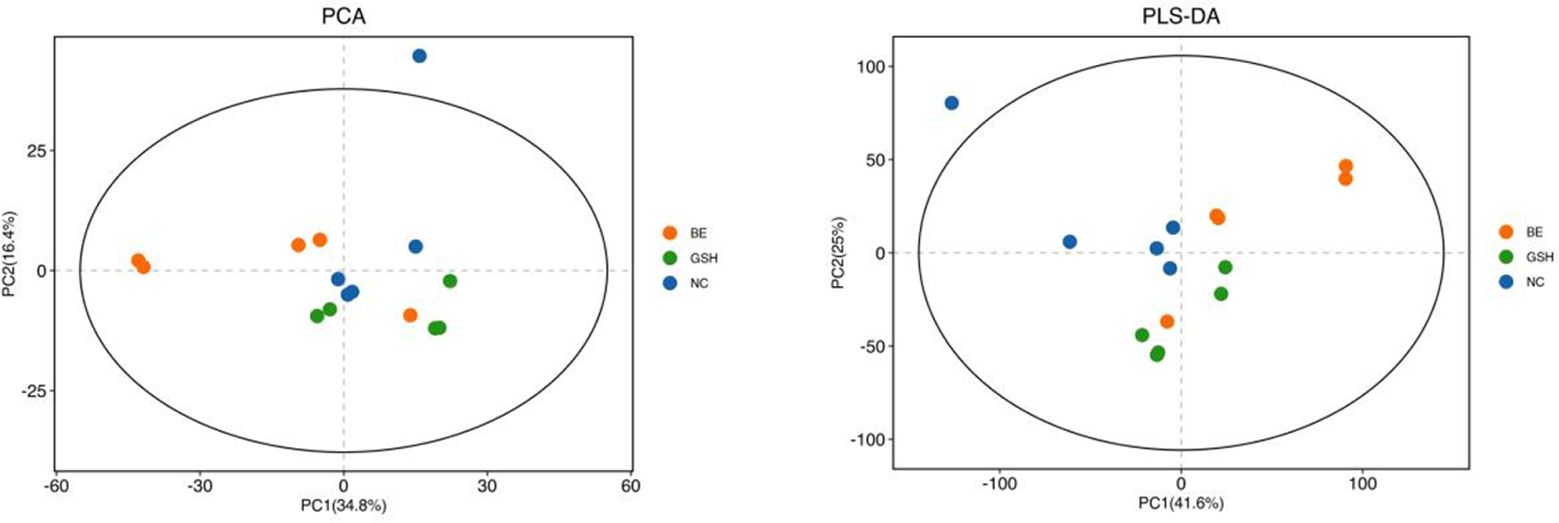
Figure 9. PCA vs. PLS-DA plots of hepatic lipid metabolites in the NC, FI, and GSH groups.
3.6.2 Screening of differential metabolitesAs shown in Figure 10, a total of 230 differential metabolites were screened in the NC, FI and GSH groups. As can be seen from Volcano Figure 11, the FI group up-regulated 31 differential metabolites and down-regulated 2 differential metabolites relative to the NC group; the GSH group up-regulated 17 differential metabolites and down-regulated 16 differential metabolites relative to the NC group; and the FI group up-regulated 28 differential metabolites and down-regulated 32 differential metabolites relative to the GSH group.
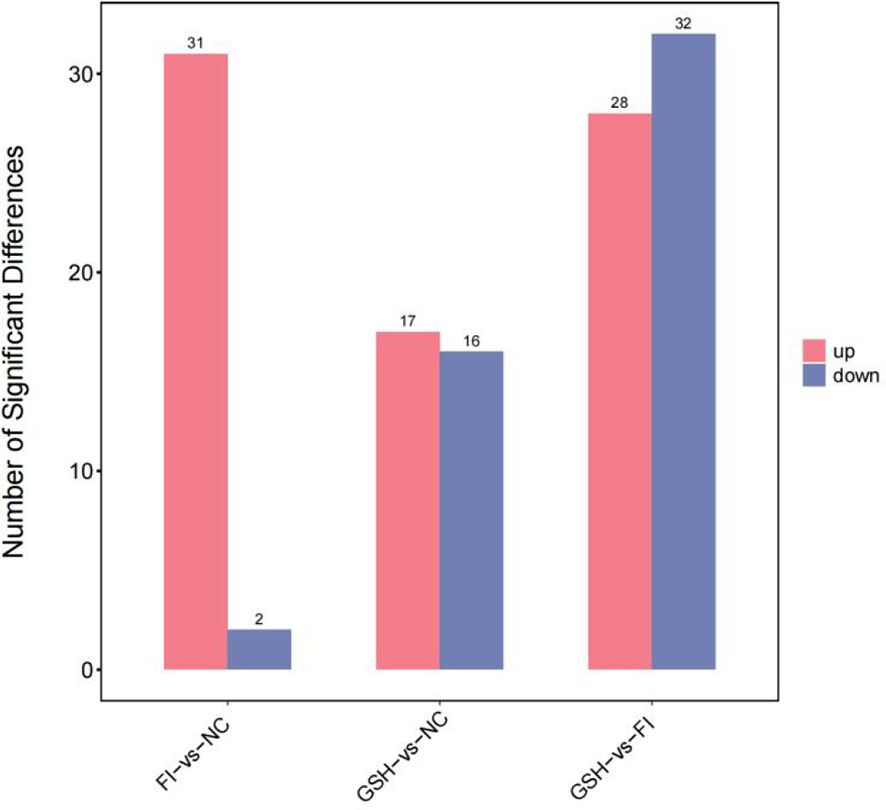
Figure 10. Differential metabolite quantity statistical chart.
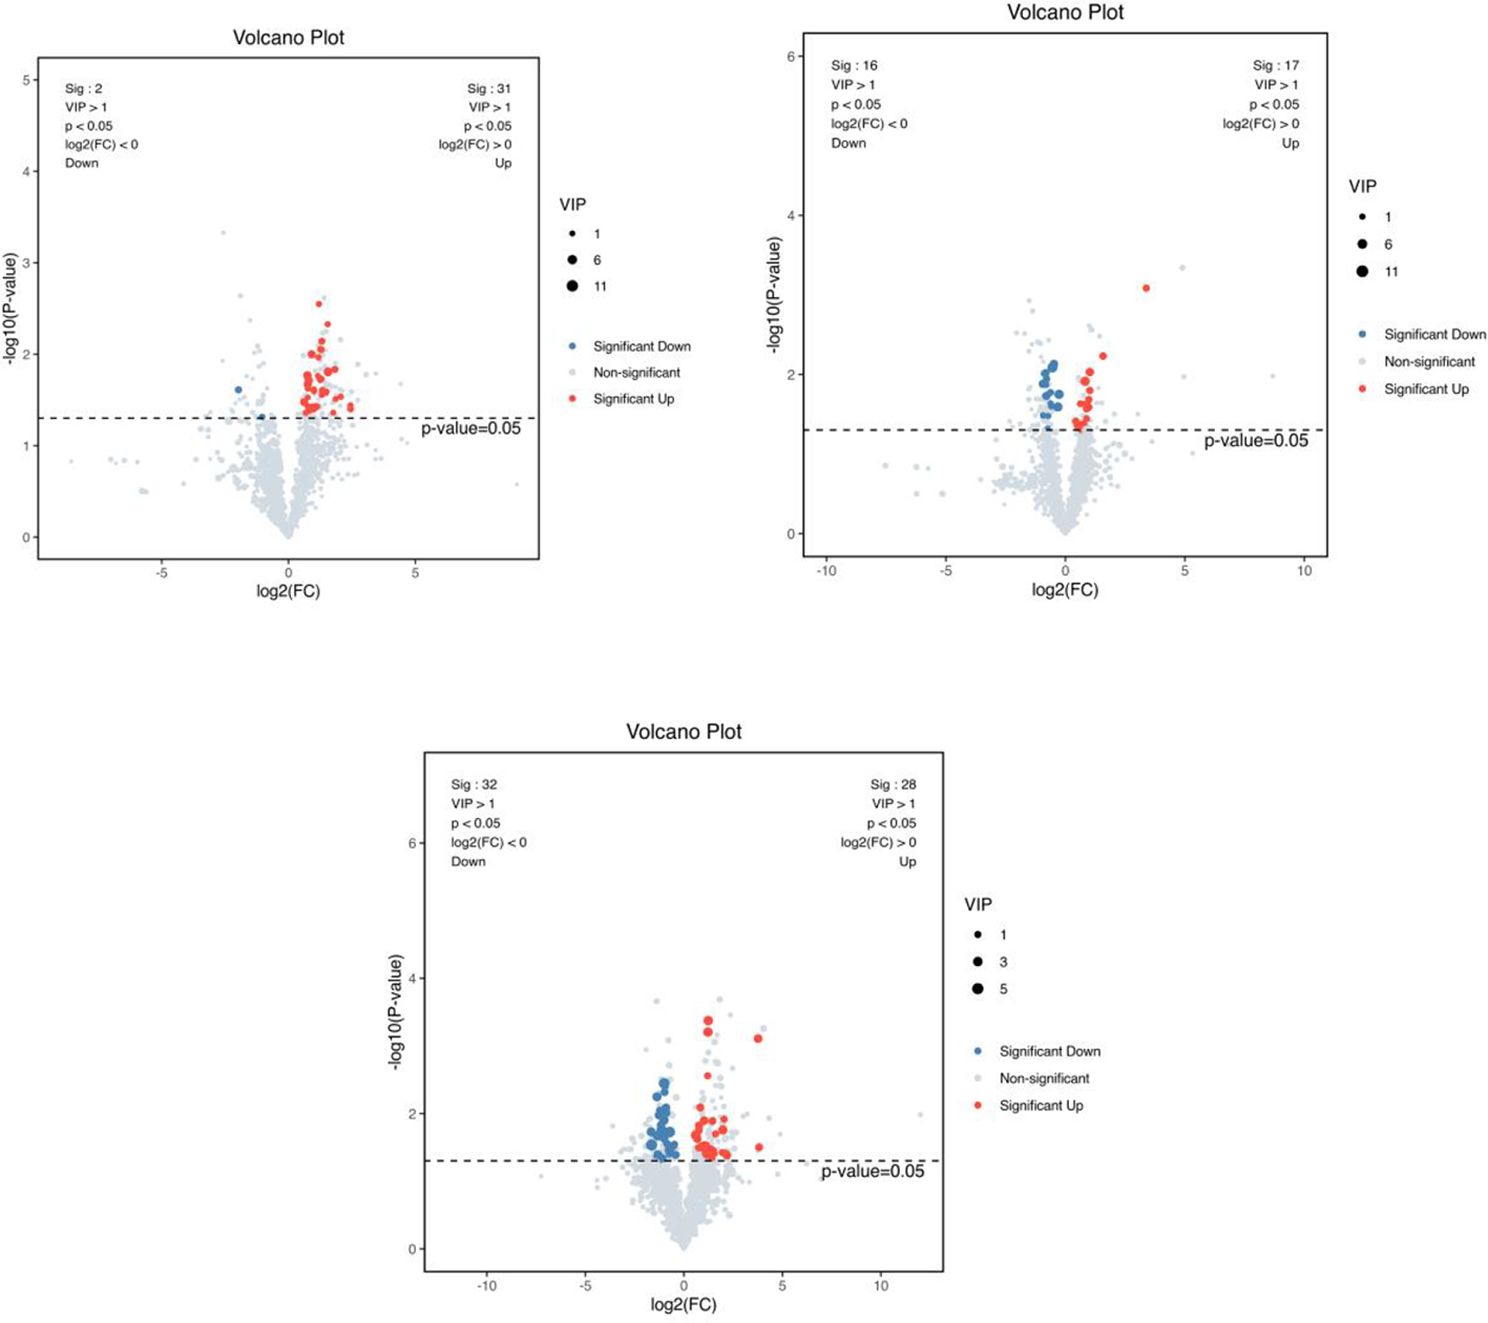
Figure 11. VIP values and screened differential metabolite volcano plots. From left to right, FI group relative to NC group, GSH group relative to NC group and FI group relative to GSH group. The red dots represent differential metabolites that were significantly up-regulated in the experimental groups, the blue dots represent differential metabolites that were significantly down-regulated, and the gray dots represent metabolites that were not significantly different. Each point in the graph represents a metabolite, the horizontal coordinate is the log2 (FC) value of the comparison between the two groups, and the vertical coordinate is the -log10 (p-value) value, with the red dots representing significantly up-regulated differential metabolites (P<0.05, VIP>1 and FC>1) and the blue dots representing significantly down-regulated differential metabolites (P<0.05, VIP>1 and FC<1).
3.6.3 Significant differential metabolitesThe results are shown in Figure 12. The significant differential metabolites in the three group comparison were PC (36:3), PC (38:6), PE (16:0/20:4), PC (16:0/22:6), PS (42:5), PI (16:0/20:4), PE (18:1p/20:4), dMePE (16:1/20:5), PE (16:0p/20:4), PC (36:5), PE (18:1p/22:5), OAHFA (38:4), PC (40:7), PE (18:2p/20:4), PC (40:6p).
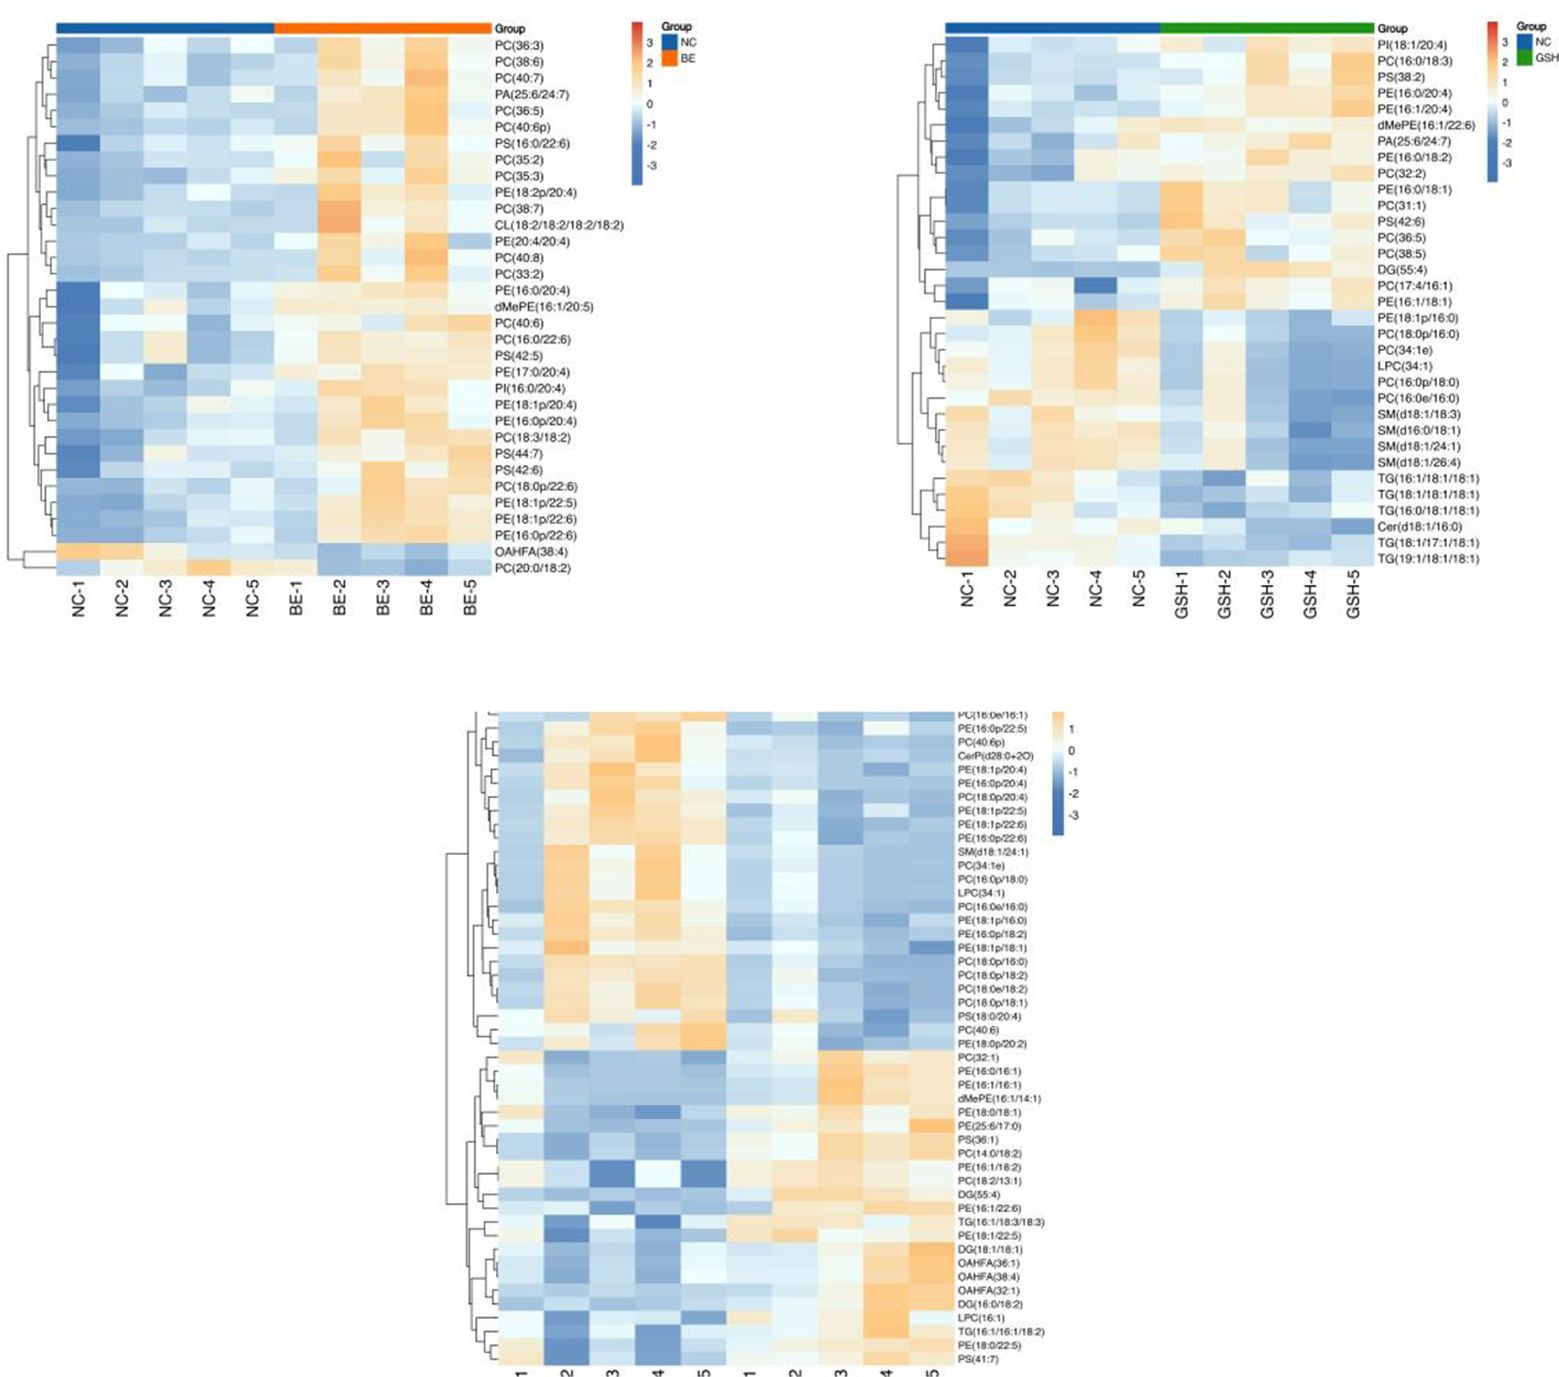
Figure 12. Heatmap of the top 50 differential metabolites of VIP ranking. From left to right, FI group relative to NC group, GSH group relative to NC group and FI group relative to GSH group. Horizontal coordinates indicate sample names and vertical coordinates indicate differential metabolites. The color from blue to red indicates that the expression abundance of the metabolite is from low to high, i.e., the redder it is, the higher the expression abundance of the differential metabolite.
3.6.4 Metabolic pathway enrichment analysisAs shown in Figure 13, preliminary analysis and found that the main difference pathways between FI group and NC group were Autophagy-other, Autophagy-animal, Glycosylphosphatidyylinositol (GPI)-anchor biosynthesis, Glycerophospholipid metabolism; the main pathways of difference between the GSH group and the NC group were Autophagy-animal, Glycosyl phosphatidylinositol (GPI)-anchor biosynthesis, Linoleic acid metabolism; FI group and the NC group were mainly differentiated by the following pathways Glycosylphosphatidylinositol (GPI)-anchor biosynthesis, Linoleic acid metabolism; the main pathways differing between the FI group and the GSH group were Autophagy-other, ErbB signaling pathway, MAPK signaling pathway, and glycerophospholipids metabolism; and the pathways differing between the FI group and the GSH group were Autophagy-other, Autophagy-animal, and Autophagy-animal, Glycosylphosphatidylinositol (GPI)-anchor biosynthesis, Glycerophospholipid metabolism.
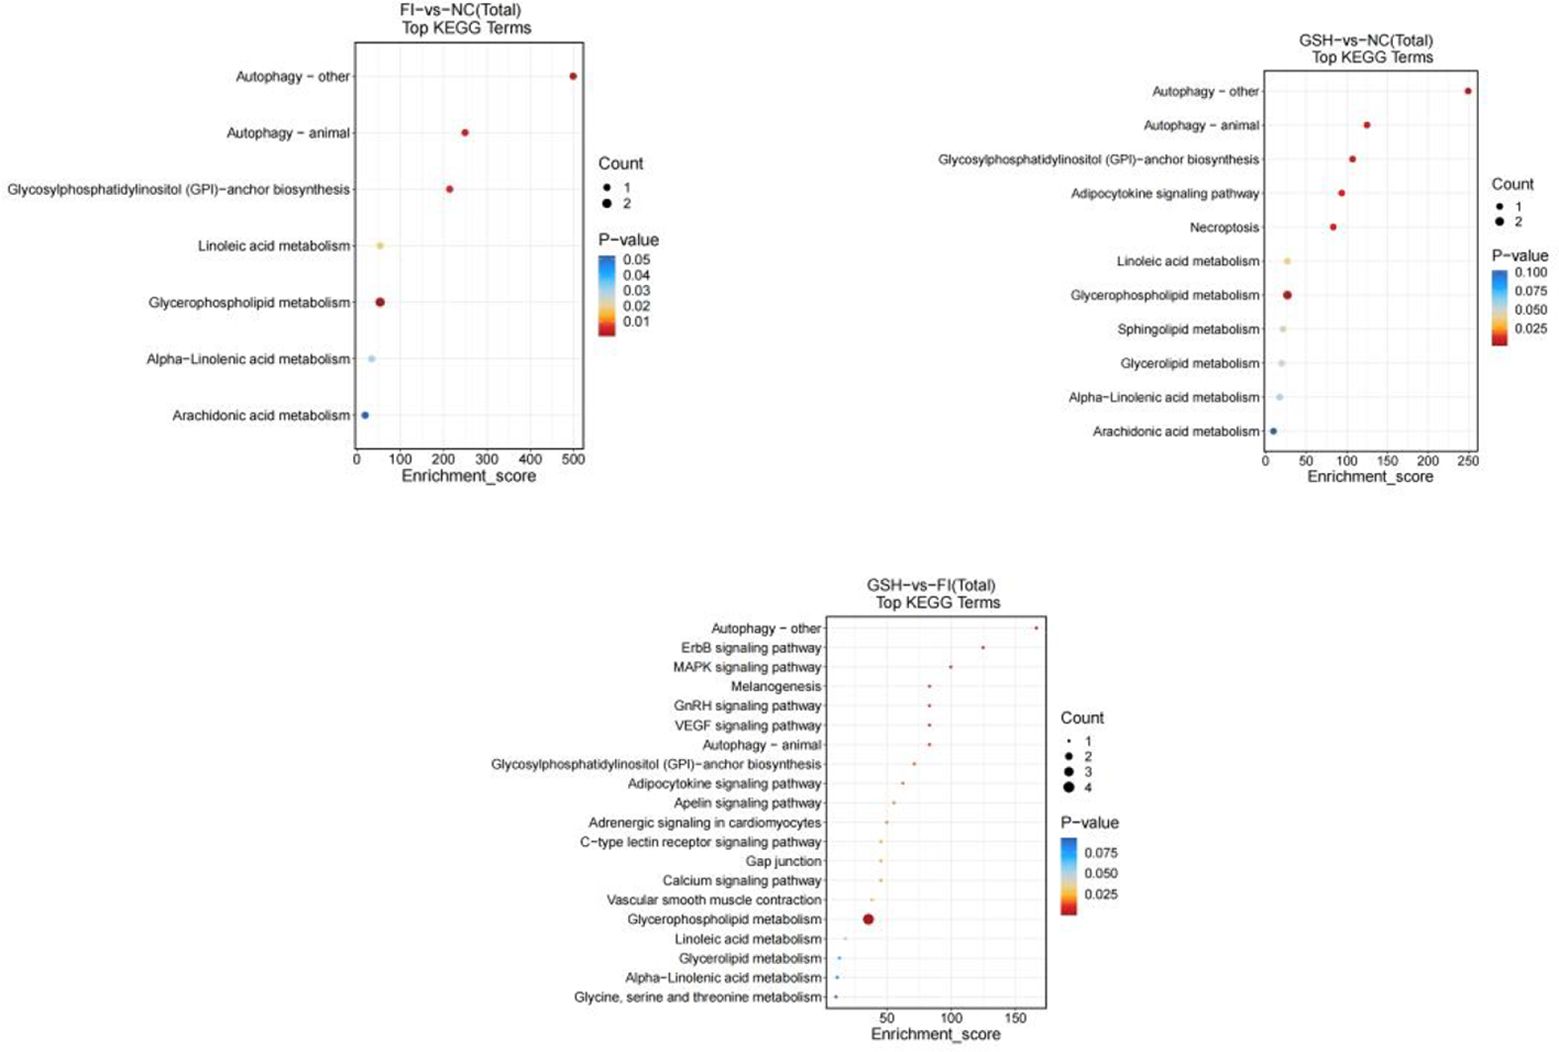
Figure 13. Enrichment bubble diagram of TOP-20 metabolic pathway. From left to right, FI group relative to NC group, GSH group relative to NC group and FI group relative to GSH group. The horizontal coordinate Enrichment Score in the graph is the enrichment score, and the vertical coordinate is the pathway information of top20. The pathways with larger bubbles contain more differential metabolites, the bubble color changes from blue-red, and their enrichment pvalue values are smaller and more significant.
4 Discussion4.1 Effect of glutathione on growth performance and hepatic lipid metabolism in bullfrogsRelatively many studies have been conducted to show that glutathione has a promoting effect on the growth and antioxidant capacity of aquatic animals (Kwon et al., 2024). Zhao et al. (Hongxia Zhao et al., 2008) found that the addition of a certain amount of GSH to the diet could significantly improve the growth performance of grass carp at the initial stage and promote the nutritional metabolism of the fish, and it was hypothesized that GSH might increase the activity of growth hormone by destroying growth inhibitors, and at the same time, it promoted lipolysis and enhanced the oxidation of fatty acids, thus raising the cholesterol level, but the high dosage of GSH might cause some damage to the liver of grass carp. Zhou (Zhou, 2018) found that the weight gain rate of Pelteobagrus fulvidraco increased with the increase of GSH in the diet, and they were all significantly higher than that of the control group, and the cholesterol and triglycerides of the 100–500 mg/kg group were higher than that of the control group, which indicated that the ability of lipid metabolism was enhanced. In this experiment, with the use of glutathione, the survival rate of bullfrog culture was improved, which inferred that glutathione can effectively regulate the liver lipid metabolism of bullfrogs and improve the growth function of bullfrogs. Yi et al. (Jianhua Yi et al., 2023) also found that the addition of 350 mg/kg of GSH to the feed significantly increased the final body mass, weight gain rate and specific growth rate of cultured Pelteobagrus fulvidraco, while significantly reducing the feed coefficient, and at the same time, the HDL cholesterol in the blood was elevated. Feng et al. (Feng Ju Pan et al., 2021) showed that the addition of GSH at a level greater than 0.18 g/kg significantly increased the growth rate and reduced the bait coefficient of crayfish. It was hypothesized that it was related to its anti-stress effect, but further research and study from the perspective of material energy metabolism is needed (Jang et al., 2024). Liu (Liu, 2020) found that the addition of appropriate amount of GSH to the diet could improve the stress resistance and growth performance of cultured Chinese mitten crab. Cao et al. (Junming Cao et al., 2008) found that the addition of GSH to the diet could increase the GSH content in the hepatopancreas of the shrimp Penaeus vannamei, which was hypothesized to affect the growth of the shrimp by influencing a series of physiological activities of the shrimp, and improve the feed conversion efficiency and survival rate. The results of liver tissue sections in the experiment showed that the liver tissue of bullfrogs in the GSH group was repaired to a certain extent relative to that of the FI group after the use of glutathione mixed with bullfrog feed, indicating that glutathione has a better therapeutic effect on the liver of bullfrogs.
4.2 Serum antioxidant capacity and effect on hepatic lipid metabolizing capacity in bullfrogs with glutathioneThe animal body due to the normal metabolic process is prone to produce many less stable unpaired electron molecules, atomic groups or chemical groups (Liu et al., 2024a), known as free radicals, and superoxide anion radicals (O2-) is one of the main forms of free radicals (Abdelazim and Abomughaid, 2024). However, O2- can oxidize phospholipids on the cell membrane to produce peroxides such as malondialdehyde (MDA) and ketone groups containing aldehyde groups to destroy the cell membrane structure (Tao et al., 2024), thus causing a series of diseases (He et al., 2024a). Antioxidant enzymes such as superoxide dismutase (SOD) and catalase (CAT) are the most important defense system to remove O2- in the body, reflecting the vitality of antioxidant enzymes in the body (Medinas and Augusto, 2010). Among them, SOD is an important antioxidant enzyme class that exclusively defends against excessive O2- during metabolic processes in the organism, and its activity level indirectly reflects the degree of oxidative damage suffered by the organism (Chen et al., 2023). In this experiment, the use of glutathione mixed with bullfrog feed accelerated the normal metabolic rate in the body of bullfrogs, which produced excess O2-. In order to scavenge excess O2- and its peroxidized products such as MDA, the activity of SOD enzyme in the GSH group was significantly higher than that in the FI group, which indicated that glutathione could effectively improve the antioxidant capacity of bullfrogs. Alkaline phosphatase (AKP) is present in many tissues (Liu et al., 2019), but the highest concentrations are found in the liver, biliary epithelium and bone (Chen et al., 2003). Detection of this enzyme is important in determining liver disease. Serum acid phosphatase (ACP) is mainly derived from the liver, erythrocytes and platelets In hepatitis, cirrhosis, abnormal liver metabolism, and extrahepatic and intrahepatic obstructive biliary diseases and cirrhosis (Peng et al., 2015), the enzyme levels of AKP and ACP are greatly increased (Shang et al., 2003). In this experiment, glutathione feeding significantly reduced the enzyme levels of AKP and ACP, and effectively alleviated the symptoms of abnormal liver lipid metabolism and hepatitis in bullfrogs.
Total cholesterol, including free cholesterol and cholesteryl esters, is synthesized and stored in the liver, and its serum concentration can be used as an indicator of lipid metabolism (Cai et al., 2024b). High density lipoprotein cholesterol (HDL-C), mainly synthesized in the liver, is an anti-atherosclerotic lipoprotein that transports cholesterol from extrahepatic tissues to the liver for metabolism, and it is excreted from the body by bile (Deng et al., 2024). Lower HDL cholesterol is commonly seen in cerebrovascular disease coronary heart disease, hypertriglyceridemia, liver function damage such as acute and chronic hepatitis, cirrhosis, and liver lipid metabolism abnormalities (Quetglas-Llabres et al., 2024). The activities of HDL-C and T-CHO in the FI group were significantly lower than those in the NC group in this experiment; while the activities of LDL-C, TBA and TG were significantly higher. Studies have shown that abnormal liver metabolism and impaired hepatic synthesis of LDL can cause low LDL (Wu et al., 2024a). In contrast, increased total bile acids are commonly found in various acute and chronic hepatitis, alcoholic hepatitis, as well as in the vast majority of extrahepatic bile duct obstruction and intrahepatic cholestatic diseases, cirrhosis, and so on. In living organisms, the synthesis and catabolism of triglycerides are key aspects of energy metabolism (Zhang et al., 2023; Mireault et al., 2024). They not only serve as energy storage and provision substances, but also participate in the construction of cellular structures and regulate the properties of biological membranes (Hu and Du, 2023). In the field of medicine, triglyceride levels are one of the most important indicators of the health of a living organism. Increased serum triglycerides can be seen in hypothyroidism, nephrotic syndrome, pancreatitis, impaired liver function and abnormal lipid metabolism (Chen et al., 2024; Guo et al., 2024b). And with the use of glutathione, the activities of LDL-C, TBA and TG of bullfrogs were reduced, which proved that glutathione has a better therapeutic effect on the abnormalities of hepatic lipid metabolism in bullfrogs.
4.3 Regulation of serum metabolites and hepatic metabolites in bullfrogs by glutathioneIn the serum metabolomics and liver metabolite assay of bullfrogs, it was found that the significant differential metabolites in the three comparisons were mainly lipids and lipid-like molecules, as well as some organic acids and their derivatives. And th
留言 (0)