
記住我

Ten well-trained male cyclists volunteered for this study [age: 31 ± 8 years; mass: 76 ± 5 kg; maximal oxygen consumption (\(\dot}_\)): 67 ± 4 ml kg−1 min−1 BM; peak power output (PPO) at \(\dot}_\): 423 ± 21 W)]. All cyclists met the criteria of ‘well trained’ as defined by De Pauw et al. [19] by meeting the threshold required for \(\dot}_\) and PPO. All participants were part of a UK cycling club and trained > 3 times for ≥ 10 h/week [19]. The study received university ethics committee approval (Birmingham City University: #10651/sub2/R(B)/2022/May/HELS FAEC) and participants voluntarily provided written informed consent to take part. The study was performed in accordance with the ethical standards in the 1964 Declaration of Helsinki and later amendments.
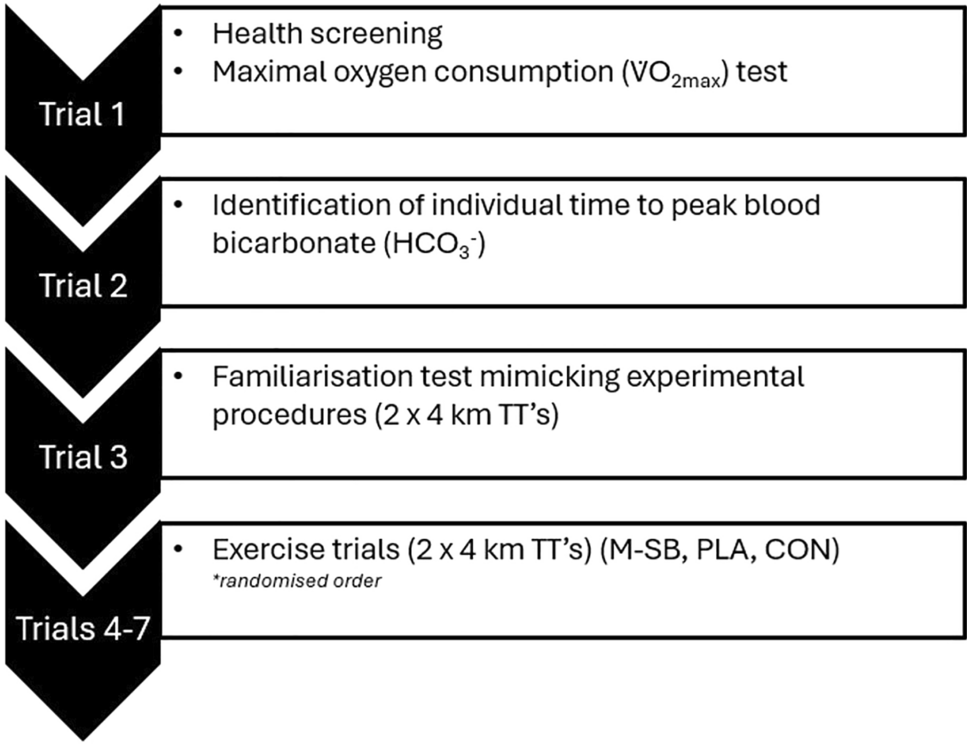
2.2 Experimental OverviewThis study employed a randomised, crossover, placebo-controlled and double blinded design, and consisted of seven visits (Fig. 1). In the first visit, participants completed pre-trial health screening (PAR-Q) and a \(\dot}_\) test. On the second visit, an individual time to peak blood bicarbonate (ITTP) test was conducted following ingestion of 0.3 g kg−1 BM SB (Maurten AB, Gothenburg, Sweden; M-SB). The third visit was a familiarisation trial consisting of completing 2 × 4 km cycling time trials (TT) on a cycle ergometer (Wattbike, Nottingham, UK), separated by a 45 min passive recovery period. Using the previously identified ITTP, three separate trials were then conducted where participants completed the two TTs with the recovery period between them, following the ingestion of M-SB, placebo (PLA) or a control (CON) in a block randomised order (Fig. 2).
Fig. 1
Schematic representation of the study design describing each trial procedures. TT time trial, km kilometre, PLA placebo, CON control
Fig. 2
Schematic representation of the exercise trials. Fingertip blood samples were taken for pH, bicarbonate (HCO3−), sodium (Na+), potassium (K+), calcium (Ca2+), chloride (Cl−), and lactate; no supplement was ingested for the control trial. ITTP individual time to peak, VAS visual analogue scale
Participants refrained from ingesting caffeine, alcohol and from performing exhaustive or prolonged exercise for 24 h prior to each trial. All trials were conducted at a similar time of day (± 1 h) to control for circadian variations. Nutritional intake was recorded via 24 h dietary recall and then replicated for each trial, using the ‘snap-n-send’ and written methods [20]. Participants were encouraged to ingest a meal consisting of 2 g kg−1 BM CHO approximately 2 h prior to all trials to replicate the typical preparation of highly trained cyclists prior to exercise. Participants achieved an intake of 1.7 ± 0.2 g kg−1 BM CHO, along with 19 ± 6 g of protein and 12 ± 4 g of fat, totalling a pre-exercise meal energy intake of 702 ± 99 kcal.
2.3 Experimental Procedures2.3.1 Maximal Oxygen ConsumptionTo determine the training status of the participants, they first completed a graded exercise test for the determination of \(\dot}_\). Following a warm-up, participants completed a graded exercise test that began at 75 W and increased by 25 W min−1 to volitional exhaustion. Participants performed the test with a consistent cadence (85–95 rev min−1) whilst their oxygen consumption (\(\dot}_\)), carbon dioxide (\(\dot}_\)) and respiratory exchange ratio (RER) were measured continuously (breath-by-breath) using a gas analyser (Metalyser, Cortex, Germany). Following the test, determination of \(\dot}_\) was defined as the highest plateau reached with two successive readings within 0.15 L min−1.
2.3.2 Identification of Individual Time to Peak Blood BicarbonateOn a separate visit, participants ingested 0.3 g kg−1 BM M-SB mixed into 40 g of hydrogel CHO, which is a component of the “Bicarb System”. Repeated fingertip blood samples were collected at baseline and then every 30 min for 300 min. Each sample was obtained using heparin-coated glass clinitubes (70 μl) (Radiometer Medical Ltd., Denmark) and immediately analysed for blood pH, HCO3−, Na+, K+, Ca2+ and Cl− using a blood gas analyser (ABL9, Radiometer Medical Ltd., Denmark). Participants were permitted to ingest water ad libitum and remained in a rested state throughout, with the amount recorded and replicated for each trial. At each 30 min timepoint gastrointestinal (GI) discomfort was also recorded for a range of symptoms using a visual analogue scale (VAS), as per previous research [18]. The GI symptoms assessed were nausea, flatulence, stomach cramping, belching, stomach ache, bowel urgency, diarrhoea, vomiting and stomach bloating, as well as an assessment of perceived thirst. Each VAS scale was scored between 0 and 10, with 0 representing no symptoms and 10 representing most severe symptoms. The ITTP was used due to previous research identifying this as a reliable measure of peak alkalosis [12, 21], and could enhance performance to a greater extent than a standardised time frame of ingestion [11, 22].
2.3.3 Supplement IngestionPrior to the first TT in each trial participants ingested either 0.3 g kg−1 BM M-SB or a placebo (PLA) containing 0.21 g kg−1 sodium chloride in vegetarian capsules (bulk, size 00, Bulk, Colchester, UK). In the PLA trial, the same hydrogel CHO product containing ~ 40 g of CHO was administered for blinding purposes (Maurten AB, Gothenburg, Sweden). For the timing of M-SB ingestion the ITTP HCO3− was used and this timing was also used for the PLA trial (range 90–240 min). All participants completed ingestion within a 10-min window. The VAS scales for GI discomfort were taken at multiple time points, including baseline, ITTP, pre-TT1, recovery (15, 30 and 45 min), pre-TT2 and post-TT2. In the CON trial, participants did not ingest any SB or hydrogel CHO.
2.3.4 Time Trial ProceduresAll cycling TTs were completed in a laboratory-controlled environment (ambient temperature ~ 18 °C ± 2 °C). Each trial consisted of completing 2 × 4 km cycling TTs interspersed with a 45-min passive recovery. The repeated 4 km TT protocol was selected as an appropriate exercise that significantly changes acid–base balance status [7, 9] and because the protocol can detect small changes in performance required for supplement studies (due to the high reliability of the protocol) [23]. Participants were permitted to select their preferred positions on the cycle ergometer (i.e. saddle and handlebar) and this was replicated for each TT. Each warm-up was individualised on the basis of the knowledge they were completing a 4 km TT, which was then recorded and replicated for each subsequent trial. Participants then completed each 4 km TT as quickly as possible and time elapsed was blinded. Only power output and cadence were visible throughout each TT. Whole body (RPE-O) and leg rating of perceived exertion (RPE-L) was recorded every 1 km of each TT (6–20 scale, [24]), along with heart rate (Polar, FT1, Finland). Throughout each trial, fingertip capillary blood samples were taken at baseline, ITTP, post-warm-up TT1 (PW1), post-TT1, during recovery (15-, 30- and 45-min recovery), post-warm-up TT2 (PW2) and post TT2. Time to complete, mean power output and mean speed were recorded for each TT.
Following each trial, a supplement belief questionnaire was administered as per previous research [18]. This questionnaire asked participants for a confidence score (0, no confidence; 5, not sure; 10, highest confidence) and which supplement they perceived they had ingested. Any score over 5 was considered a successful detection and this was then compared with the supplement they had truly ingested. In the CON trial, the supplement belief questionnaire was not administered.
2.4 Statistical AnalysisData were assessed for normality using Q–Q plots, histograms with normal distribution curves, and Shapiro–Wilk tests. Differences in mean values between conditions were assessed for TT performance (time, speed, power output and trial order), heart rate (HR) and all blood parameters using a series of repeated measure analysis of variance (ANOVA). Post hoc comparisons were made using a Bonferroni correction for multiple comparisons. Differences in TT performance, between TT1 and TT2 for each condition, were analysed using a comparison of the small main effects which provided additional post hoc pairwise comparisons. Ratings of perceived exertion were analysed using Friedman’s tests with Kendall’s w reported as an effect size. Total aggregated GI symptom scores are reported as arbitrary units (AU) and were analysed using a Wilcoxon test, with r reported as an effect size (where r = z/√n). Hedge’s g, r and w effect sizes were interpreted as small (0.2), medium (0.5) or large (0.8) and partial eta squared (pη2) effect sizes were interpreted as small (0.01), medium (0.06) or large (0.14) in accordance with Cohen [25]. All statistical procedures were performed using SPSS v29 for Windows (IBM, Chicago, USA), and statistical significance was assumed where p < 0.05.
留言 (0)