Data source
Four hundred eighty-two MM patients at the University of California, San Francisco (UCSF) (304 newly diagnosed and 178 in ≥2nd line) diagnosed from 2008 to 2020 were included in this retrospective analysis, based on the availability of MRD monitoring data during their treatment between 2012 and 2022. Patients were selected because they had a follow-up of more than 12 months after the first MRD test and achieved at least a VGPR. Major characteristics of the patients are summarized in Table 1. Median follow-up from the first MRD assessment was 31.8 months (range is 1–98 months).
Table 1 Main patient characteristics at diagnosis.Patients received anti-MM therapy per provider preference with the aim of obtaining maximal response by International Myeloma Working Group (IMWG) criteria. MRD was assessed in random patients achieving VGPR or better (90% were in CR) at non-predetermined times. The majority of newly diagnosed patients were either status post autologous stem cell transplantation (ASCT) or were receiving maintenance therapy at the time of MRD assessment. In some cases, treatment was modified according to response status with the intent of achieving a deeper response.
Newly diagnosed patients generally received induction triplet combinations, which consisted of proteasome inhibitors, immunomodulators (or alkylators), and corticosteroids. Autologous stem cell transplantation (ASCT) and maintenance therapy were common (Table 2). In summary, 81% of patients received ASCT, 10% consolidation and 89% maintenance therapy until relapse or unacceptable toxicities.
Table 2 Initial therapy for NDMM.Among the patients who had MRD testing in the relapsed setting, 48% were in the second line, 21% in the third line, and 31% in the fourth line or later. A variety of regimens were administered according to physician preference.
This retrospective study was approved by the UCSF Institutional Review Board (IRB), IRB number 15-17721.
MRD assessments
The response was evaluated following the consensus response criteria of the IMWG [8]. There were no pre-specified time points for MRD assessment, but for most of the newly diagnosed patients, it was performed pre-ASCT, at 2–3 months post-ASCT, or when complete response was achieved. Subsequent assessments were generally performed on approximately an annual basis until sustained MRD negativity was confirmed or until the patient relapsed.
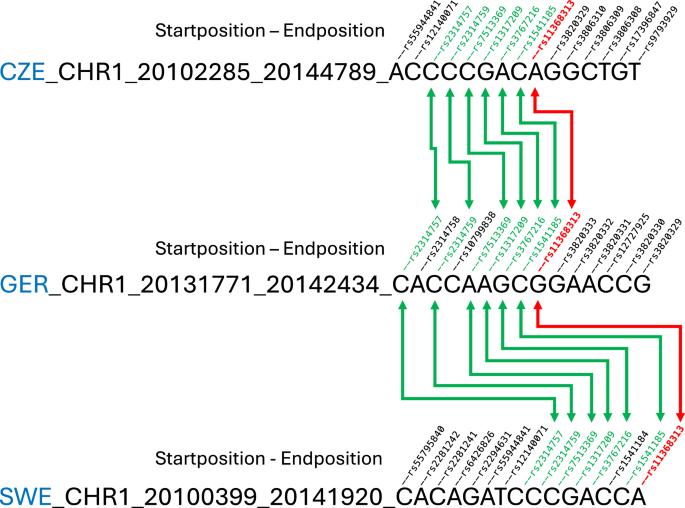
Evaluation of MRD was performed by NGS of immunoglobulin genes (IGH-VDJH and IGK or IGH-VDJH, IGH-DJH, IGK and IGL) [5]. Fresh bone marrow samples from MM patients were sent to Adaptive Biotechnologies (Seattle, WA) for MRD testing after stored or fresh bone marrow specimens had been successfully utilized to obtain ID sequences. Patient-specific clonal rearrangements were identified at diagnosis and employed to track the response. Patients without a high-frequency myeloma clone (<5%) could not be monitored by this method and were excluded from this analysis. Once the absolute amount of total cancer-derived molecules present in a sample was determined, a final MRD measurement was calculated, providing the number of cancer-derived molecules per 1 million cell equivalents. The clone with the highest MRD value was selected when 2 or more clones were identified. MRD negativity was defined to be 10−6 or lower in most of the cases.
Clonal diversity of immunoglobulin (Igs) genes was determined in the same NGS assessment by several parameters. Clonality scores range from 0 to 1, where 0 represents a sample with a completely even distribution of repertoire sequences, and 1 represents a monoclonal sample. Both the depth and breadth of the repertoire contained within a sample were considered. In this study, clonality scores were calculated from clonoSEQ MRD data using Shannon Clonality. However, we used the total number of different Ig sequences of every receptor as this was more representative. Lastly, we used for further analysis the value of Clonal Diversity of the samples at the moment of maximum response.
Analysis of dynamics of MRD by artificial intelligence (AI)
The AI analysis was performed by machine learning with Connector R package to perform clustering analysis of longitudinal time-dependent data, based on MRD dynamics. This analysis was unsupervised. The logarithmic values of the MRD measurements have been used. To determine the optimal number of groups for clustering analysis, the elbow achieved in the fDB (fuzziness-Davies–Bouldin) index and tightness plots have been considered.
Statistical analysis
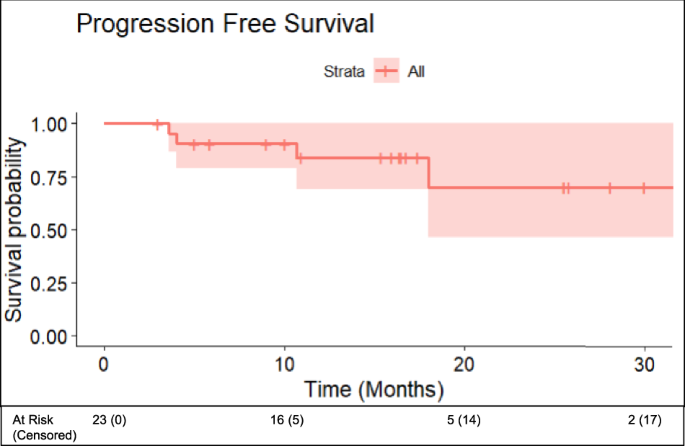
All data were included in a REDCap database (Vanderbilt University, Nashville, TN) and Microsoft Excel files. Statistical analysis was performed using the Statistical Package for Social Sciences program version 22.0 (SPSS, Statistical Package for Social Sciences Inc., Chicago, IL). Progression-free survival (PFS) was calculated from the MRD1 first assessment (landmark study) to disease progression or death or from the start of treatment to disease progression or death from any cause. To exclude some bias, we performed a landmark survival analysis at 12 months. Patients who did not experience an event at the end of follow-up were censored as of the last contact date. Kaplan–Meier method was employed to plot the survival curves for PFS and differences in survival outcomes between groups were evaluated through the log-rank test. Mean ± standard deviation or median ± interquartile range was included to summarize continuous variables; and qualitative variables were presented as relative and absolute frequencies. The χ2 and Fisher’s exact two-sided tests were used to compare categorical variables; and analysis of variance and Student t test were applied to compare continuous variables. An adjusted stepwise Cox proportional regression hazard model was employed to perform multivariate analysis. For the multivariable analysis, we included the following variables: age, sex, myeloma type, cytogenetic risk, hemoglobin, and creatinine. Analyses reaching two-sided p < 0.05 were considered statistically significant.


留言 (0)