Strains
Full genotypes of all strains used in this study can be found in Supplementary Table 2. Strains were constructed using the standard LiAc-based transformation protocol for budding yeast. Proteins were tagged C-terminally with mNeonGreen using a mNeonGreen:HphNT1 cassette, with mCherry using a mCherry:NatNT2 cassette, with 3xHA using a 3xHA:HphNT1 cassette and Tub1 was tagged N-terminally using Addgene vector #50654 (ref. 34). Genes were deleted using a KanMX4 cassette. Strains were diploidized by mating-type switching and mating in batch, using a plasmid containing HO endonuclease35 and ploidy was verified using PI staining (see below). Mating types were confirmed using mating-type-specific primers36. Centromere plasmids contained CEN4, ARS1 and either KanMX4 or HphMX for selection. Cloning vector pYAC4 was used as a small artificial chromosome after linearization37. All oligonucleotides used for strain construction are listed in Supplementary Table 3.
Growth assays
All growth assays were performed on synthetic complete medium with 2% dextrose (SCD). Per genotype, two biological replicates were inoculated in 150 µl SCD and serially diluted for overnight growth at 30 °C in a 96-well plate. The next morning, log-phase cultures at OD600 < 0.1 were selected and 5 µl of each selected culture was inoculated in 95 µl SCD in a 96-well plate. For each strain, this was repeated so that there were 16 replicate measurements per genotype in total. By consecutive culturing, we ensured that every culture is growing exponentially before the start of the growth experiment. The plate was incubated at 30 °C with continuous double orbital shaking in a BioTek Epoch2 microplate reader (Agilent) using Gen5 software (v.3.11, BioTek) and the OD600 was measured every 10 min for 24 h. Maximum growth rates were determined using the gcplyr package in R38. For growth assays with benomyl (Sigma) or hydroxyurea (Sigma), all strains were pre-grown on SCD without the chemical compound and the chemical compound was added for the actual growth assay.
Live-cell microscopy
Strains were imaged live in eight-chamber glass bottom dishes (ibidi) in SCD at 30 °C. The dishes were coated with 1 mg ml−1 concanavalin A (Sigma) and log-phase cells were pipetted into the chambers, after which they were allowed to settle for 30 min at 30 °C. The medium was removed by pipetting and replaced by fresh SCD after one wash to remove unattached cells. All live-cell microscopy experiments were conducted using an Olympus IXplore SpinSR spinning-disc confocal microscope with CSU-W1 (Yokogawa), 50-µm pinholes and a Flash4 sCMOS camera (Hamamatsu). Samples were illuminated with 488 nm (mNeonGreen or CloverGFP) and 561 nm (mCherry) lasers. The microscope was controlled by cellSens Dimension software (v.3.2, Olympus). SPB time-lapses, spindle time-lapses and spindle snapshots were made using a UPLXAPO ×60 oil immersion objective (NA 1.42, Olympus). Kinetochore time-lapses and snapshots were made using a UPLSAPO-S ×100 silicone immersion objective (NA 1.35, Olympus). For spindle time-lapses, cells were imaged using 15 z-stacks with a step size of 0.27 µm, for spindle snapshots, 23 z-stacks with a step size of 0.27 µm, for SPB time-lapses, 15 z-stacks with a step size of 0.36 µm, for kinetochore time-lapses, 15 z-stacks with a step size of 0.28 µm and for kinetochore snapshots, 23 z-stacks with a step size of 0.28 µm.
Image analysis
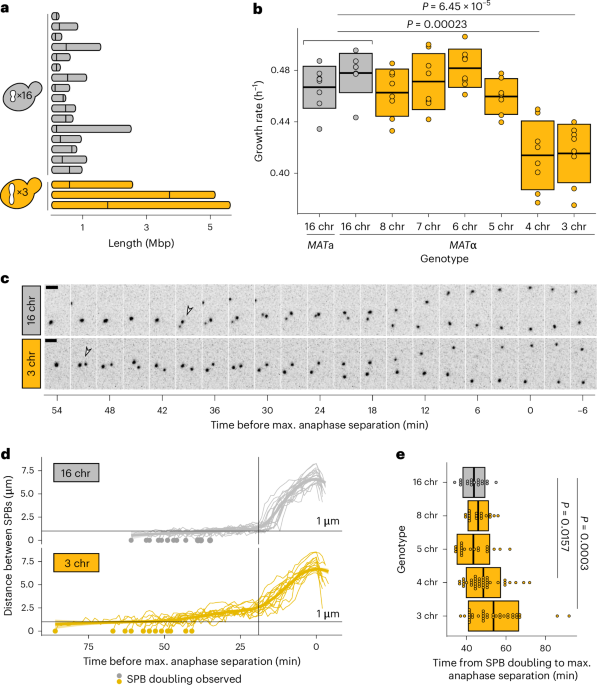
Fiji39 (ImageJ2 v.2.9.0) was used for basic image processing (cropping, z-stack projections, scaling and look up table (LUT) selection) and for measuring spindle curvature and SPB distance over time. To measure SPB distance over time, maximum intensity projections were made of 3-h time-lapses of Spc42-tagged strains, using 1-min intervals. Per genotype, ~20 regions of interest (ROIs) were selected of cells in which SPBs could be followed from the moment of duplication up until collapse of the spindle. The straight-line tool was used to measure inter-SPB distance for each time point. To quantify spindle curvature, maximum intensity projections were made of snapshot images of Tub1-tagged strains. Within each image, up to ten ROIs were selected of cells with clear anaphase spindles. For each genotype, 50 ROIs were selected in total (5–6 different images). The straight-line tool was used to measure the distance between both ends of the spindle and the freehand-line tool was used to trace the spindle and estimate spindle length. The spindle curvature was defined as the difference between the two measurements, divided by the straight distance. To quantify the proportion of cells with bi-lobed kinetochore distributions, ROIs were selected of dividing cells with a clear Ndc80-mNG and Spc42-mCherry signal (wild type, n = 50; three-chromosome strain, n = 97; 3 chr + benomyl, n = 131). Using the straight-line tool, inter-SPB distance was measured and used to classify cells into metaphase (inter-SPB distance <1.25 µm for wild type and <2.5 µm for three-chromosome strain) or anaphase (inter-SPB distance >1.25 µm for wild type and >2.5 µm for three-chromosome strain). The rotated rectangle tool was used to select an area from SPB to SPB, after which a profile plot was generated to visualize the distribution of the Ndc80 signal. This plot in turn was used to quantify the proportion of cells with a bi-lobed (bi-modal) signal.
Experimental evolution
For each genotype (16-, 8- and 3-chromosome strains), 56 replicate populations were established by inoculating single colonies in different wells of a 96-well plate containing 100 µl SCD. Populations were transferred daily around the same time, by inoculating 1 µl of old culture into 100 µl fresh SCD. Cells were grown at 30 °C with shaking. Every population reached saturation after 24 h, so we used the dilution factor (1:100) to estimate the number of generations per transfer (~6.7). To monitor average growth rate throughout evolution, one of the 96-well plates was evolved in the BioTek Epoch2 microplate reader (Agilent). Populations were frozen every fourth transfer and at time points of particular interest (for example, 100 generations). The experiment was stopped at 150 generations, at which point the growth rate data indicated that three-chromosome strains had repaired their growth defect. For sequencing and ploidy determination, frozen populations were streaked on YPD plates to isolate single clones. Whole populations were grown for pulsed-field gel electrophoresis.
Whole-genome sequencing
The YeaStar genomic DNA kit (Zymo research) was used to isolate genomic DNA from single clones. Sequencing libraries were prepared using the Nextera kit as described previously40, starting with 5–10 ng genomic DNA. The quality of the pooled libraries was assessed by measuring concentrations on the Qubit (Invitrogen) and fragment size distribution on a Bioanalyzer platform (Agilent). Samples were sent for paired-end sequencing on an Illumina HiSeq X, with an average read length of 150 bp. The quality of the reads was assessed using FastQC v.0.11.9 (Babraham Bioinformatics) and Nextera transposase sequences were trimmed using Trim galore! v.0.6.7 (Babraham Bioinformatics). Trimmed reads were mapped to the reference S288c genome (v.R64; NCBI, GCF_000146045.2) using bwa-mem v.0.7.17 with default settings41. Indels and single-nucleotide variants (SNVs) were called using GATK v.4.2.6.1 (ref. 42) using HaplotypeCaller and default settings. Variants present in the ancestral strains were filtered out, as well as SNVs with a quality score below 175 and indels with a quality score below 200. Finally, all remaining SNVs and indels were verified by manual curation in IGV43 v.2.12.3.
Pulsed-field gel electrophoresis
Yeast chromosome plugs were prepared as described in the Bio-Rad CHEF-DR-III manual. In brief, 0.25 ml stationary overnight culture was washed twice in 10 ml ice-cold 50 mM EDTA. Cells were resuspended in 250 µl cell suspension buffer (10 mM Tris, 50 mM EDTA and 2 mM NaCl), spun down, and resuspended in 40 µl cell suspension buffer. Then, 10 µl lyticase (Sigma) stock (1000 U ml−1) was added and the cell suspension was mixed with 50 µl molten 2% CleanCut agarose (Bio-Rad) after which the mixture was pipetted into a plug mould (Bio-Rad). Plugs were allowed to solidify on ice and were then pushed out of the moulds into microcentrifuge tubes with 0.5 ml lyticase buffer (10 mM Tris and 50 mM EDTA) with 30 µl lyticase stock. The plugs were incubated at 37 °C for 2 h, after which they were transferred to new microcentrifuge tubes with 0.75 ml proteinase K buffer (10 mM Tris, 100 mM EDTA and 0.5% SDS) with proteinase K (23 U ml−1, VWR). The plugs were incubated at 50 °C overnight, after which they were equilibrated in new microcentrifuge tubes with 0.5× TBE before insertion into the gel (half a plug per lane). The gel was made using Pulsed-Field-Certified Agarose (1%, Bio-Rad) in 0.5× TBE, and was run on a CHEF-DR-III Pulsed-Field Gel Electrophoresis System (Bio-Rad), at 6 V cm−1, 120°, switch time 60–120 s, for 24 h at 14 °C. The gel was stained with GelRed (Sigma) for visualization.
Ploidy determination
Ploidy was determined as described previously by staining the cells with propidium iodide44. In brief, cells were fixed for 1 h in 70% ethanol, washed three times in 50 mM sodium citrate buffer, treated with 0.5 mg ml−1 RNase A (NEB) at 37 °C for 2 h and stained overnight at 4 °C with 25 µg ml−1 propidium iodide (Sigma). A haploid (BY4741) and diploid (BY4743) strain were used as controls and fluorescence of 30,000 cells was analysed by flow cytometry on an Acea Novocyte Quanteon (Agilent).
Ultrastructure expansion microscopy
Ultrastructure expansion microscopy (U-ExM) was performed as described previously45,46 with a few modifications. In brief, log-phase cells were fixed with 4% HCHO (FA) in PEM buffer (100 mM PIPES, 1 mM EGTA and 1 mM MgSO4, pH 9.0), washed twice with 1× PBS and once with PEM-S (1.2 M sorbitol in PEM). The fixed cells were resuspended in PEM-S buffer and were enzymatically digested with 2.5 mg ml−1 Zymolyase 20T at 37 °C with agitation for 15 min. Cells were washed once with PEM-S buffer. This was followed by overnight anchoring in acrylamide/formaldehyde (1% acrylamide and 0.7% formaldehyde diluted in 1× PBS) at 37 °C. The anchored cells were then allowed to attach to a 6-mm poly-l-lysine-coated coverslip for 1 h. Gelation was performed on ice using a monomer solution (19% (wt/v) sodium acrylate, 10% (v/v) acrylamide, 0.1% (v/v) N,N′-methylenebisacrylamide in PBS) and the gel was kept for polymerization for 1 h at 37 °C in a moist chamber. For denaturation, the gel was transferred to denaturation buffer (50 mM Tris, pH 9.0, 200 mM NaCl and 200 mM SDS, pH 9.0) and incubated at 95 °C for 1.5 h. Following denaturation, the gel was expanded with three subsequent washes with water. After expansion, the gel diameter was measured to determine the expansion factor. For U-ExM images, scale bars have not been rescaled for the gel expansion factor. Pan-labelling for U-ExM was carried out at 1:500 dilution with DyLight 594 NHS ester (Thermo Fisher Scientific, 46412) in 1× PBS overnight at 4 °C. For tubulin immunostaining, the gel was stained using YL1/2 anti-α-tubulin (rat) (a kind gift from G. Pereira, COS Heidelberg, Germany), as the primary antibody at 1:25 dilution and incubated overnight at 4 °C. The gel was then incubated with goat anti-mouse-IgG coupled to Alexa Fluor 488 (Invitrogen A11029) secondary antibody at 1:1,000 dilution and incubated at 37 °C for 3 h in the dark. The antibody dilutions were prepared in 3% BSA in 1× PBS with 0.1% Tween 20. The gel was washed thrice with PBS with 0.1% Tween 20 for 30 min at room temperature. The gel was expanded with three subsequent washes with water before imaging. For microscopy, poly-l-lysine-coated two-chamber glass-bottom dishes (ibidi) were used. Gels were cut to an appropriate size to fit the ibidi chambers. The gels were overlaid with water to prevent drying or any shrinkage during imaging. The gels were imaged using the Zeiss LSM980 Airyfast confocal microscope using a Plan-Apochromat ×63/1.4 oil DIC M27 objective.
Western blot for Pds1 dynamics after alpha-factor arrest
To be able to arrest the three-chromosome strain with alpha-factor, we switched the strain’s mating type from MATα to MATa using the method described above under ‘Strains’. Additionally, we endogenously tagged Pds1 with 3xHA in both the wild-type and three-chromosome strain. Cells were inoculated in 5 ml YPAD medium in the morning and this preculture was used to inoculate a 100 ml YPAD overnight culture so that the culture would reach OD600 0.2 the next morning. Cells were grown at 30 °C throughout the experiment. The next morning, cells were diluted once more and grown for an additional 1.5 h, so that we had stable 100 ml log-phase cultures of OD600 0.2 to start the arrest. The cells were then arrested in G1 using a final concentration of 4.0 µg ml−1 alpha-factor mating pheromone (Zymo Research) and incubated at 30 °C with shaking until the vast majority of cells in the population exhibited the ‘shmoo’ phenotype (2.5 h). G1-arrested cells were released by washing them three times in pre-warmed YPAD after which they were grown at 30 °C and samples were collected as needed. For one of the two experiments we prevented the cells from going into a second cell cycle by adding 4.0 µg ml−1 alpha-factor mating pheromone 45 min after release. For each time point, 2 ml of the culture was pelleted and snap-frozen using liquid nitrogen. The cell pellets were lysed by TCA precipitation47 and resuspended in 50 µl High Urea dithiothreitol (DTT) buffer (200 mM Tris-HCl, pH 6.8, 8 M urea, 5% w/v SDS, 1 mM EDTA, 100 mM DTT and bromophenol blue). Pds1 levels were monitored using a mouse anti-HA antibody (cat. no. 26183, Invitrogen, 1:1,000 dilution), actin levels were analysed using a mouse anti-actin antibody (cat. no. MAB1501R, Chemicon, 1:1,000 dilution) and an HRP-conjugated goat anti-mouse secondary antibody (cat. no. 31430, Invitrogen, 1:10,000 dilution). The blots were developed using a chemiluminescence substrate (Millipore cat. no. WBULP) and imaged using an Azure 280 imaging system (Azure). The Pds1 values shown in the plots were normalized to the time point with the highest Pds1 signal (45 min for the experiment shown in Fig. 5d, 105 min for the experiment shown in Extended Data Fig. 5f).
Statistics and reproducibility
Sample sizes were chosen to be comparable with published manuscripts within the field48,49. For population growth rate measurements and single-cell microscopy experiments, experiments were included if the control strains that were included in each experiment behaved as expected. Population growth experiments were each set up with 16 independent replicates and only replicates for which the gcplyr package failed to calculate a growth rate (for example due to bubble formation during incubation) were removed. Exact n values for each experiment can be found in the figure legends. For single-cell microscopy, 20 independent cells were chosen at random for each SPB tracking experiment and only cells for which the SPB signal could not be reliably identified for three or more sequential frames were removed from further analysis. Exact n values for each experiment can be found in the figure legends. Fifty cells were chosen for spindle curvature measurements. A total of 56 independent replicate populations were established for each genotype in the evolution experiments, of which one clone per population was sequenced for 4 (16-chromosome strain), 4 (8-chromosome strain) and 8 (3-chromosome strain) populations and 16 (16-chromosome strain), 16 (8-chromosome strain) and 56 (3-chromosome strain) were checked for ploidy. No further data were excluded from the analyses. All raw measurements can be found in the source data. Western blots were performed in duplicate using independent experiments. The experiments were not randomized. The investigators were not blinded to the allocation during experiments and outcome assessment.
Reporting summary
Further information on research design is available in the Nature Portfolio Reporting Summary linked to this article.


留言 (0)