
記住我


Cell lines were purchased from American Type Culture Collection (ATCC). The original LKR13K (KrasG12D) cells derived from KrasLA1-G12D mice26, LKR13KL (KrasG12D; Lkb1−/−) and LKR13KK (KrasG12D; Keap1−/−) cells were a gift from J. Heymach’s laboratory at MD Anderson Cancer Center. MIA PaCa-2 and SW837 cells were cultured in high-glucose DMEM (Sigma, D6429) with 10% FBS (Hyclone, Thermo Fisher Scientific, SH30084), NCI-H2122, NCI-H358 and LKR13 cells were cultured in RPMI (Gibco, 3A10491-01) with 10% FBS at 37 °C and 5% CO2 in a humidified incubator. For high-throughput screens, SW837 and NCI-H358 cells were cultured in high-glucose DMEM (Sigma, D6429) with 10% FBS in the presence of pen–strep (Gibco, 15140-106). CRISPR-Cas9-engineered human tumor cell lines were generated at Horizon Discovery.
Combination studies: cell cultureNCI-H2122 (human NSCLC cells, ATCC CRL-5985) cells were grown as described above. After expansion and passaging cells twice a week with a 1:2 to 1:4 dilution, we seeded 800 cells per well in 60 µl in 384-well plates (Greiner, 781182) for the proliferation assay. After 24 h, compounds were added with an ultrasonic dispersion system (Echo, Labcyte System) and incubated for another 72 h. Cells were then stained with CellTiter-Glo Reagent according to the manufacturer’s protocol (Promega, G924C) and incubated 15 min under shaking. Plates were then read with a plate reader (EnVision, PerkinElmer HTS Multilabel).
SW837 (human colon cells, ATCC CCL-235) cells were grown as described above. After expansion and passaging the cells twice a week with a 1:10 to 1:12 dilution, we seeded 500 cells per well in 60 µl in 384-well plates (Greiner, 781182) for the proliferation assay. After 24 h, compounds were added with an ultrasonic dispersion system (Echo, Labcyte System) and incubated for another 144 h. Cells were then stained with CellTiter-Glo Reagent according to the manufacturer’s protocol (Promega, G924C) and incubated 15 min under shaking. Plates were then read with a plate reader (EnVision, PerkinElmer HTS Multilabel).
NCI-H358 (human NSCLC cells, ATCC CRL-5807) cells were grown as described above. After expansion and passaging the cells twice a week with a 1:10 to 1:12 dilution, we seeded 500 cells per well in 60 µl in 384-well plates (Greiner, 781182) for the proliferation assay. After 24 h, compounds were added with an ultrasonic dispersion system (Echo, Labcyte System) and incubated for another 72 h. Cells were then stained with CellTiter-Glo Reagent according to the manufacturer’s protocol (Promega, G924C) and incubated 15 min under shaking. Plates were then read with a plate reader (EnVision, PerkinElmer HTS Multilabel).
CRISPR engineering of KRASG12C syngeneic mouse lung cancer cell linesTo convert LKR13K, LKR13KK and LKR13KL cell lines from KrasG12D to KrasG12C by homologous-directed repair, 50,000 cells were plated in a six-well plate and endogenous KrasG12D was knocked out using the snRNP complex by co-transfecting 13.8 µg of Cas9 nuclease (IDT) with 2.8 µg of G12D sgRNA (5′–GTGGTTGGAGCTGATGGCGT–3′) and 1 µM of G12C ssODN (5′–AGTTGTATTTTATTATTTTTATTGTAAGGCCTGCTGAAAATGACTGAGTATAAGCTTGTGGTGGTTGGAGCTTGTGGTGTAGGCAAGAGCGCCTTGACGATACAGCTAATTCAGAATCACTTTGTGGATGAGTATGACCC–3′) using Lipofectamine CRISPRMax reagent (Thermo). Forty-eight hours after transfection, cells were cultured in the presence of 1 µM MRTX1133 (KrasG12D inhibitor) to select for positively converted cells.
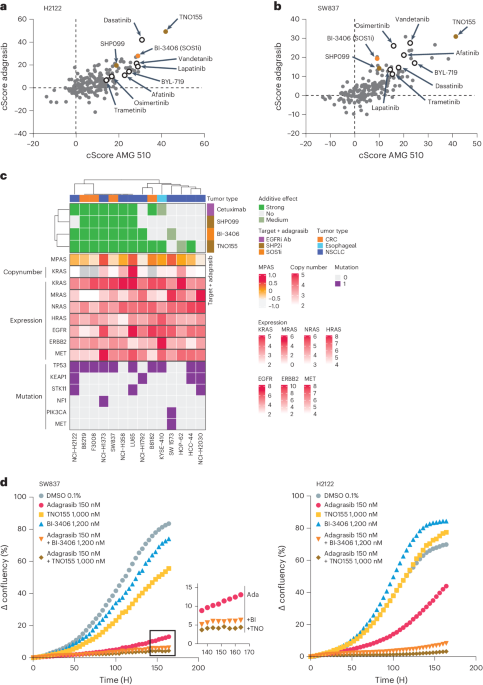
Growth curve fitting and combination scoringCurves were fitted using standard nonlinear regression with a four-parameter fit after normalization to percentage of maximum signal (the negative dimethylsulfoxide (DMSO) controls) for each treatment type. The combination cScore quantifies the deviation of the observed effect of two drugs combined when compared to the expected effect based on the observed monotherapies at the same concentration. For this, the measured cell viability is subtracted from the expected cell viability using the Bliss Independence Model61, creating a ‘gap’ matrix with the two monotherapy concentrations on the x and y axis, respectively and the unit (%PoC). The cScore is then defined as the average gap value of a 3 × 3 field matrix around the IC50 of both compounds or, if one or both compounds have no measurable IC50, the scores at the highest two concentrations of the Gap table. If the IC50 is close to the Cmax (maximum concentration of compound used) or Cmin(minimum concentration of compound used), the field used for averaging may be 2 × 3 or 2 × 2, but never <4. This approach focuses on drug combination effects around the IC50 values of the respective monotherapies. Positive cScores thus express the average increased potency of the combination over the monotherapies around the IC50 in % cell viability PoC.
Western blotSW837 or NCI-H2122 cells were seeded in six-well plates (Corning, 3506) at a density of 2.5 × 10⁶ or 1 × 10⁶ cells per well in complete culture medium. After overnight incubation at 37 °C and 5% CO2 in a humidified incubator, cells were treated with indicated concentrations of MRTX849, BI-3406, TNO155 or SHP099 alone or in combination; control cells were treated with 0.1% DMSO (Sigma-Aldrich, 41648). After 6 or 24 h of treatment, cells were washed with ice-cold PBS, collected and lysed with MSD lysis buffer (Mesoscale Diagnostics, R60TX-2) containing Tris, pH 7.5, 150 mM NaCl, 1 mM EDTA, 1 mM EGTA, 1% Triton X-100, 10 mM NaF, completed with protease and phosphatase inhibitors (Thermo Fisher Scientific, 78440). Protein concentrations were determined via Bradford assay according to manufacturer´s instruction (Bradford Dye, Bio-Rad, 5000205). Unless otherwise stated, 20 µg of total protein was separated on a 4–12% polyacrylamide gel (Bio-Rad, 3450124) in MOPS Running Buffer (Bio-Rad, 1610788) and blotted on a PVDF membrane (Bio-Rad, 1704157) with the Bio-Rad Trans-Blot Turbo Instrument. For separation of KRAS shift, total protein was separated on a 10% Tris-HCL polyacrylamide gel (Bio-Rad, 3450021) in Tris Glycine Running Buffer (Bio-Rad, 1610732). Membranes were blocked for 1 h in 4% skim milk (Millipore, 70166) in 1× TBS (Bio-Rad, 1706435)/0.1% Tween 20 (Bio-Rad, 161-0781) at room temperature and then probed overnight at 4 °C with primary antibodies against KRAS (LSBio, LS-C175665; 1:500 dilution), p-ERK Thr202/Tyr204 (Cell Signaling, 4376; 1:500 dilution), ERK (Cell Signaling, 9102; 1:1,000–1:2,000 dilution), phospho-S6 Ribosomal Protein (Ser235/236) (Cell Signaling, 2211; 1:500–1:1,000 dilution), DUSP6 (Abcam, ab76310; 1:1,000 dilution), cleaved PARP (Asp214) (Cell Signaling, 9541; 1:1,000 dilution), cyclin D1 (Biosite, ARB-Q4OL25-0,5; 1:100 dilution); p27 (BD, 610241; 1:1,000 dilution) and β-actin (Abcam, ab8226; 1:10,000 dilution). The phosopho-S6 ribosomal protein dilution was prepared in 5% BSA in 1× TBS/0.1% Tween 20, and all other antibody dilutions were prepared in 4% skim milk in 1× TBS/0.1% Tween 20. Cytiva Rainbow Molecular Weight Markers were used (Fisher Scientific, 45-001-591). After washing, membranes were incubated with the following secondary antibodies diluted in respective incubation buffers: goat anti-rabbit IgG, HRP conjugated (Dako, P0447; 1:1,000 dilution) and goat anti-mouse IgG, HRP conjugated (Dako, P0448; 1:1,000 dilution). Proteins were visualized using ECL Western Blotting detection reagent (Amersham, RPN2106) according to the manufacturer’s instructions.
For western blotting following the RAS pulldown assay the samples were eluted from the resin already in the provided 2× SDS sample buffer provided in the pulldown kit described below. All samples were incubated for 5 min at 95 °C and loaded onto 12% Criterion XT Bis-Tris Protein Gels (Bio-Rad, 3450118). Gels were transferred to a 0.2-µm PVDF membrane (Bio-Rad, 1704157) with the Trans-Blot Turbo Transfer System using the standard program for 30 min at 25 V. The following primary antibodies were used for immunoblotting: KRAS (1:1,000 dilution; LSBio, LS-C175665), HRAS (1:500 dilution; Proteintech, 18295-1-AP), MRAS (1:200 dilution; Abcam, ab176570), NRAS (1:1,000 dilution; Abcam, ab167136) and GAPDH (1:1,000 dilution; Cell Signaling, 2118).
GTP-KRAS ELISAGTP loaded KRAS was quantified using the KRAS In-well Lysis ELISA kit from Active Motif (cat. no. 52100) according to the manufacturer’s recommendations. In brief, 300,000 cells (MIA PaCa-2) or 600,000 cells NCI-H2122, SW837, NCI-H358) were seeded in a six-well plate and incubated for 48 h before addition of the drug in duplicates. The plates were incubated at 37 °C, 5% CO2 for specified amount of time. Cells were washed with PBS and lysed in 150 µl per well using Complete Lysis/Binding Buffer (ELISA kit from Active Motif). Wells were sealed and incubated for 15 min at 4 °C on a shaker (100–200 rpm). Supernatant of the lysates was transferred to a new plate, coated with GST-CRAF RBD provided by the manufacturer. Further incubation (primary and secondary antibody addition), washing and detection were performed according to instructions. Chemiluminescence was measured using the PerkinElmer EnSpire Multimode Reader.
Active RAS pulldown assaysNCI-H358, NCI-H2122 and SW837 cells were seeded into 15-cm dishes at a cell number selected based on proliferation rate and duration of drug treatment, to reach a confluency of 80–90% at the day of the lysate preparation. On the following day, the cells were treated with adagrasib (150 nM), SHP2i TNO155 (1,000 nM), BI SOS1i BI-3406 (1,200 nM) or a combination of adagrasib with BI-3406 or adagrasib with TNO155. Cells treated with DMSO (0.027%) served as vehicle control. Cells were treated for either 2 h or 48 h and subsequently collected for the assay using the Active Ras Pull-Down and Detection kit (Thermo Scientific, 16117). Pull-downs were performed according to manufacturer’s protocol with the following adaptation: Lysis/Binding/Wash buffer was supplemented with Halt Protease and Phosphatase Inhibitor Cocktail (100×) (Thermo Scientific, 78441). Given that NCI-H2122 cells are semi-adherent, the cells in the supernatant were collected, pelleted by centrifugation and added to the cells scraped off from the dishes. Then, 500 µg total protein was applied as input material for the pulldown per spin cup. Then, β-mercaptoethanol was added to complete the provided 2× SDS sample buffer. Pulldowns were performed in duplicates and pooled after elution from the resin to ensure sufficient material for SDS–PAGE and immunoblotting.
IncuCyte kinetic cell confluence proliferation assaySW837 and NCI-H2122 cells were seeded in 96-well plates (Corning, 3598) at a density of 4,000 cells per well in complete culture medium. Following overnight incubation at 37 °C and 5% CO2 in a humidified incubator, cells were treated with indicated concentrations of MRTX849, BI-3406, TNO155 or SHP099 as monotherapy or in combination. Control cells were treated with 0.1% DMSO. Immediately before treatment, cells were stained with IncuCyte caspase‐3/7 Green Apoptosis Assay Reagent (Essen BioScience, 4440) for apoptosis detection according to the manufacturer’s instruction. Cell growth was monitored using the IncuCyte S3 live cell imaging system (Essen BioScience). Using the ×10 objective, two regions of view were collected per well every 4 h for at least 7 days, with an extended collection period in cases of slow cell growth. Phase contrast and green channel (ex, 440/80 nm; em, 504/44 nm) were collected for each experiment. Data were analyzed using IncuCyte 2019B software. Values from both regions of each well were averaged and confluence was calculated as the percentage of the image area that was occupied by objects (phase area confluence). Apoptotic events were calculated as the percentage of the image area that was occupied by green objects.
siRNA transfection and cell viabilityFor knockdown experiments, NCI-H358-resistant cells were transfected with ON-TARGETplus SMARTpool siRNA duplexes (Dharmacon) targeting SHOC2 (L-019524-01) consisting of J-019524-09 GAAGAGAAUUCAAUGCGUU, J-019524-10 CGUCUUGGUCUGAGAUAUA, J-019524-11 UCGUAUAACUACUGUGGAA and J-019524-12 GAGGUAGUAUAGUUAGAUA, MRAS siRNA pool (L-008586-00) consisting of J-008586-05 ACACAAUAUUCCGUACAUA, J-008586-06 CAACAAGGUCGAUUUGAUG, J-008586-07 GUAAUUAGGCAACAGAUUC and J-008586-08 UCAAAGACAGGGAGUCAUU or a non-targeting control using Lipofectamine RNAiMAX reagent according to the manufacturer’s instructions (Invitrogen). Cell viability assays were then performed using 10 nM siRNA in 96-well plates in a total volume of 100 µl per well. Adagrasib (300 nM), SOS1i (1 µM) and SHP2i (1 µM) were added 4 h after siRNA transfection. Viability was determined using CellTiter-Glo (Promega) 96 h post-transfection. Then, 30 µl CellTiter-Glo solution was added directly to the cell medium, mixed and incubated for 10 min before determination of the luminescence signal. The effectiveness of the knockdown was confirmed by qPCR. Treated cells were lysed and prepared for qPCR using the FastLane Cell RT–PCR_QuantiTect Multiplex RT–PCR kit (QIAGEN, 216513) according to the manufacturer’s protocol. The final reaction was prepared with 3 µl RNA lysate as a multiplex reaction in technical triplicates using MRAS TaqMan Assay probe Hs01031059_m1 (FAM) together with the endogenous control HPRT Hs02800695_m1 (VIC) from Thermo Fisher Scientific.
Whole-exome sequencing capillary immunoassayProteins were extracted in RIPA lysis buffer (Sigma-Aldrich, R0278) supplemented 1:100 with Halt Protease and Phosphatase Inhibitor Cocktail (Thermo Scientific, 1861282). Then, 0.5 µg µl−1 protein was used for the final reaction. Proteins were detected using the capillary immunodetection kit from Protein Simple (12–230 kDa Separation 8 × 25 Capillary Cartridges, SM-W004-1). Samples were diluted with the provided reagents of the EZ Standard Pack 1 (12–230 kDa, PS-ST01EZ-8) according to the manufacturer’s instructions. Antibodies were used to detect MRAS levels (anti-MRas antibody (EPR12457), rabbit ab176570, Abcam, 1:50 dilution). Vimentin (Vimentin (D21H3) XP, rabbit, 1:50 dilution, 5741, Cell Signaling) and E-cadherin (ab231303, mouse, 1:100 dilution, Abcam) were used to detect EMT and anti-actinin was used for normalization (1:200 dilution, rabbit, 3134, Cell Signaling). Secondary antibodies against mouse and rabbit were also obtained from Protein Simple (Anti-Mouse Detection Module, DM-002 and Anti-Rabbit Detection Module, DM-001).
Oncogenic KRAS variant generation and viabilityBa/F3 cells (DSMZ, cat. no. ACC300) were grown in RPMI-1640 medium supplemented with 10% FCS at 37 °C in 5% CO2 atmosphere in the presence of 10 ng ml−1 interleukin-3 (R&D).
Ba/F3 cells were transduced with retroviruses encoding pMSCV_KRAS_G12C_single site variant Library (ssvL) cloned at TWIST Biosciences and harboring a pool of each possible variant at any AA position of the KRAS gene (3,756 variants), a puromycin resistance gene and green fluorescent protein (GFP). Platinum-E cells (Cell Biolabs) were used for retrovirus packaging. Retrovirus and 4 μg ml−1 polybrene were added to Ba/F3 cells for spinfection. Infection efficiency was confirmed by measuring GFP-positive cells using a cell analyzer. The infection rate was kept low (~6%) to promote the single infection of one cell. Cells with a library representation of >1,000× were further cultivated in the presence of puromycin (1 μg ml−1) to select for transduced cells. Following selection, interleukin-3 was withdrawn from transgenic Ba/F3 cells expressing the oncogenic KRAS variants (KRAS ssvL Ba/F3) to make cells dependent on transgene activity. Initial quality check of the library was then performed by RNA sequencing to ensure proper library coverage.
For colony growth assays, KRAS ssvL BaF/3 cells were seeded into 96-well plates at 250 cells per 100 μl in growth medium, providing only a subset of the mutation spectrum per well, and allowing slower-growing variants to arise by preventing stronger drivers to overgrow the resistant population. We used 5 × 96 wells for each condition. The 481 wells provide a ~30-fold coverage of each variant for each condition. Compounds were added alone or in combination with two different doses of SOS1i. Treated cells were incubated for 14 days at 37 °C with 5% CO2 with an addition of 100 µl medium/cpd mixture after 7 days. AlamarBlue Cell Viability assay (Thermo Fisher) was performed, and after 6 h, fluorescence was measured by using the multilabel Plate Reader VICTOR X4. The raw data were imported into Microsoft Excel and the signal to background ratio was calculated. Ratios >1.5 were counted as colony growth and then visualized in Prism, GraphPad.
Cell line-derived efficacy studies and biomarker studies in miceWe used 7–10-week-old female BomTac:NMRI-Foxn1nu (SW837 and NCI-H2122) or 7-week-old female CB-17/Icr-Prkdcscid/Rj (NCI-H358) mice for all xenograft studies. For biomarker and efficacy experiments using SW837 or NCI-H358 tumor-bearing mice, female mice were engrafted subcutaneously with 5 million cells suspended in Matrigel (Corning, 356231) diluted in 1× PBS with 5% FCS. For biomarker and efficacy experiments using NCI-H2122 tumor-bearing mice, female mice were engrafted subcutaneously with 5 million cells suspended in in 1× PBS with 5% FCS. Tumors were randomized by tumor size in groups using the automated data storage system Sepia. Mice were treated once at time point 0 h (qd, once daily) and in addition 6 h later in case of twice daily treatment (bid, twice daily). Tumor size was measured by an electronic caliper and body weight was monitored daily. The analysis follows largely the procedures described previously62,63. BI-3406, adagrasib and TNO155 were dissolved in 0.5% Natrosol plus 0.5% DMSO. BI-3406 was administered at 50 mg kg−1 orally twice a day, adagrasib at either 50 or 100 mg kg−1 orally once per day, and TNO155 at 10 mg/kg, bid. Trametinib was dissolved in 0.5% DMSO and 0.5% Natrosol and dosed twice daily with 0.1 mg kg−1. Cetuximab was dissolved in 0.9% NaCl and dosed at 20 mg kg−1 i.p. twice a week. The control group was treated with 0.5% of Natrosol orally and 0.9% NaCl i.p. in the same frequency as in the treatment groups in the respective experiments (twice daily (orally), twice weekly (i.p.)). All compounds were administered either intragastrically by gavage (10 ml kg−1) or i.p. (cetuximab). Mice included in the biomarker studies were treated for 7 continuous days. Tumors were explanted at 4 h, 24 h or 48 h after the last dose and were either embedded in paraffin or fresh frozen for further analysis.
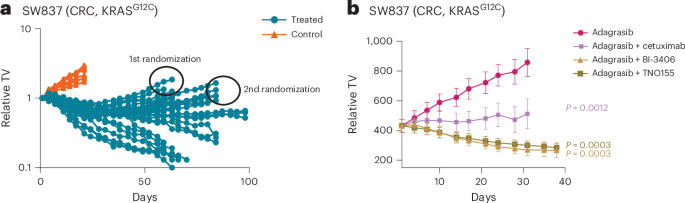
For investigating the efficacy of treatments on SW837 xenograft models with acquired adagrasib resistance, animals bearing established SW837 tumors were treated long-term with 50 mg kg−1 adagrasib for 5 days on and 2 days off per week. Tumor size was measured by an electronic caliper and body weight was monitored daily. Most tumors first underwent regression, with outgrowth occurring after several weeks of treatment. Outgrowing tumors that reached an increase of tumor size of at least 100 mm³ compared to the smallest size of the respective tumor then were randomized on day 63 and 84 for inclusion in treatment groups (n = 9 mice) for a second treatment. Results of the efficacy experiments starting on day 63 and day 84 were combined for analysis as no difference was observed in the outcome.
For investigating the efficacy of BI-3406 and adagrasib combination rechallenge after initial adagrasib monotherapy, animals bearing established NCI-H2122 tumors were first treated daily with 100 mg kg−1 adagrasib or with vehicle control. Tumor size was measured by an electronic caliper and body weight was monitored daily. As the majority of adagrasib-treated tumors did not go into regression, we re-randomized tumors at an average size of 300 mm3 after 15 days of treatment. Tumors were randomly reassigned using the automated software Sepia (as described) to either continue adagrasib monotherapy (100 mg kg−1 daily) or receive the combination of adagrasib (100 mg kg−1 daily) with BI-3406 (50 mg kg−1 twice daily) for a further 35 days.
All animal studies performed at Boehringer Ingelheim were approved by the internal ethics committee and the local Austrian governmental committee, with maximal tumor size/burden being greater or equal to 1,500 mm3. Maximal tumor size was not exceeded in any study. Mice used in Boehringer Ingelheim studies are group housed within environmentally controlled conditions with a 12-h light–dark cycle at 21 ± 1.5 °C, 55 ± 10% humidity and received food and water ad libitum. Sample sizes were determined by performing power analysis.
PDX studiesPDX model characterization and profiling have been described previously23. The F3008 PDX study was performed in female NSG (NOD.Cg-Prkdcscid Il2rgtm1Wjl/SzJ) mice (The Jackson Laboratory, cat. no. 005557) and the B8032 PDX study was performed in female athymic nude (NU(NCr)-Foxn1nu; strain 490) mice (Charles River Laboratories, cat. no. 24106219). For each model, tumor fragments (4 × 4 × 4 mm3) were implanted on the right hind flanks of the mouse host and allowed to grow to an average volume of 100–250 mm3 as monitored by caliper measurements. All orally administered compounds were dosed on a schedule of 5 days on and 2 days off. At enrollment, animals were randomized and treated with vehicle (0.5% Natrosol) orally twice a day (6 h apart), BI-3406 at 50 mg kg−1 orally twice a day (6 h apart), cetuximab at 15 mg kg−1 i.p. twice a week, SHP099 at 25 mg kg−1 orally once per day, adagrasib at 100 mg kg−1 orally once per day, or adagrasib (orally once per day) plus BI-3406 at 50 mg kg−1 orally twice a day (6 h apart) or cetuximab at 15 mg kg−1 i.p. twice a week. Mice were 11 weeks old and treatment group sizes included at least 5–8 mice per group. All animals received LabDiet 5053 chow ad libitum. Adagrasib was purchased from MedChemExpress, cetuximab was purchased from MD Anderson Cancer Center pharmacy and BI-3406 was synthesized at Boehringer Ingelheim. During the PDX studies, tumor growth was monitored twice a week with calipers and the TV was calculated as TV = (D × d2/2), where D is the largest and d is the smallest superficial visible diameter of the tumor mass. All measurements were documented as mm3. Body weights were measured twice weekly and used to adjust dosing volume and monitor animal health. All procedures for PDX studies were reviewed and approved by the Institutional Animal Care and Use Committee (00000884-RN04) at MD Anderson Cancer Center, with maximal tumor size/burden being greater or equal to 2,000 mm3. Maximal tumor size was not exceeded in any study. Mice used in PDX studies were group housed within environmentally controlled conditions with 12-h light–dark cycle at 21–23 °C, 40–60% humidity and received LabDiet 5053 chow and sterile water ad libitum. Sample sizes were determined based on a previous, similar study23.
Pharmacodynamic biomarker analysisFor the pharmacodynamic biomarker studies using F3008 CRC PDX models, tumor fragments (4 × 4 × 4 mm3) were implanted on the right hind flanks of NSG female mice (Jackson Laboratory) and allowed to grow to an average volume of 250–350 mm3 as monitored by caliper measurements. At enrollment, animals were randomized and treated for 5 days with vehicle (0.5% Natrosol) orally twice a day (6 h apart), adagrasib at 100 mg kg−1 orally once per day, or adagrasib plus BI-3406 at 50 mg kg−1 orally twice a day (6 h apart) or cetuximab at 15 mg kg−1 i.p. on day 1 and day 4. Tumors were collected 4 h after the last dose on the fifth day of treatment and fixed in 10% neutral buffered formalin overnight and then processed and embedded in paraffin. Formalin-fixed and paraffin-embedded (FFPE) blocks were sectioned into 3-μm thick sections, deparaffinized, then rehydrated by serial passage through xylene and graded alcohol. Sections were subjected to an initial heat-induced epitope retrieval in citrate buffer, pH 6, at 95 °C for 15 min. Anti-phospho-p44/42 MAPK (ERK1/2) (Thr202/Tyr204) (1:2,000 dilution, Cell Signaling Technology, 4370) was developed using Opal tyramide signal amplification followed by direct immunofluorescence of HLA conjugated to Alexa 647 (1:250 dilution, Abcam, 199837). An RNAscope in situ hybridization assay was performed following the manufacturer’s protocol (Advanced Cell Diagnostics) using DUSP6 (cat. no. 405361), EGR1 (cat. no. 457671-C2) and POLR2A (cat. no. 310451-C4) probes. Appropriate positive and negative controls were included with the study sections. Digital images of whole-tissue sections were acquired using Vectra Polaris Automated Quantitative Pathology Imaging System (Akoya Biosciences) and representative regions were selected for each whole slide and processed using inForm Software v.2.4 (Akoya Biosciences). Processed images were then analyzed using HALO Software v.3.2 (Indica Labs).
For pharmacodynamic biomarker studies using NCI-H2122 and SW837 models, animals were first randomized and treated for 5 days with the dosing schedules described above. Tumors were collected at 4, 24 and 48 h after last dose of treatment. Tumor samples were FFPE and processed as described above. In brief, FFPE blocks were sectioned into 3-μm thick sections, deparaffinized and rehydrated by serial passage thorough xylene and graded alcohol. Sections were then subjected to heat-induced antigen retrieval and stained for anti-phospho-p44/42 MAPK (ERK1/2) (Thr202/Tyr204) and anti-KI-67 (CST, 9027, 1:400 dilution in PBS/2% BSA) on bond RX (LEICA). Appropriate negative and positive controls and isotype controls were included. Digital images of whole tissue sections were acquired with NanoZoomer scanner (Hamamatsu) and processed images were then analyzed using HALO Software v.3.2 (Indica Labs). Results were reviewed by a pathologist.
Measurement of plasma concentrationsCompound concentrations in plasma aliquots were measured by quantitative HPLC–MS/MS using an internal standard. Calibration and quality control samples were prepared using blank plasma from untreated animals. Samples were precipitated with acetonitrile and injected into a HPLC system (Agilent 1200). Separation was performed by gradients of 5 mmol l−1 ammonium acetate pH 4.0 and acetonitrile with 0.1% formic acid on a 2.1 × 50 mm Xbridge BEH C18 reversed-phase column with 2.5 µm particles (Waters). The HPLC was interfaced by ESI operated in positive ionization mode to a triple quadrupole mass spectrometer (5000 or 6500+ Triple Quad System, SCIEX) operated in multiple reaction monitoring mode. Chromatograms were analyzed with Analyst (SCIEX) and pharmacokinetic parameters were calculated by non-compartmental analysis using BI proprietary software.
DNA isolation for WGSAt least 2 million cells were washed in PBS. DNA was isolated using NEB Monarch Genomic DNA Purification kit. Dry DNA pellets (at least 1.5 µg per sample) were sent to Sequanta Technologies for whole-genome sequencing. Next-generation sequencing libraries were prepared with the Illumina Truseq DNA PCR-free kit and sequenced on the Novaseq6000 platform aiming for 90 G (gigabases per sample) of reads over Q30 quality.
RNA isolation and sequencing library preparation for expression profilingCell line-derived xenograft samples for expression profiling were prepared with either the QuantSeq or TruSeq protocol. QuantSeq libraries were prepared as previously described23. In brief, cells were lysed in TRI Lysis Reagent (QIAGEN, 79306) according to the manufacturer’s instructions. Instead of chloroform, 10% volume 1-bromo-2-chloropropane (Sigma-Aldrich, B9673) was added. Total RNA was isolated with RNAeasy Mini kit (QIAGEN, 73404). QuantSeq libraries were prepared using the QuantSeq 3′ mRNA-Seq Library Prep kit FWD for Illumina from Lexogen (015.96) according to the manufacturer’s instructions. Samples were subsequently sequenced on an Illumina NextSeq 500 System with a single-end 76 bp protocol. For TruSeq, a similar RNA isolation protocol was used and RNA-seq libraries were prepared using TruSeq RNA library preparation kit v2 according to the manufacturer’s instructions.
Data analysesStatistical analyses were performed with R v.4.0.2 and Bioconductor 3.7 or GraphPad Prism (v.9.3.1). Associations of gene mutations with the sensitivity status of cell lines as well as comparisons of TVs between control and experimental groups were analyzed with a Fisher’s exact test. All other data meeting the requirements for parametric analyses were assessed with paired Student’s t-tests or one-way analysis of variance. All statistical analyses used absolute values when calculating TV. Datasets that deviated from normal distribution were analyzed with a nonparametric two-sided Wilcoxon rank-sum test. When applicable, P values were adjusted for multiple comparisons according to Bonferroni–Holm, Benjamini–Hochberg FDR analysis or Tukey’s multiple comparisons test. The level of significance was fixed at α = 5% such that an (adjusted) P value <0.05 was considered to be statistically significant. Differences were observed to be indicative whenever 0.05 ≤ P < 0.10.
Gene expression (RNA-seq) analysis was performed as previously described23. In brief, reads from grafted samples were filtered into human and mouse reads using Disambiguate64. The filtered reads were then processed with a pipeline by building upon the implementation of the ENCODE ‘Long RNA-seq’ pipeline; filtered reads were mapped against the Homo sapiens (human) genome hg38/GRCh38 (primary assembly, excluding alternate contigs) or the Mus musculus (mouse) genome mm10/GRCm38 using the STAR (v.2.5.2b)65 aligner allowing for soft clipping of adaptor sequences. For quantification, we used transcript annotation files from Ensembl v.86, which corresponds to GENCODE 25 for human and GENCODE M11 for mouse. Samples were quantified with the above annotations, using RSEM (v.1.3.0) and featureCount (v.1.5.1)66. Quality controls were implemented using FastQC (v.0.11.5), picardmetrics (v.0.2.4) and dupRadar (v.1.0)67 at the respective steps.
Differential expression analysis was performed on the human mapped counts derived from featureCounts using DESeq2 (v.1.28.1)68. We used an absolute log2 fold change cutoff of 1.3 and FDR < 0.05.
GSEA was performed using fgsea69 R/Bioconductor (v.1.14) package and hallmark gene sets from the molecular signatures database, MsigDB v.7.5.1 (ref. 70). The resulting nominal P values were adjusted using the Benjamini–Hochberg multiple testing correction method and gene sets with adjusted P values <0.01 were considered as significant.
Heatmaps of GSEA were generated using ComplexHeatmap (v.2.4.3)71 and upset plots were generated using UpSetR (v.1.4.0)72 R/Bioconductor packages. All other figures from data analyses were visualized using ggplot2 (v.3.3.2)73 R package.
MPAS31 were computed using ten genes previously published (PHLDA1, SPRY2, SPRY4, DUSP4, DUSP6, CCND1, EPHA2, EPHA4, ETV4 and ETV5) and single-sample gene set scoring using GSVA R/bioconductor package74. MPAS scores were computed for SW837, NCI-H2122 xenografts models treated with mono and combination treatments and published datasets75 treated with KRASG12Ci (Extended Data Fig. 10e).
Analysis of previously reported mutations associated with adagrasib resistanceWhole-genome sequencing reads from NCI-H358 models were aligned to the hg38 human reference genome using bwa to generate BAM files. In the next step, we performed a supervised analysis of previously reported mutations associated with adagrasib resistance in patients (Supplementary Tables 10 and 12). Using BAM files, we generated pileup of reads using pysam (v.0.22.0; https://github.com/pysam-developers/pysam) at each position of these mutations and calculated the percentage of reads supporting reference and alternate allele.
Statistics and reproducibilityFor all the comparison and correlation analyses, exact P values are reported in the figures. Unless otherwise specified, Padj or FDR means-adjusted P values with the Benjamini–Hochberg method and two-sided Wilcoxon rank-sum test was performed. Data distributions were assumed to be normal, but this was not formally tested. Unless otherwise specified, all values were included, median and interquartile ranges were shown in all boxplots with whiskers extending 1.5 × interquartile range. For western blots on NCI-H2122 (Fig. 3c) and SW837 (Extended Data Fig. 3) cell lines, results were replicated using the KRASG12Ci, BI-1823911 and the former front-runner SOS1i candidate, BI-17101963.
Reporting summaryFurther information on research design is available in the Nature Portfolio Reporting Summary linked to this article.
留言 (0)