
記住我


This study enrolled 24 eyes of 24 patients with PC-pIOL implantation undergoing cataract surgery, the mean age of the patients was 37.75 ± 5.89 years, 15 females and 9 males. In total, the mean AL was 31.20 ± 2.06 mm, Km was 44.08 ± 1.78 D, ACD was 3.05 ± 0.37 mm, LT was 4.38 ± 0.35 mm, WTW was 11.80 ± 0.45 mm, and CCT was 534.79 ± 30.15 μm. The average IOL power was 3.98 ± 3.88 D. The preoperative and postoperative CDVA was 0.64 ± 0.43 and 0.14 ± 0.23 logMAR, respectively (Table 1).
Table 1 Characteristic biometric parametersAccuracy of IOL Power Calculation FormulasThe prediction outcomes of formulas are shown in Table 2. Among the formulas, the ME of Kane, SRK/T-WKmodified, Holladay 1-WKmodified, and Haigis-WKC1 displayed no significant difference from zero (P = 0.256, P = 0.413, P = 0.995, and P = 0.530, respectively). The myopic shift was found in Kane and SRK/T-WKmodified, and the hyperopic shift was found in SRK/T, Holladay 1, Haigis, Haigis-WKC1, BUII, BUIInoACD+LT, EVO 2.0, EVO 2.0noACD + LT, Pearl-DGS, and Pearl-DGSICL.
Table 2 Accuracy of IOL Power Calculation Formulas (N=24)Comparing the MedAE, the best results were obtained by EVO 2.0 (0.33), Kane (0.35), SRK/T-WKmodified (0.42), Holladay 1-WKmodified (0.44), and Haigis-WKC1 (0.46), and the worst by Haigis (0.75), SRK/T (0.79), and Holladay 1 (1.32). The MedAE among formulas had significant difference (P < 0.001). In terms of the RMSAE, the Haigis-WKC1 obtained the lowest RMSAE (0.591), followed by Holladay 1-WKmodified (0.622), SRK/T-WKmodified (0.623), EVO 2.0noACD + LT (0.670), EVO 2.0 (0.673), Kane (0.678), and the Haigis (1.061), SRK/T (1.188), Holladay 1 (1.513) yielded the highest RMSAE. The detailed comparison outcomes of the RMSAE were shown in Supplementary Table 2.
Comparing the proportion of eyes within ± 0.25, ± 0.50, ± 0.75 and ± 1.00 D of PE between formulas (Fig. 3), no significant difference was found in PE within ± 0.25 D between formulas (P = 0.573), but PE within ± 0.5 D, ± 0.75 D and ± 1.0 D were significantly different (P = 0.005, P < 0.001, and P < 0.001, respectively). Most formulas achieved a percentage of > 50% within the ± 0.5 D category. Kane demonstrated the highest percentage (62.5%), followed by EVO 2.0, EVO 2.0noACD + LT, and Haigis-WKC1 (both 58.3%). SRK/T, Holladay 1, and Haigis had low percentage of PE within ± 0.5 D, with a noticeable increase in percentage facilitated by WK-AL adjustment (54.2–58.3%).
Fig. 3
Proportion of eyes with absolute PE within ±0.25, ±0.50, ±0.75 and ±1.00 D
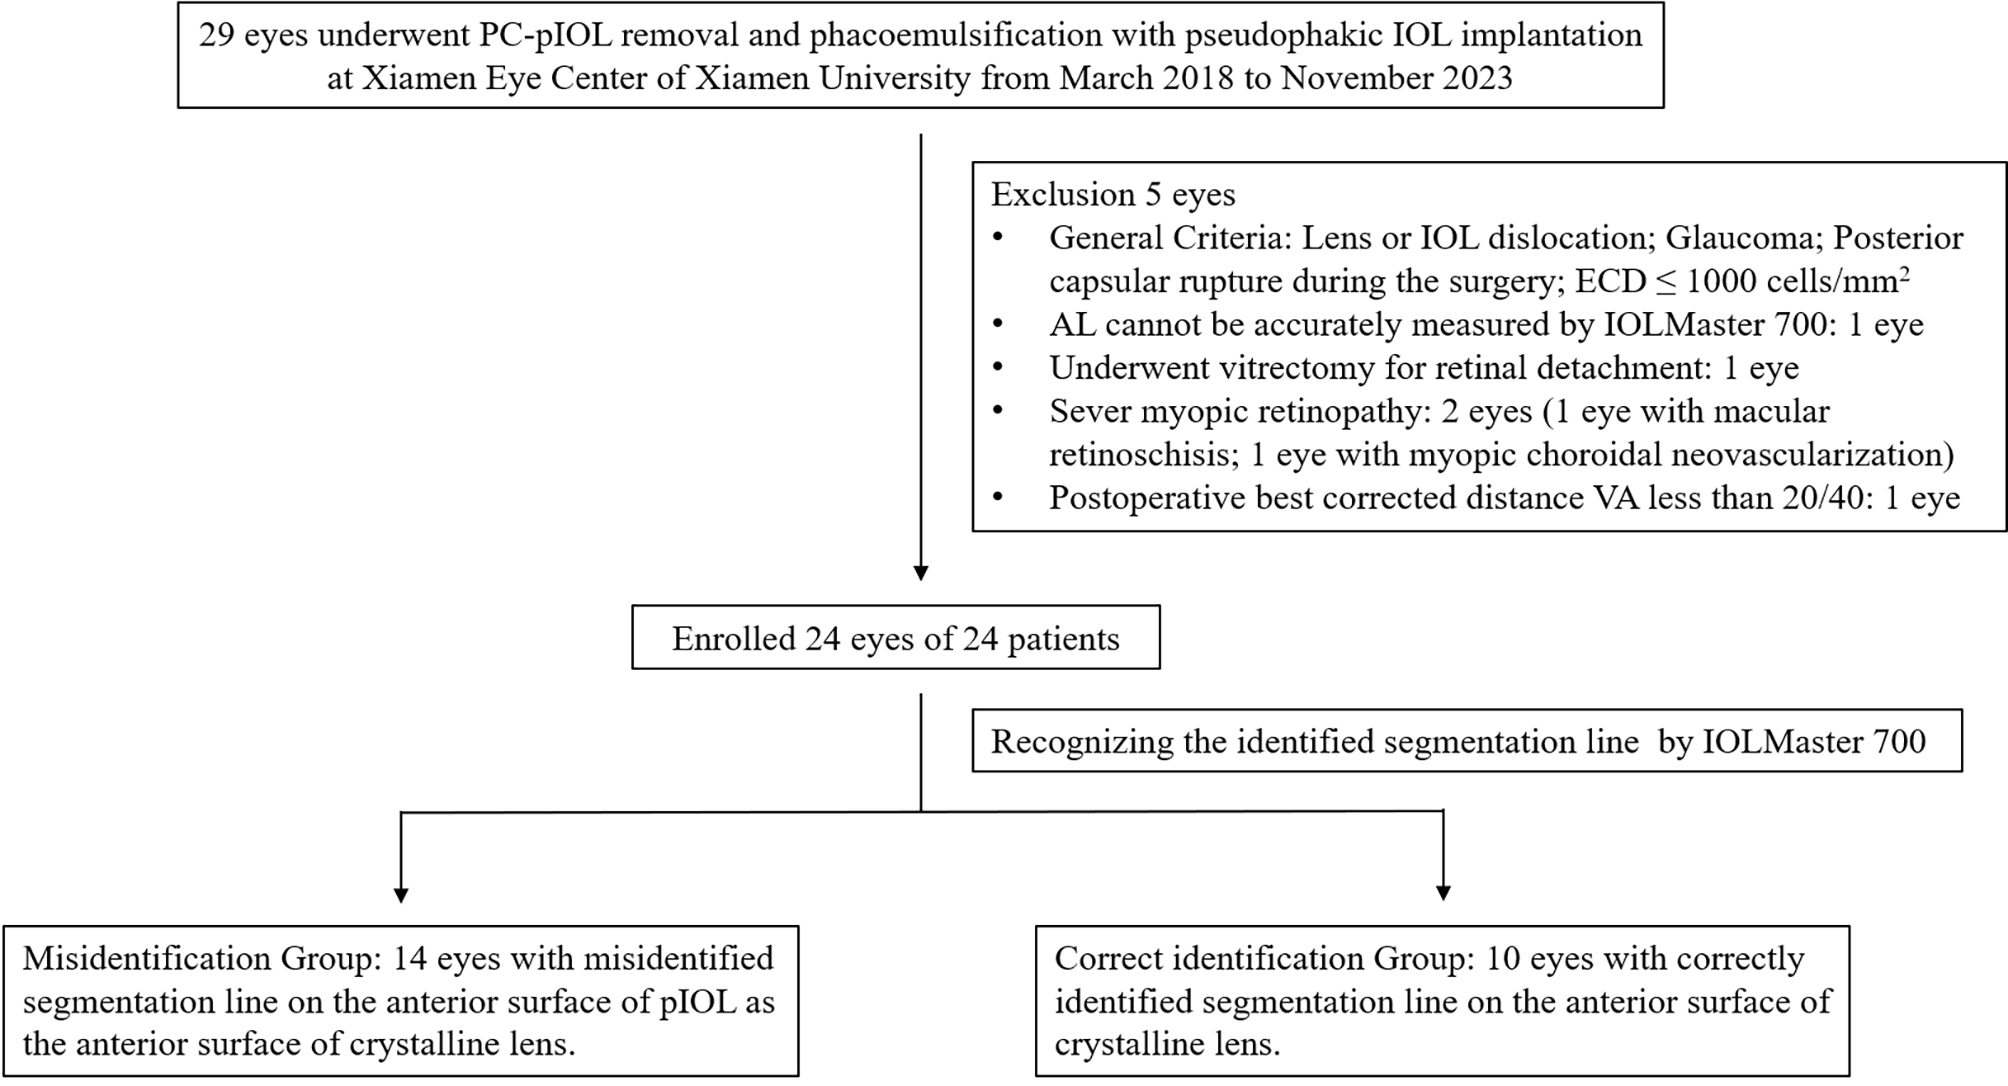
Comparisons of misidentification and correct identification groupsIn this study, a total of 14 eyes were misidentified by the IOLMaster 700, resulting in a misidentification rate of approximately 58.3%. Upon comparing the biometry between the misidentification and correct identification groups, no statistically significant differences were found in AL, Km, LT, WTW, ECD, and IOL power. For ACD, the misidentification and correct identification groups were 2.81 ± 0.23 and 3.38 ± 0.25, respectively (P < 0.001). No significant difference was found in preoperative and postoperative CDVA between the two groups (Table 1).
The calculation outcomes of formulas incorporating ACD into calculation in both the misidentification and correct identification groups were presented in Table 3. In the misidentification and correct identification groups, the MedAE in ascending order was Kane (0.31; 0.36), EVO 2.0 (0.33; 0.48), Haigis-WKC1 (0.35; 0.55), Pearl-DGS (0.43; 0.73), Pearl-DGSICL (0.43; 0.75), BUII (0.47, 0.79), Haigis (0.75, 1.06), respectively. In terms of the RMSAE, the misidentification group in ascending order was Haigis-WKC1 (0.458), EVO 2.0 (0.619), Pearl-DGS (0.642), Pearl-DGSICL (0.647), Kane (0.746), BUII (0.817), Haigis (0.883), and the correct identification group was Kane (0.569), Haigis-WKC1 (0.738), EVO 2.0 (0.743), Pearl-DGS (0.887), Pearl-DGSICL (0.898), BUII (0.925), Haigis (1.268).
Table 3 Prediction outcomes of formulas incorporated ACD into calculation in misidentification and correct identification groupsWithin the misidentification group, BUII and BUIInoACD+LT exhibited ME values of 0.27 ± 0.80 and 0.21 ± 0.87 D, MAE was 0.63 ± 0.54 and 0.69 ± 0.53 D, MedAE was 0.47 and 0.53 D, and RMSAE was 0.817 and 0.862 D, respectively. For EVO 2.0 and EVO 2.0noACD + LT, ME was 0.16 ± 0.62 and 0.15 ± 0.60 D, MAE was 0.49 ± 0.39 and 0.47 ± 0.38 D, MedAE was 0.33 and 0.36 D, and RMSAE was 0.619 and 0.598 D, respectively.
留言 (0)