
記住我

To observe tarsal development during the pupal stage in detail, we took advantage of long-term live imaging. How the final shape of the tarsus is formed through very dynamic changes at both tissue and cellular levels was successfully traced. Together with earlier observations, we divide the entire process into the following five stages for convenience (Fig. 1).
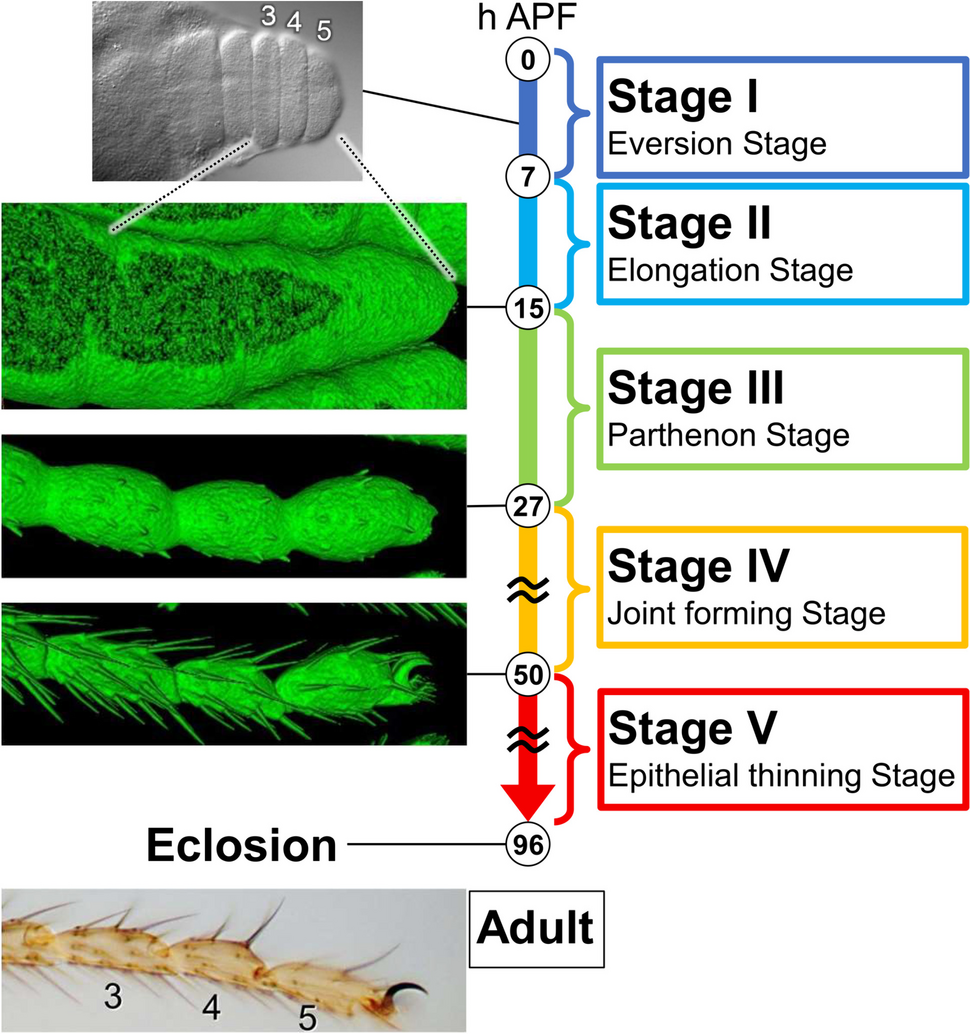
Fig. 1
The overview of the final shape formation of Drosophila adult tarsus during the pupal stage. We divided the entire process into five stages based on the morphological changes at both tissue and cellular levels observed in long-term live imaging experiments. Representative photos or surface-rendered images (sGMCA signal) corresponding to several time points are shown on the left side. See also Supplemental Movies S1, S3
Stage I (0–7 h APF)—eversion stageJust after puparium formation (APF), the leg disc partially elongates and evaginates from the center, making each tarsal segment recognizable morphologically. This process has been reported to be controlled by cell shape changes, cell rearrangements, and the interaction between the disc epithelium and peripodial epithelium (Condic et al. 1991; Proag et al. 2019). As this process has been described in detail previously, we do not get into it in this paper.
Stage II (7–15 h APF)—elongation stageAfter the eversion of the leg disc, the elongation of the tarsus further proceeds by unfolding of the morphologically distinctive tarsal segments. By 15 h APF, the tarsus fully elongates, with the tarsal segments no longer visible morphologically, forming a bloated tube with a large lumen diameter. Both the length and diameter of the tarsus reach their maxima. The latter is more than three times the diameter of the adult tarsus (Fig. S1B). The pupal cuticle is formed at least by the end of this stage.
Stage III (15–27 h APF)—Parthenon stageThe tarsus decreases its diameter dramatically (Fig. S1B). During this change, indentations between tarsal segments reappear and deepen, making segmental structures visible again. Moreover, some bristles start to sprout by the end of this stage. The name of this stage comes from an interesting structure of the epithelial cells seen in this stage, which we named the Parthenon-like structure. Its details are described later.
Stage IV (27–50 h APF)—joint forming stageThe indentation between tarsal segments deepens further, and the joint formation between tarsal segments proceeds. Bristles fully elongate, and their formation is nearly completed. Furthermore, the formation of pretarsal structures, such as claws and pulvilli occurs mainly in this stage. By about 50 h APF, the formation of the external shapes of the adult leg is almost complete.
Stage V (50–96 h APF)—epithelial thinning stageSeen from the outside, the shape of the leg hardly changes during this stage. However, we discovered that the thickness of the epithelial cell layer continues to reduce gradually. Thus, we separated this stage from Stage IV as an independent stage.
Hereafter, we describe the details of cell dynamics in each of the above stages except Stage I.
Stage II—elongation stageIn Stage II, the tarsus elongates to its maximum length along the proximodistal direction to form a broad and straight tubular structure. Live imaging was performed without removing the puparium in Stage II since it is difficult to remove the puparium without causing developmental defects before 12 h APF. In this condition, the depth of the focus at which clear images could be obtained was limited. In addition to this limitation, the tissue elongates so quickly that taking images as a Z series was also difficult. Accordingly, we acquired images of a single XY plane corresponding to the longitudinal section every 2 min. We used flies expressing GFP-CAAX (labeling the plasma membrane) and His2Av-mRFP (labeling the nuclei). At the beginning of the live imaging, 7 h APF, the everted tarsus was slightly elongated but the folding of each tarsal segment was still visible (Fig. S2A, Supplemental Movie S2). From around 9 h APF, the elongation of the tarsus was accelerated with the rapid unfolding of each tarsal segment. By 11 h APF, the folding disappeared almost completely, and the tarsus had become a bloated, straight epithelial tube (Fig. S2B–E). During this process, epithelial cells initially long in the apicobasal direction became cuboidal in shape.
Interestingly, a cluster of large cells was observed coming from the proximal side and spreading distally in the lumen of the elongating tarsus (Fig. S2B–E, Supplemental Movie S2). After this stage onwards, they were always observed in the tarsus (see below). Since these large cells expressed hemocyte-specific GAL4, such as He-GAL4 or srpHemo-GAL4, they appeared to be hemocytes (Fig. S3), presumably macrophage-like cells according to their morphology and behavior (see below).
Stage III—Parthenon stageFrom this stage onwards, the pupa becomes resilient to having its puparium removed and can develop into the adult after the complete removal of the puparium. The developing pupa without the puparium is only covered by the transparent pupal cuticle, which allows us to acquire clear images at relatively deeper focuses. Additionally, from Stage III onwards, changes in overall shape are no longer as rapid as in Stage II. Accordingly, we could collect Z series images at each time point during long-term live imaging experiments from Stage III (Supplemental Movie S1, S3). This long-term live imaging experiment allowed us to analyze detailed cellular behaviors. As mentioned above, the overall diameter of the tarsus decreases dramatically in Stage III. We observed that surprisingly dynamic changes in cell morphology occur inside during this process. Around 18 h APF, epithelial cells deformed their shapes and temporarily formed an interesting structure. We named it the Parthenon-like structure because it reminded us of the Parthenon, an ancient Greek ruin. Details of the Parthenon-like structure and associated cellular dynamics are described in the following three subsections.
The architecture of the Parthenon-like structureFirstly, flies expressing His2Av-mRFP (labeling the nuclei) and sGMCA (labeling actin) were observed, and Z series images were obtained every 15 min (Fig. 2, Supplemental Movies S1, S3). By reconstructing a 3D structure using a part of these images obtained at 18 h APF, we found a very curious architecture of the epithelial cell layer (Fig. 3A). Nuclei and most volumes of sGMCA signals were aligned as a monolayer on the apical (outer) side. At the basal (inner) side, sGMCA signals spread planarly, creating a thin layer. Between these two layers, pillar-like sGMCA signals were seen connecting them. There appeared to be open spaces or cavities between the pillars. Since sGMCA labels actin, it could be possible that epithelial cells are tightly lined up without space between them as usual and that it is the cytoskeleton forming the curious structure. However, similar structures were also observed in flies expressing plain GFP (labeling cytosol) under the control of Distal-less (Dll)-GAL4 (Dll>GFP) (Fig. S4A) and GFP-CAAX (labeling cell membrane) (see Fig. 3D–F).Thus, we concluded that epithelial cells themselves form this remarkable structure by deformation; that is, epithelial cells tightly align most of their cell body containing nuclei at the apical side, protrude cytoplasm as a pillar-like process in a basal direction, and then spread at the basal side, making cavities within the epithelial cell layer. As mentioned above, we named this structure the Parthenon-like structure after the ancient Greek ruin. We also observed the Parthenon-like structure in flies expressing Jupiter-GFP (labeling microtubule) and Sqh-GFP (labeling Myo II) (Fig. S4B, C). Thus, cytoskeletal molecules, such as actin, microtubule, and Myo II, appear to be assembled in cables inside the pillars. Within the Parthenon-like structure, several clusters of cells whose cell bodies and nuclei fell into cavities were observed (surrounded by a dashed line in Fig. 3A). The time-lapse observations until later stages and labeling of sensory cells by TagBFP driven by neuralized (neur)-GAL4, which is specifically expressed in the sensory cells, indicate that these cells are sensory organ cells (Fig. S4D–D”). Interestingly, we found that macrophage-like cells frequently existed and were actively moving around in the cavities between pillars (arrow in Fig. 3A). Their detailed behavior is described later.
Fig. 2
Dynamic shape changes in the tarsal epithelial cells in Stage III. A, B, C, D Stills from the live imaging of the distal part of the tarsus in the sGMCA (green) and His2Av-mRFP (magenta) expressing fly. The tissue rapidly narrows, and the indentation of joint regions progresses. A’, B’, C’, D’ Magnification of regions surrounded by the dashed lines in A, B, C, D, respectively. Apicobasal projections are seen in A’, B’, C’ and become difficult to distinguish in D’. Distal is to the right and dorsal to the top in all figures. Stages are shown at the lower right corners in A, B, C, D. Scale bars in A and A’, 50 μm for A, B, C, D and 10 μm for A’, B’, C’, D’, respectively. See also Supplemental Movie S3
Fig. 3
Architecture of the Parthenon-like structure. A The reconstructed image of epithelial cells forming the Parthenon-like structure in the sGMCA (green) and His2Av-mRFP (magenta) expressing fly. Nuclei and most volumes of sGMCA signals are aligned as a monolayer on the apical (outer) side. Pillar-like sGMCA signals are elongated in the apicobasal direction. At the basal (inner) side, sGMCA signals spread planarly, creating a thin layer. Macrophage-like cells are found in the cavities between the pillars (arrow). Several clusters of cells whose cell bodies and nuclei fall into cavities are seen (dashed line). These cells were suggested to be sensory organ cells (see also Fig. S4). B, B’ GFP-expressing cell clusters obtained in the mosaic analysis. B Mosaic GFP expression in the distal part of the tarsal segment 2 and proximal part of the tarsal segment 3 in 19 h APF induced in the Ay>GFP fly. Dashed lines indicate the outline of the leg. B’ Reconstructed image of the four GFP-expressing epithelial cells corresponding to cells surrounded by the dotted rectangle in B. The leftmost cell has one protrusion, while the one next has two. One of the protrusions extending from the second cell from the left appears to form a bundle with a protrusion extending from a neighboring cell (open arrow). See also Supplemental Movie S4. C Number of protrusions in each GFP-expressing cell. About two-thirds of epithelial cells had one protrusion, and one-third of them had two. D–F Stills from the live imaging of tarsal epithelial cells initiating the Parthenon-like structure formation. Cell membrane is labelled by GFP-CAAX (green), and nuclei are labelled by His2Av-mRFP (magenta). Triangular-shaped cavities are observed at the initiation of the process (asterisks in E, F). Strong signals of GFP-CAAX are observed where the pillars are formed (arrowheads in D, E). The elapsed time from D are indicated at the lower left corners. See also Supplemental Movie S5. Apical is to the top in A, B’, and D–F. Scale bars in B and B’, 20 μm and 5 μm, respectively. Scale bar in D, 5 μm for D–F
To reveal whether the pillar-like structures are contributed by all the epidermal cells or only a part of them, we carried out the mosaic analysis by the flip-out technique using flies having hsp70-FLP, UAS-GFP, and Ay-GAL4 (Golic and Lindquist 1989; Ito et al. 1997), in which small patches of epithelial cells were labeled by GFP (Fig. 3B). The reconstructed image of the representative cluster of four epithelial cells is shown in Fig. 3B’ and Supplemental Movie S4. The leftmost cell had one protrusion while the next one on the right had two. Moreover, the right protrusion of the second cell looked to be making a bundle with a protrusion from the adjacent third cell on the right of the second cell (open arrow in Fig. 3B’, Supplemental Movie S4). When counting how many protrusions each cell extended, we found that, in 18 h APF, all epithelial cells extended one or two protrusions (Fig. 3C; only one protrusion in about two-thirds of the epithelial cells and two in about one-third). These results indicate that all epithelial cells contribute to the pillars of the Parthenon-like structure and that each pillar is made up of protrusions derived from multiple adjacent cells.
Formation and disappearance of the Parthenon-like structureAs shown above, the shape of epithelial cells was cuboidal at the end of Stage II (Fig. S2E, Supplemental Movie S2). These cuboidal epithelial cells started to form rapidly the Parthenon-like structure with the onset of Stage III (Fig. 2A’, B’). The thickness of the epithelial cell layer rapidly increased with the elongation of the pillars of the Parthenon-like structure (Fig. S1C). Once the epithelial thickness reached its maximum, the Parthenon-like structure turned to be resolved rapidly by the shortening of the pillars and disappearance of the cavities (Fig. 2C’, D’), resulting in the decrease of the epithelial thickness (Fig. S1C). During the above process, the lumen diameter and overall diameter of the tarsus also reduced dramatically (Fig. S1B), implying a close relationship between the formation/disappearance of the Parthenon-like structure and the reduction of the tarsus diameter. The disappearance of the Parthenon-like structure progressed faster in the future joint region than in the inter-joint region, resulting in the invagination of the apical surface (see arrowheads in Supplemental Movie S3). This allowed the morphological distinction of tarsal segments again.
To reveal details in the Parthenon-like structure formation, Z stack images were obtained every 5 min using flies expressing GFP-CAAX and His2Av-mRFP (Fig. 3D–F, Supplemental Movie S5). Before the formation of the Parthenon-like structure initiated, cuboidal epithelial cells were aligned as a monolayer (Fig. 3D). In around 16 h APF, at the very beginning of the formation of the Parthenon-like structure, a part of the cytoplasm of epithelial cells protruded basally, while connections between neighboring cells at the basal surface looked to be maintained, resulting in the formation of triangular-shaped cavities (Fig. 3E, F, asterisks). In addition, relatively strong signals of GFP-CAAX were observed in the area where the pillars were being formed (Fig. 3D. E arrowheads). The protrusions then elongated basally to form the pillars (Fig. 3F).
The basal surface of the Parthenon-like structureAs the lumen diameter dramatically reduced during the formation and disappearance of the Parthenon-like structure, we thought that some structural changes in the basal part of the Parthenon-like structure must occur during this process. Thus, we focused on the structure and behavior of the basal surface of epithelial cells. To know its detailed structure, we observed the focal planes including only the basal surface of GFP-expressing epithelial cells (the floor of the Parthenon-like structure) in Dll>GFP flies (Fig. 4A–C’). Surprisingly, in 16.5 h APF, the basal surface of epithelial cells showed a mesh-like pattern and had many holes (Fig. 4B’). The live imaging showed these holes rapidly shrank and almost disappeared within 2 h, as the overall diameter of the tarsus reduced (Fig 4B’, C’, Supplemental Movie S6). To reveal how each epithelial cell comprises the basal meshwork, we carefully analyzed clusters of epithelial cells expressing GFP in Ay>GFP flies. Observation of 3D-reconstructed images of clusters showed that filopodia-like thin protrusions were elongated from the roots of the pillars (Fig. 4D, Supplemental Movie S7). According to this observation, we hypothesized that such filopodia-like protrusions connect to each other to form the basal meshwork as shown in the illustration in Fig. 4E.
Fig. 4
Basal-meshwork shrinkage of the Parthenon-like structure. A Schematic drawing showing the position of the focal plane to observe the basal surface of epithelial cells in B–C’, G, H. B–C’ Stills from live imaging of the basal surface of the tarsal segment 3 using the Dll>GFP fly. Regions surrounded by the dashed lines in B and C are magnified in B’ and C’, respectively. Many holes can be seen in B’, suggesting the basal surface forms a mesh-like structure. The holes become less visible in C’. See also Supplemental Movie S6. D Reconstructed image of a GFP-expressing cluster of tarsal epithelial cells viewing down on the basal side from an oblique angle. Thin projections are seen at the basal surface (arrowheads). See also Supplemental Movie S7. E Schematic drawing of the basal meshwork hypothesized from B’, C’, and D. F–F” Simultaneous observation of TagRFP-CAAX (cyan) and LanB1-GFP (green) at the basal meshwork. The positions of holes are largely shared between LanB1-GFP (F’) and TagRFP-CAAX (F”) signals. G, H Stills from live imaging of the basal surface of the tarsal segment 3 in the LanB1-GFP expressing fly, which are corresponding to B’, C’. See also Supplemental Movie S8. Stages are indicated at the lower right corners in B, C, F, G, H. Distal is to the right and dorsal to the top in B–C’, G, H. Scale bars in B, 20 μm for B, C, 10 μm for B’, C’, G, H, in D, 5 μm, in F, 10 μm for F–F”
Generally, with the basal surface of epithelial cells, the basement membrane is in contact. To investigate the structure of the basement membrane during the shrinkage of the basal meshwork of epithelial cells, we examined the basement membrane structure using flies expressing Laminin B1-GFP (LanB1-GFP) and RFP-CAAX (Fig. 4F–H, Supplemental Movie S8). LanB1 is a major component of the basement membrane. LanB1-GFP signals coincided with the basal surface of epithelial cells, as shown by the comparison between LanB1-GFP and RFP-CAAX signals (Fig. 4F–F”). The basement membrane also showed the mesh-like structure at the initiation of the Parthenon-like structure formation (Fig. 4G). The meshwork of LanB1-GFP signals also shrank, becoming uniform and membranous signals, as is generally seen (Fig. 4H). These observations indicate that the basement membrane structure also changed dramatically during the formation and disappearance of the Parthenon-like structure.
In addition to the meshwork to membranous change in the basal surface of the Parthenon-like structure, we found another interesting behavior of it. As shown in Fig. 5A, the basal surface of epithelial cells was winding along the proximodistal axis immediately after the Parthenon-like structure started to form, possibly because the progression of the pillar elongation varies from place to place along the proximodistal axis. However, it progressively flattened along with the shrinkage of the basal meshwork (Fig. 5B, C). In 19.5 h APF, the basal surface of epithelial cells was very straight and taut (Fig. 5D). These observations imply increasing tension on the basal surface in the proximodistal direction. We further obtained interesting data related to the proximodistal tension by utilizing the photoconvertible fluorescent protein Kaede, which converts the color from green to red in response to UV irradiation (Ando et al. 2002). We irradiated epithelial cells positioned at roughly regular intervals with UV light and then, observed the tarsus by live imaging (Fig. 5E–G”, Supplemental Movie S9). Since the tarsus is a three-dimensional structure, and epithelial cells are arranged three-dimensionally, it was difficult to irradiate only one target cell. Instead, several neighboring cells were labeled simultaneously in each of the UV-irradiated loci. In 18 h APF, pillars of the Parthenon-like structure appeared to be tilted relative to the apicobasal axis, with the basal side more distal than the apical side (Fig. 5E–E”). Interestingly, live imaging showed that the basal side then moved significantly toward the proximal direction (Fig. 5F–F”, Supplemental Movie S9). By 24 h APF, the tilting direction of the pillars was reversed, so that the basal side was more proximal than the apical side (Fig. 5G–G”). These observations also imply that there is a tension that pulls the basal part of the Parthenon-like structure proximally.
Fig. 5
Increased tension at the basal surface of epithelial cells along the proximodistal axis in Stage III. A–D Stills from the live imaging of tarsal epithelium of the sGMCA (green) and His2Av-mRFP (magenta) expressing fly. The winding basal surface in A progressively flattened in B–D. E–G” Stills from the live imaging of a Dll>Kaede fly. Foci of UV irradiation are indicated by asterisks in E. Selected photoconverted regions (dashed rectangles in E, F, G) in the dorsal and ventral epithelium are magnified in E’, E”, F’, F”, G’, G”, respectively. Initially, the basal side of epithelial cells are located distally than the apical side (E–E”), then pulled proximally (F–F”), and finally, the relative position of the apical and basal sides inverted (G–G”). See also Supplemental Movie S9. Stages are indicated at the lower left corners in A–E, F, G. Distal is to the right and dorsal to the top in all figures. Note that in E”, F”, G”, apical is to the bottom since they are ventral epithelium. Scale bars in A, 20 μm for A–D, in E, 20 μm for E, F, G, in E’, 5 μm for E’, E”, F’, F”, G’, G”
Stage IV—joint forming stageBy the end of this stage, the shaping process of the external morphology of the adult leg, such as the elongation of bristles and formation of claws and pulvilli, was almost complete (Fig. 6A, B, Supplemental Movie S1, S3). The details of the pulvilli formation have been described previously by Kimura et al. (2020). From this stage onwards, the difference between the dorsal and ventral sides of the tarsus became apparent. The thickness of the epithelial cell layer became much thinner on the ventral side than on the dorsal side (Fig. S1C). The ventral epithelial cell layer was straight, whereas the dorsal epithelial cell layer was somewhat arched (Fig. 6A–B’). Furthermore, the formation of the ball-and-socket structure of the joint was started on the dorsal side but not on the ventral side (Fig. 6B–C’). On the dorsal side, invagination of the joint region became deepened with a greater reduction of the luminal diameter at the joint region than in the inter-joint region, making a deep cleft between neighboring tarsal segments (Fig. 6A, A’, Supplemental Movie S3). After the cleft reached its deepest at around 40 h APF, the bottom of the cleft moved proximally (Fig. 6B, B’, Supplemental Movie S3, S10), and then, the ball-and-socket structure formation of the joint proceeded during the early Stage V (Fig. 6C’, D’, Supplemental Movie S3, S10). This process has previously been described in detail by Tajiri et al. (2010). The arched dorsal epithelial cell layer seemed to result from the deep invagination at the joint region. In Stage IV, the overall diameter of each segment was slightly reduced but not so much as in Stage III (Fig. S1B).
Fig. 6
Shape changes in the tarsal epithelial cell layer in Stages IV and V. A, B, C, D Stills from the live imaging of the distal part of the tarsus in the sGMCA (green) and His2Av-mRFP (magenta) expressing fly. A, B are in Stage IV, and C, D are in Stage V. Dashed rectangles in A, B, C, D are magnified in A’, B’, C’, D’, respectively. By the end of Stage IV (A–B’), the external shape formation, such as elongation of bristles, claws, and pulvilli are almost complete. The bottom of the invaginated joint moved proximally, and then, the ball-and-socket structure formation progressed in Stage V. The morphological difference between the dorsal and ventral epithelium became apparent (double arrows and open double arrows in B’, C’, D’). In Stage V (C–D’), the epithelial layer decreased its thickness without hardly changing the outline of segments. See also Supplemental Movie S10. Dorsal is to the top and distal to the right in all figures. Scale bars in A, 50 μm for A, B, C, D, in A’, 20 μm for A’, B’, C’, D’
Stage V—epithelial thinning stageEven after the completion of the external shape by the end of Stage IV, changes in the epithelial cell layer continued inside. The epithelial cell layer decreased its thickness without hardly changing the outline of segments. During this process, the basal surface of the epithelial cell layer was getting closer to the apical surface (Fig. 6C–D’, Supplemental Movie S10).
The behavior of macrophage-like cellsAs shown above, we observed that macrophage-like cells were getting into the lumen of the expanding tarsus from the proximal end in Stage II (see Fig. S2, Supplemental Movie S2) and resided in the cavity of the Parthenon-like structure, where they were actively moving around, in Stage III (see Fig. 3 and Supplemental Movie S3). Fascinatingly, by obtaining Z stack images every 22 s, we succeeded in capturing the moment when a macrophage-like cell in the Parthenon-like structure phagocytoses an epithelial cell (Fig. 7A–E, Supplemental Movie S11). A macrophage-like cell (arrow in Fig. 7A–E) in the cavity of the Parthenon-like structure extended filopodia apically and phagocytosed an epithelial cell whose cell body containing the nucleus was extruded basally (arrowheads in Fig. 7A–E). To confirm that cells phagocytosed by macrophage-like cells were apoptotic cells, we observed the caspase activity in epithelial cells by expressing Apoliner under the control of Dll-GAL4 (Dll>Apoliner). Apoliner is a caspase activity reporter, in which mRFP with a transmembrane domain is connected to EGFP with nuclear localization signal (NLS-EGFP) by a linker containing the target site cleaved by caspases. Without caspase activity, both mRFP and EGFP are colocalized on the cell membrane, while NLS-EGFP is released from the membrane-attached mRFP and gets into the nucleus in response to caspase activity (Bardet et al. 2008). Since we used Dll-GAL4 to drive Apoliner expression, it was expressed only in epithelial cells but not in macrophage-like cells. However, we could see a macrophage-like cell as a cluster of relatively large dots of mRFP signals (Fig. 7H–N) probably due to the accumulation of mRFP derived from engulfed epithelial cells, as mentioned in the original report (Bardet et al. 2008). This helped us to find macrophage-like cells in Dll>Apoliner flies. Through live imaging, we observed that one epithelial cell, which initially located its cell body at the apical side without the nuclear EGFP signal, began to show the EGFP signal in its nucleus (Fig. 7F, G), and then, its cell body migrated in a basal direction (Fig. 7H), finally reaching a macrophage-like cell detected as a cluster of mRFP signals (Fig. 7H, see also Supplemental Movie S12). Macrophage-like cells with multiple EGFP signals were often observed (Fig. 7I, I’). These signals appeared to reflect EGFP signals in nuclei of engulfed epithelial cells. In addition, we also successively observed a macrophage-like cell passing through the basal surface of the Parthenon-like structure (Fig. 7J–N, Supplemental Movie S13). Taken together, it appears that macrophage-like cells move in and out of the cavities of the Parthenon-like structure, and when entering the cavity, they phagocytose epithelial cells initiating apoptosis.
Fig. 7
Behavior of macrophage-like cells in Stage III. A–E Stills from the reconstructed movie of the live imaging of the tarsal epithelium in Stage III in the sGMCA (green) and His2Av-mRFP (magenta) expressing fly. The macrophage-like cell located in the cavity of the Parthenon-like structure (arrows) engulfs the epithelial cell being extruded from the apical layer (arrowheads). F–N Stills from the live imaging of ventral tarsal epithelium in Stage III using Dll>Apoliner flies. In cells with caspase activity, mRFP signals are retained at the plasma membrane but EGFP signals move to nuclei. Macrophage-like cells are seen as clusters of large dots of mRFP signals (arrows in H and I). F–H The epithelial cell with caspase activity OFF (arrowhead in F) eventually turns the caspase activity ON (arrowhead in G), and then moves to the basal side (arrowhead in H), where a macrophage-like cell appears (arrow in H). See also Supplemental Movie S12. I, I’ A macrophage-like cell (arrow in I) appearing to have engulfed epithelial cells with caspase activity ON (open arrowheads in I, I’). I’ EGFP channel extracted from I. J–N A macrophage-like cell located in the cavity of the Parthenon-like structure (arrows) popes out to the lumen through a presumptive hole of the basal meshwork (see also Supplemental Movie S13, Fig. 4). Apical is to the top in A–E, to the bottom in F–N. Scale bars in A, 5 μm for A–E, in F, 10 μm for F–I’, in J, 10 μm for J–N
留言 (0)