
記住我


This study was conducted in accordance with the Declaration of Helsinki and approved by the Institutional Review Board of West China Hospital, Sichuan University. All participants provided written informed consent prior to their inclusion in the study. The confidentiality of personal data was maintained and only used for the purpose of this trial.
Data were prospectively collected from our center from September 2015 to March 2017. A total of 121 consecutive patients referred to the chest pain center were initially recruited for this study. Patients who were diagnosed with first-time anterior STEMI based on the STEMI clinical guidelines [16] and received primary percutaneous coronary intervention (PPCI) were included in the study. The culprit infarct-related artery was the LAD. Successful PCI was defined as a residual stenosis of less than 20% and thrombolysis in myocardial infarction (TIMI) grade 3 flow, without any serious complications.
All patients included in the study underwent CMR examination within one week after PPCI. The exclusion criteria were as follows: (1) RV infarction, as defined by an ST-segment elevation of 0.1 mV or greater in leads V3R and V4R on ECG at presentation [16] and/or any RV wall motion abnormality detected by echocardiography; (2) previous coronary artery bypass surgery or revascularization intervention; (3) any cardiomyopathy, valvular disease, or congenital heart disease; (4) severe diseases that independently affect RV function, such as old inferior wall infarction, old RV infarction, severe chronic obstructive pulmonary disease, interstitial lung disease, pulmonary embolism, and primary pulmonary hypertension; (5) contraindication to CMR (e.g., pacemaker and claustrophobia) or insufficient image quality; (6) pregnancy; (7) inability to lie in a supine position; (8) an estimated glomerular filtration rate of 30 ml/(min·1.73 m2) or less; (9) patients with significant stenosis (> 50%) affecting RV branch or right coronary artery (RCA) proximal to RV branch; and (10) consent refusal.
Basic characteristics such as age, sex, body mass index (BMI), and body surface area (BSA), as well as cardiovascular risk factors like smoking history, underlying diseases including hypertension, diabetes mellitus, hypercholesterolemia, and relevant laboratory findings (triglyceride, cholesterol, serum creatinine, cardiac troponin [cTnT] peak, B-type natriuretic peptide [BNP] peak, high-density lipoprotein cholesterol [HDL-C], low-density lipoprotein cholesterol [LDL-C], white blood cell [WBC] count, and platelet [PLT] count) were collected from the patient’s history recordings. Peri-PPCI variables including pre- and post- TIMI flow, pain to device time (time to PCI-mediated reperfusion), and whether thrombectomy was performed were also recorded. BSA was calculated using the formula: BSA (m2) = 0.0061 × height (cm) + 0.0128 × weight (kg) − 0.1529.
Magnetic resonance imagingCMR examinations were conducted using a 3.0 T MR scanner (MAGNETOM Skyra; Siemens Healthcare, Erlangen, Germany). The examinations were performed by an MRI trainee technician, who was supervised by a senior technician with at least 5 years of experience in CMR imaging. The patients were placed in a supine position, and an 18-element body phased array coil was used during the examination. A standard electrocardiographic triggering device was used for heart rate triggering and monitoring.
A balance steady-state free precession sequence was used to acquire contiguous short-axis (SAX) slices encompassing the whole LV, as well as standard two-, three-, and four-chamber long-axis (LAX) cine images during repeated breath holds. The parameters for this sequence were: repetition time (TR), 40.25 ms; echo time (TE), 1.2 ms; flip angle, 40°; field of view (FOV), 340 × 285 mm2; matrix, 208 × 139; slice thickness, 8 mm; and number of phases, 25. T2 mapping was acquired with a T2-prepared steady-state free precession sequence, with the following parameters: TR, 272.95 ms; TE, 1.06 ms; flip angle, 35°; matrix, 192 × 116, FOV: 360 × 289 mm2; and slice thickness, 8 mm. Native T1 mapping was performed using a modified look-locker inversion recovery sequence, with the following parameters: TR, 319.83 ms; TE, 1.17 ms; flip angle, 35°; matrix, 256 × 145; field of view, 360 × 307 mm2; and slice thickness, 8 mm. A 5s(3s)3s modified sampling protocol was used. Standard SAX slices at apical, middle, and basal level of the LV, as well as two-, three-, and four-chamber colored native T1 and T2 maps, were generated after motion correction of the set of images acquired at different inversion times. A dose of 0.1 mmol/kg gadolinium (gadodiamide, 469.01 mg/ml; gadopentetic acid dimeglumine salt injection, Bayer, Germany) was injected at a flow rate of 2.5–3.0 ml/s. Late gadolinium enhancement (LGE) images were then acquired 10–15 min after contrast administration using a phase-sensitive inversion recovery sequence, with the following parameters: TR, 824 ms; TE, 3.5 ms; flip angle, 40°; matrix, 256 × 127, FOV, 400 × 275 mm; and slice thickness, 8 mm.
Image post-processingImage post-processing and analysis were performed by two radiologists who were blinded to the clinical data, using commercially available software (Cvi42; Circle Cardiovascular Imaging, Inc., Calgary, Canada). In case of any discrepancy or disagreement between the two radiologists, a third senior radiologist with over 10 years of experience was consulted. Global cardiac function indexes, including LV/RV end-diastolic volume (EDV) and end-systolic volume (ESV), as well as ejection fraction (EF), were analyzed in the SAX view following the standardized protocol of Society of Cardiovascular Magnetic Resonance post-processing guideline [17]. LV/RV stroke volume (SV) was calculated as LV/RV EDV-LV/RV ESV. The LV/RV EDV index (EDVI), ESV index (ESVI) and SV index (SVI) was calculated as LV/RV EDV, ESV and SV/BSA. RV dysfunction was defined as RV ejection fraction (RVEF) of less than 45% [18].
Subsequently, the infarction area was defined on the LGE SAX images as an area with a signal intensity greater than 5 standard deviations (SD) above the average intensity of the region of interest (ROI) drawn at the remote normal myocardium [19]. Microvascular obstruction (MVO) area was determined by visually recognizing the core area inside the infarcted myocardium without enhancement on the baseline LGE images. The overall size and volume of IVS were outlined and analyzed separately, with an extra ROI placed to calculate the infarction size at the IVS region (Fig. 1). The native T1 and T2 of the IVS were measured. End-diastolic wall thickness (EDWT) and end-systolic wall thickness (ESWT) were calculated by referring to the 16-AHA segmentation method. Systolic wall thickening was calculated by using the formula: (ESWT − EDWT)/EDWT × 100%.
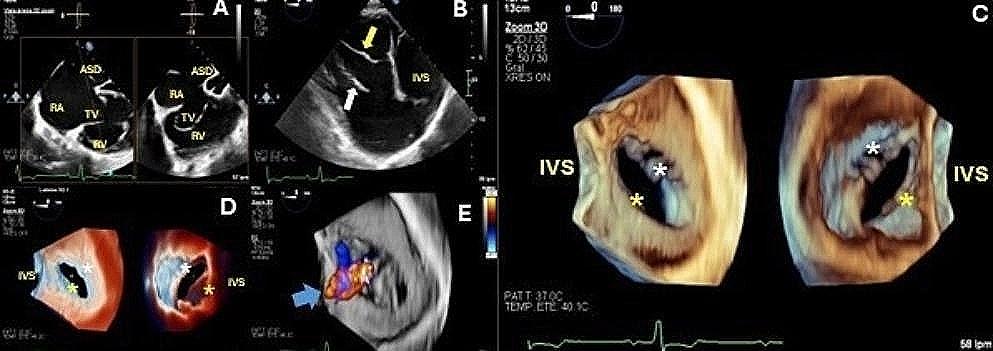
Fig. 1
Post-processing of the CMR images. A The high signal intensity in the left ventricular anterior wall and the IVS on LGE imaging indicates infarction area, while the low signal intensity (white arrows) inside the infarction area indicates MVO. B Exhibited the infarction area and MVO using red and blue color. The infarct extent is calculated as the area of red and blue as a percentage of the total myocardial mass. C The area (white arrows) between the anterior (blue point) and posterior (red point) right ventricle insertion points indicates IVS. The infarction area as demonstrated by the red and blue color inside IVS was recorded as the infarction size in IVS (CMR cardiovascular magnetic resonance, LGE late gadolinium enhancement, MVO microvascular obstruction, IVS interventricular septum)
Myocardial strain analysis was performed in a semi-automated manner using the Cvi42 5.12.1 software (Tissue Tracking, Circle Cardiovascular Imaging Inc., CVI42® 5.12.1 software, Calgary, Alberta). A stack of SAX images between the LV apex and the mitral valve plane, as well as two- and four-chamber LAX cine images were used for the analysis. Endocardial and epicardial borders were manually contoured, and both the anterior and posterior RV insertion points were manually determined at the end-diastolic phase. In addition, 2D global longitudinal strain (GLS) was acquired from the two LAX slices, while 2D global circumferential strain (GCS) and 2D global radial strain (GRS) were acquired from the SAX slices. The strain analysis was performed by the software in a semi-automated manner.
Statistical analysisThe patients were divided into two groups, RV dysfunction and non-RV dysfunction, to compare the CMR data. Continuous measures were compared using either a two-sided non-paired Student’s t-test or Mann–Whitney U-test as appropriate. Categorical measures were compared using a chi-square test. Pearson’s linear regression analyses were used to determine the relationships between RVEF and LV CMR variables. The linear regression coefficients (beta), correlation coefficients, and P-values were reported. Optimal cut-off values for predicting RV dysfunction with CMR indexes were determined by receiver operating characteristic (ROC) curve analysis, where sensitivity and specificity intersected. Univariate logistic regression analysis was used to test the associations between LV CMR variables and RV dysfunction. Stepwise multiple logistic regression analysis was performed to identify clinical and imaging variables associated with RV dysfunction. The optimal threshold was determined by Youden index (Youden index = sensitivity + specificity − 1) [20]. Variables with a P-value of less than 0.05 on bivariable analysis were considered candidate variables in the multivariate logistic regression model. In all analyses, a P-value of less than 0.05 was considered statistically significant, and all the analyses were performed using the R project V 3.3.1 (R Project for Statistical Computing, Vienna, Austria).
留言 (0)