
記住我


This was a retrospective cohort study of 5,003 patients treated with PCI at the Department of Cardiology, Herlev and Gentofte Hospital, Copenhagen University, Denmark from January 2003 through November 2008. We hereby identified 580 ACS patients defined as one of the following: ST-segment elevation myocardial infarction (STEMI), non-ST-segment elevation myocardial infarction (NSTEMI), or unstable angina pectoris (UAP).
All patients underwent a detailed echocardiography examination performed at a median of 2 days (IQR: 1–3 days) post-PCI procedure. For patients with NSTEMI or UAP, the median time the index event to PCI was 1 day (IQR: 0–2 days). In total 115 patients were excluded due to non-sinus rhythm, missing images inadequate image quality for acquisition of conventional echocardiographic measurements. In addition, patients in whom the cardiac time intervals were not measurable were excluded (n: 73) and so were patients with a history of HF (n: 22). Finally, 386 patients were left for final analysis. The study population has previously been described in detail. [15, 16] In compliance with Danish regulations, retrospective studies such as this one do not require approval from an ethics committee.
EchocardiographyEchocardiography was performed using GE Vivid ultrasound systems (GE Healthcare, Little Chalfont, UK) by experienced clinicians and sonographers. The images were stored and analyzed offline by one experienced investigator blinded to clinical baseline data and endpoints. Analysis was done using EchoPac version 113 (GE Healthcare, Horten, Norway).
Conventional 2D echocardiographyChamber quantifications were performed according to guidelines [17]. Interventricular septal width at end-diastole (IVSd), left ventricular posterior wall width at end-diastole (LVPWd), left ventricular internal diameter at end-diastole (LVIDd), were all measured from the parasternal long axis view at the tip of the mitral leaflet. LV mass index (LVMI) was calculated by LV mass divided by body surface area.
From the mitral valve inflow patterns using pulsed-wave Doppler imaging at the tip of the mitral valve leaflets of the 4-chamber view early filling (E), late filling (A), as well as the E/A-ratio and the deceleration time (DT) of the E-wave was assessed. Pulsed-wave tissue Doppler imaging from the lateral and septal annulus was used to measure peak longitudinal early diastolic tissue velocity (e’). The E-wave velocity was indexed to e´ to obtain E/e’.
LVEF was measured by the Simpsons biplane method. Left atrial volume (LAV) was measured by the biplane area-length method.
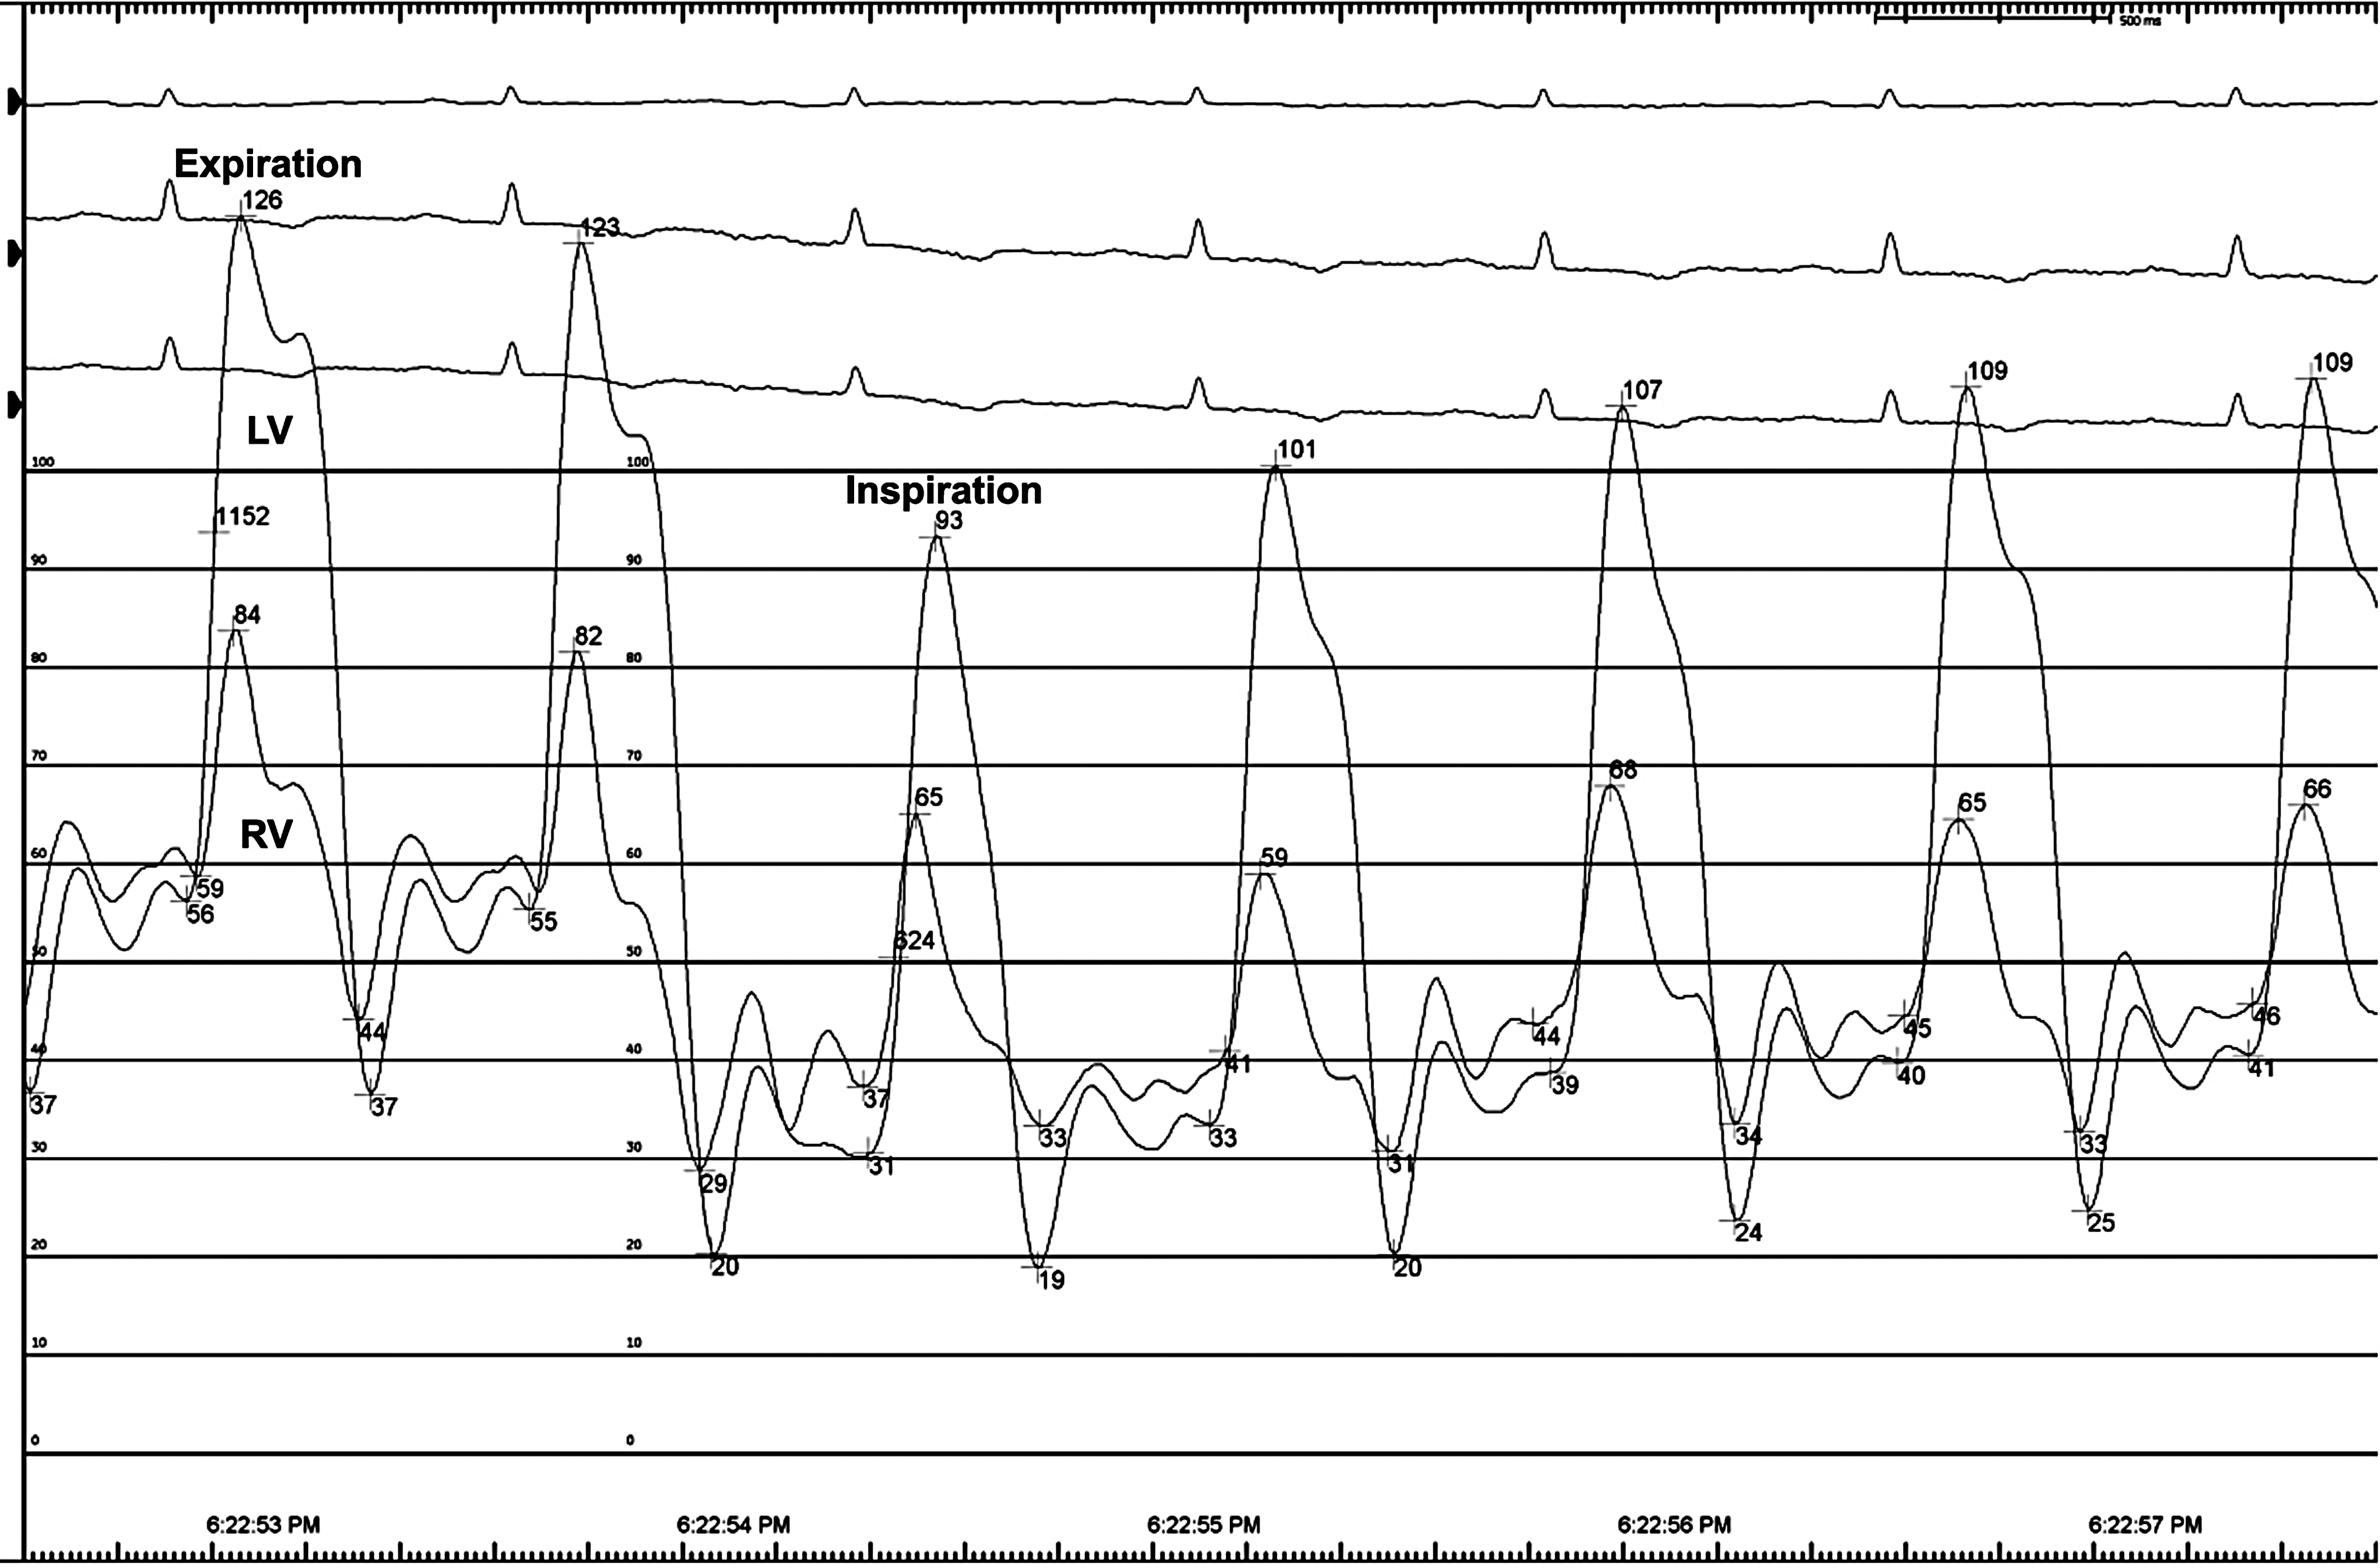
Cardiac time intervalsValvular event timing was measured by color tissue Doppler imaging M-mode by placing a 1–2 cm curved M-mode line through the anterior mitral valve leaflet in the apical 4-chamber view to obtain a color-coded spectrum of the valve motion throughout the cardiac cycle (Fig. 1). This color-coded spectrum provides direct estimates of mitral valve closure (MVC) and opening (MVO), which is defined as the development of aliasing phenomena as the valve motion exceeds the Nyquist limit. Consequently, MVC is defined as the color shift turquoise-red-blue and MVO is defined as the shift in color from red to yellow. Aortic valve opening (AVO) and closure is not measured directly, but indirectly as the traction on the mitral valve leaflet from left ventricular motion that occurs with aortic valve opening and closure. Consequently, AVO is defined as the color shift from blue to red, and AVC as the color shift from red to blue.
Fig. 1
Cardiac time interval measurement. The cardiac time intervals assessed by color tissue Doppler imaging (TDI) M-mode through the mitral leaflet. Abbreviations AVO; aortic valve opening, AVC; aortic valve closing, MVC; mitral valve closing, MVO; mitral valve opening
The cardiac time intervals were calculated from these valvular event timings. The isovolumic contraction time (IVCT) was defined as the time from MVC to AVO. The ET was defined as the time from the AVO to AVC. The isovolumic relaxation time (IVRT) was defined as the time from AVC to MVO. The MPI was calculated as the sum of the two isovolumic periods divided by ET ([IVRT + IVCT]/ET). The method has previously been described and validated [11, 14, 18].
OutcomeThe endpoint was incident HF hospitalization. The endpoint was obtained from the Danish National Board of Health’s National Patient Registry using the International Classification of Diseases-10 diagnostic codes (ICD-10). We defined incident HF as ICD-10 code I50.
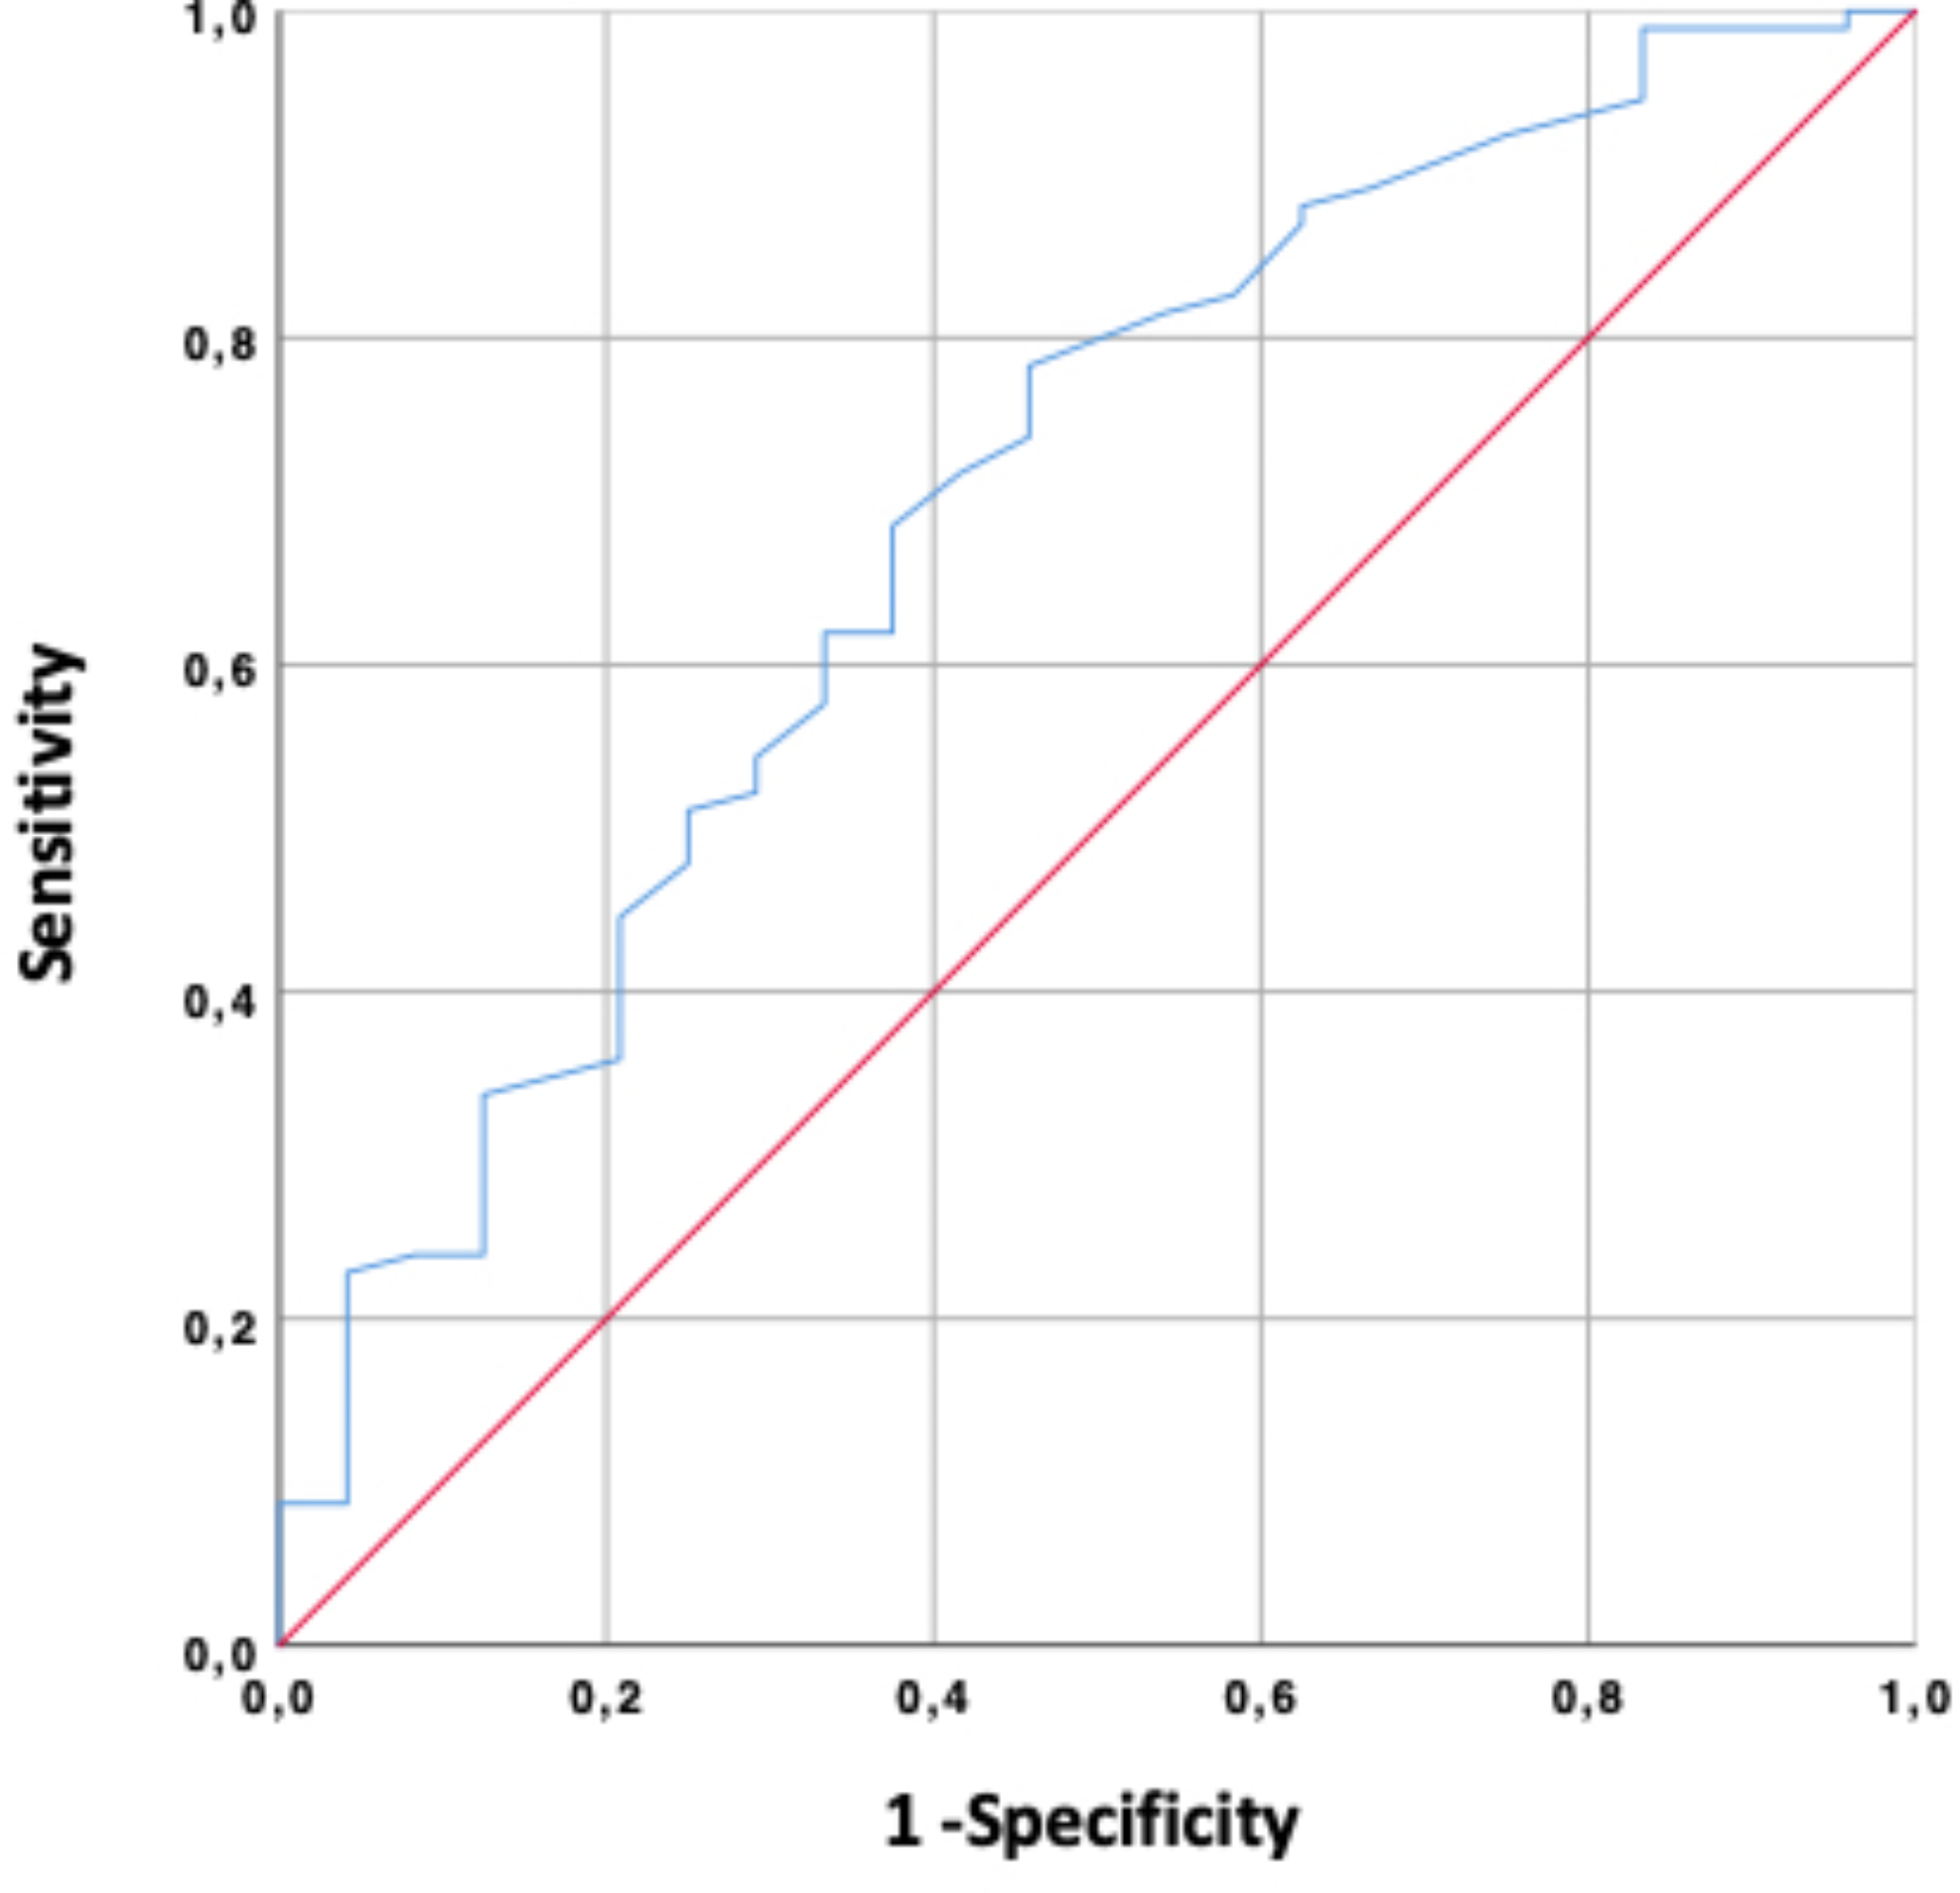
StatisticsGaussians distribution of continuous variables were assessed by histograms with those showing normal distribution presented as mean ± standard deviation and compared with the Student’s T-test, whereas non-Gaussians-distributed variables were expressed as median values with interquartile ranges (IQR) and compared with the Mann-Whitney U test. Categorical variables are presented as frequencies and compared with the Chi2-test. Patients were compared according to HF outcome status, according to whether patients were included vs. excluded in the study, and by comparing patients with high vs. low values of ET (cut-off 253 ms). Cut-off values for high vs. low values of IVRT, IVCT, ET, and MPI were chosen based on area under the curve (AUC) from receiver operating characteristics curves. These AUCs were compared to AUCs obtained from conventional measures of diastolic function (E/A, e’, E/e’). Increment in AUC for the cardiac time intervals compared to standard diastolic measures (E/e’ and e’) were made with DeLong’s method.
Time-to-first-event analyses were performed by Cox proportional hazards regression. Proportional hazards were evaluated by Schoenfeld residuals. Linearity was tested through restricted cubic spline curves (see below). We evaluated whether LVEF modified the association between cardiac time intervals and outcome with a test for interaction. Since LVEF modified the association between ET and HF, we determined the optimal LVEF cut-off for effect-modification by testing for interaction per 1% increment in LVEF with simultaneous assessment of AIC. Optimal LVEF cut-off was determined to 36%. Accordingly, the association between ET and HF was also investigated in patients stratified according to this cut-off.
Multivariable adjustments were made in sequential steps as follows:
Model 1 was adjusted for age, gender, body mass index, systolic blood pressure, diastolic blood pressure, diabetes, current smoker, hypercholesteremia, heart rate, and family history of CVD. Model 2 was adjusted for the same variables as model 1 and by diagnosis (STEMI vs. UAP/NSTEMI), multivessel disease, and LAD culprit lesion.
Restricted cubic spline curves based on Poisson regression were constructed to depict the continuous association between the cardiac time intervals and HF. The number of knots were chosen based on the association which yielded the lowest Akaike Information Criterion (AIC).
Kaplan-Meier curves were constructed and depicted by high vs. low values of cardiac time intervals based on median values.
All statistical analyses were performed with STATA Statistics/Data analysis, SE 15.1 (StataCorp, Texas, USA). A p-value < 0.05 was considered significant in all tests.
留言 (0)