
記住我
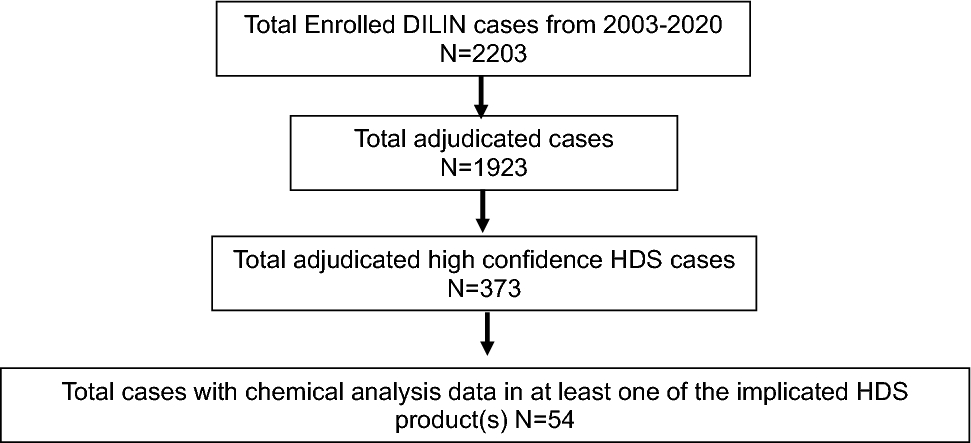


We included in this review 177 studies (see the study flow diagram in Fig. 1) that provided data on the safety, effectiveness, and/or immunogenicity of COVID-19 vaccines in pregnant persons and their infants, published until October 2023 (56% in 2022). The studies included a total of 638,791 vaccinated pregnant persons from 41 countries who were exposed to mRNA (154 studies), viral vector (51), and inactivated virus vaccines (17). Only ten studies (6%) were from LMICs and 23 studies (13%) were from upper-middle-income countries, the rest were from HICs. Among the included studies, 42% reported pregnancy outcomes, 35% maternal AEFI, 37% infant safety outcomes, 16% VE, and 39% immunogenicity results.
Fig. 1
For this analysis, we included 137 studies reporting safety or effectiveness outcomes (immunogenicity outcomes will be reported elsewhere). Most were conducted in the USA (43 [31%]), Israel (25 [18%]), Brazil (7 [5%]), and seven (5%) were multi-country. These studies used one or more study designs: cohort studies (95 [69%]), cross-sectional (12 [9%]), case-control (10 [7%]), case series (10 [7%]), case report (9 [7 %]), and controlled clinical trial (1 [1%]). The only included RCT reported only AEFIs. It is noteworthy that 21 of the studies reported data from surveillance systems (15%). Out of 137 publications, 33 reported adjusted measures and were included in the meta-analysis.
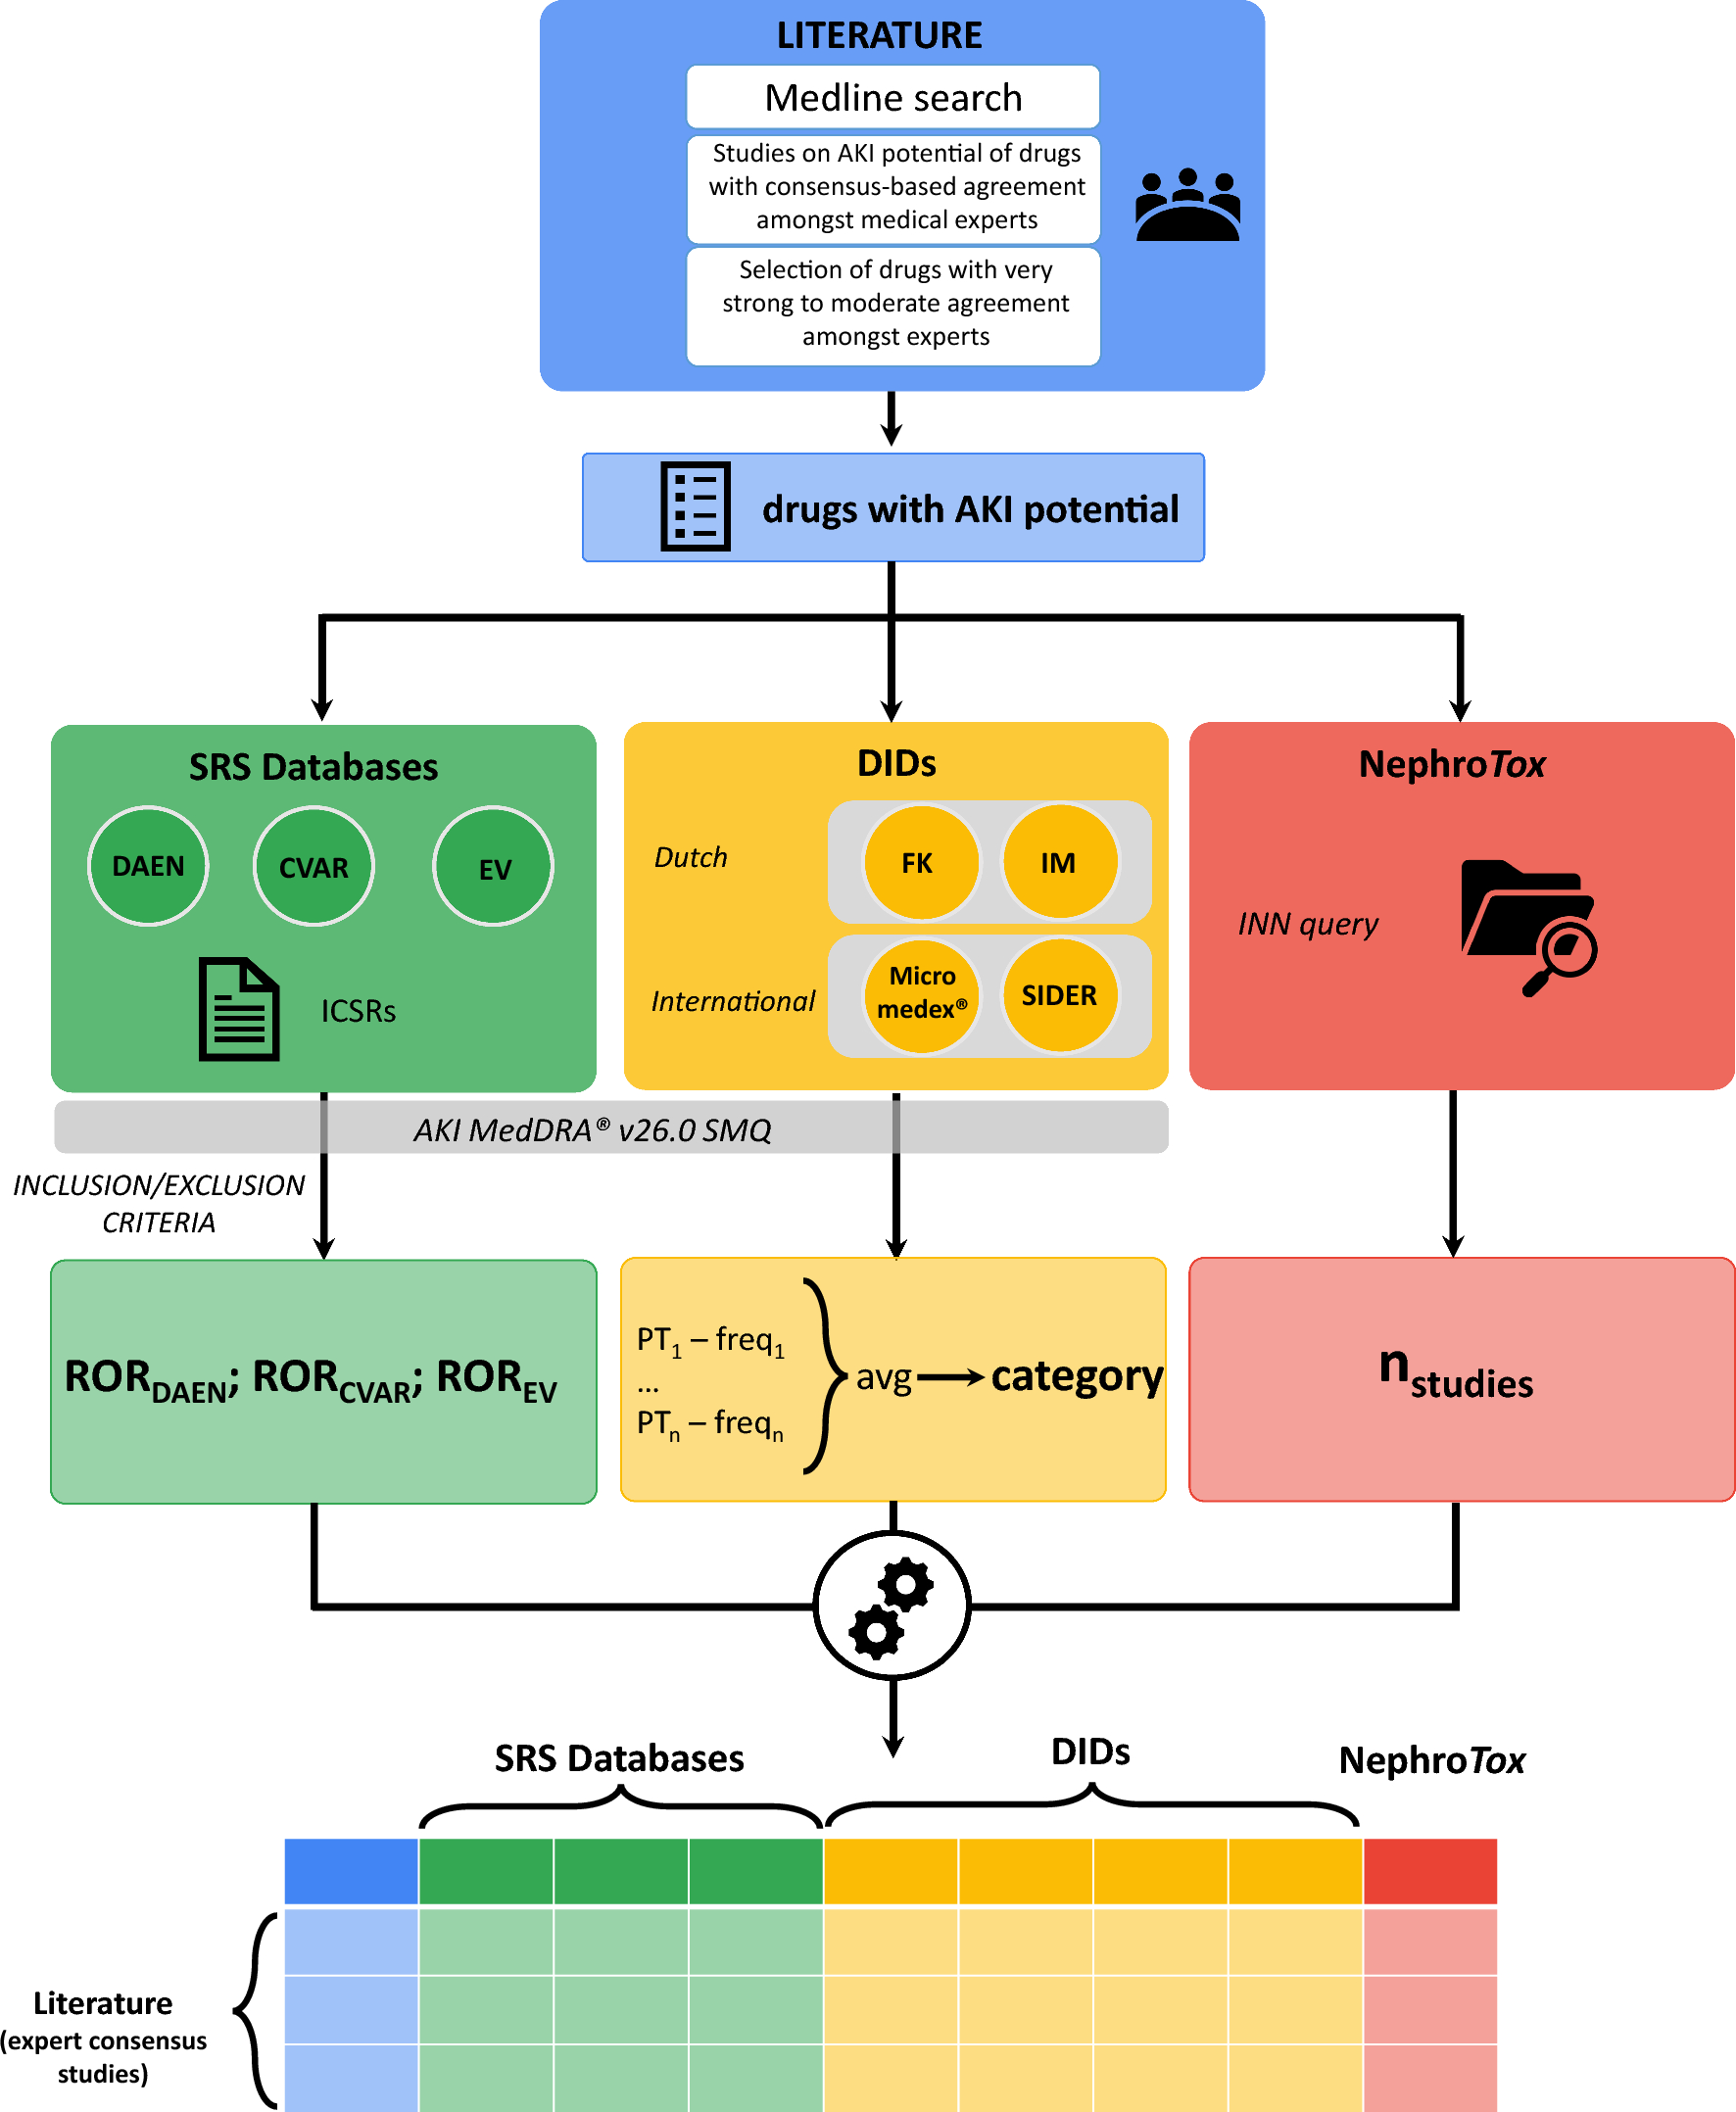
Among the ten COVID-19 vaccine products identified, the most frequently assessed were the BNT162b2 (Pfizer/BioNTech) mRNA vaccine in 108 studies (79%), the mRNA-1273 (Moderna) vaccine in 71 studies (52%), and the Janssen/Johnson & Johnson (Ad26,COV2,S) in 24 studies (18%) (Table S1 of the ESM). All descriptive information is available online in real time at https://www.safeinpregnancy.org/living-systematic-review/ (last updated January 2024). It can be filtered by publication date, country/region, study design, population, and vaccine type and product from the sidebar, the map, or the figures. A snapshot of 10/30/2023 is presented in the evidence map in Fig. 2.
Fig. 2 3.1 Risk of Bias of Included Studies
The comprehensive quality assessment according to each study design revealed a substantial proportion of studies meeting the criteria for good or fair quality. Among the cross-sectional and cohort studies, 93% (99/107) were rated as good or fair quality, while 70% (7/10) of case-series studies reached the same categories. All the case-control studies were deemed to be of good or fair quality (10/10) and the only controlled clinical trial included met the criteria for fair quality. The risk of bias for the included studies by study design is presented in Tables S2, S3, S4, and S5, of the ESM.
3.2 Effects of COVID-19 Vaccines During PregnancyWe present the “Summary of Findings” tables with the most important outcomes by subgroup meta-analyses/estimates. Maternal pregnancy-related safety outcomes and infant safety outcomes are presented by trimester and by vaccines, and efficacy by vaccine type and SARS-CoV-2 variant dominance. All remaining results, organized by outcome groups, are also presented in our LSR platform at https://www.safeinpregnancy.org/summary-tables/.
The results of each comparative (see https://www.safeinpregnancy.org/meta-analysis/) and non-comparative (see https://www.safeinpregnancy.org/proportional-meta-analyses/) meta-analysis are shown on the online and interactive LSR platform through forest plot/meta-analyses and summary tables organized by outcome.
3.2.1 Maternal Pregnancy-Related Safety OutcomesThe pooled absolute and relative effects of adjusted comparative studies on maternal pregnancy-related safety outcomes and their certainty of evidence are presented in Table 1 and the pooled proportions of outcomes and background rates, including the supporting references, are in Table S6 of the ESM.
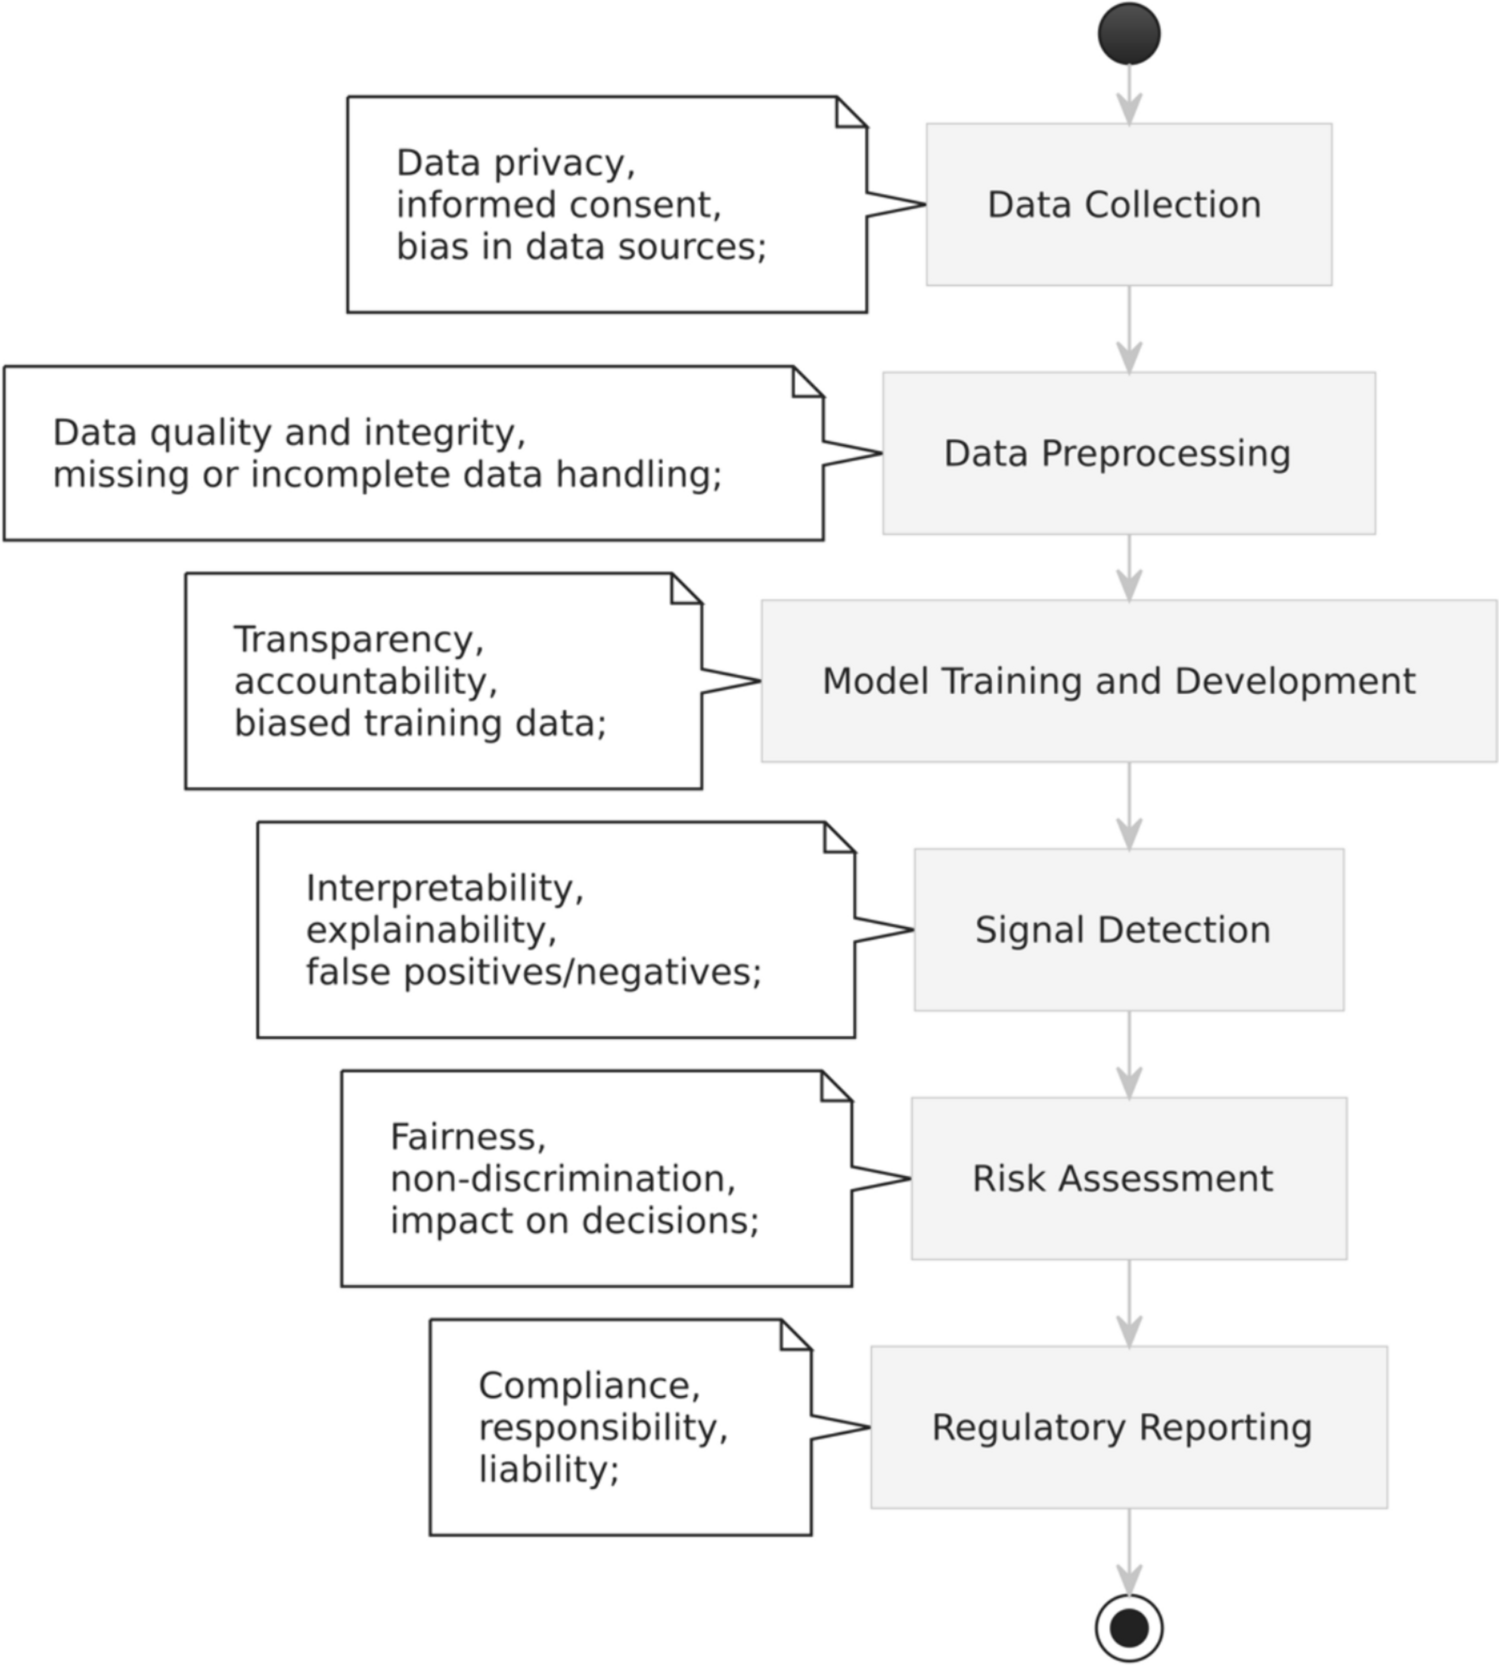
Table 1 Maternal pregnancy-related outcomes associated with COVID-19 vaccination compared to no vaccination during pregnancy, by trimester of exposure and vaccine type. Population: pregnant persons; setting: any; intervention: COVID-19 vaccination; comparison: no vaccinationFor this particular set of outcomes, the level of evidence ranged from low to very low certainty. Evidence suggests a lower risk of stillbirth among those who received at least one dose of the COVID-19 mRNA vaccine compared with those who did not when the exposure was in the first or second trimester (1,2T) or in the third trimester (3T) [RR 0.17; 95% CI 0.07–0.43 and RR 0.25; 95% CI 0.08–0.80, respectively], but there was no statistically significant difference between arms when the exposure was in the 2T (RR 1.12; 95% CI 0.52–2.40) and at any trimester. Pooled estimation of three studies [36,37,38] of vaccination at any trimester with mRNA/viral vector showed a RR of 0.49 (95% CI 0.20–1.19; I2 87%) (Fig. 3). We found similar findings when we analyzed this outcome by vaccine platform (Fig. S1 of the ESM).
Fig. 3
Adjusted risk of stillbirth associated with COVID-19 vaccination during pregnancy versus unvaccinated pregnant population, by trimester of exposure. A Alpha, CI confidence interval, D Delta, DV dominant variant, G good, GQ global quality, NS not specified, O Omicron, VT vaccine type, VV viral vector
Three observational studies reported adjusted effect measures for miscarriage/abortion [39,40,41]. Pooled studies of two of them [39, 41] did not show a higher risk of miscarriage/abortion among vaccinated pregnant women with mRNA in 1T or 1/2T (OR 0.91; 95% CI 0.70–1.20; I2 77%) with at least one dose during pregnancy (Fig. S2 of the ESM). The third study assessing viral vector vaccines found similar results (RR 0.84 95% CI 0.48–1.47) [not shown in the plot because it uses a different effect measure] [40]. Only one study reported adjusted effect measures for a gestational diabetes outcome [42] and did not show a higher risk after vaccination at 2T and 3T (RR 1.21; 95% CI 0.93–1.58 and RR 0.99; 95% CI 0.77–1.27, respectively) between vaccinated pregnant people with the mRNA vaccine and unvaccinated groups.
The pooled estimation of three studies reporting adjusted effect measures [42,43,44] did not show a higher risk of hypertensive disorders of pregnancy between vaccinated pregnant women with the mRNA vaccine administered in 2,3T and unvaccinated pregnant women (RR 1.07; 95% CI 0.81–1.40; p = 0.49; I2 0%) [Fig. S3 of the ESM]. Six studies reported adjusted effect measures for emergency cesarean delivery [37, 42,43,44,45,46]. The single study meeting the trimester filter showed a lower incidence of this outcome in the vaccinated group at 2,3T with the mRNA vaccine (RR 0.97; 95% CI 0.94–1.00).
A postpartum hemorrhage-adjusted outcome was reported by six studies [36, 42, 43, 45,46,47]. Pooled estimates of five of them ([36, 37, 42, 43, 46] showed a trend toward a higher incidence of postpartum hemorrhage in those receiving mRNA vaccines during 2,3T (regardless of the completeness of the scheme) versus unvaccinated pregnant persons (RR 1.44; 95% CI 0.85–2.45; I2 89%). The subgroup analysis by vaccination schedule (partial, completed, and booster) showed different incidences of this outcome (RR 1.09; 95% CI 0.56–2.12 [45]; RR 0.95; 95% CI 0.86–1.05 [36, 37, 43, 46] and RR 3.88; 95% CI 2.41–6.25 [46], respectively) (Figs. S4 and S5 of the ESM).
The background rates of maternal pregnancy-related safety outcomes were within the CIs of the proportional meta-analysis estimations, which means that proportions were not unexpected in vaccinated individuals. The subgroup analysis by trimester of exposure and vaccine type showed similar results to each other or presented a significant imprecision.
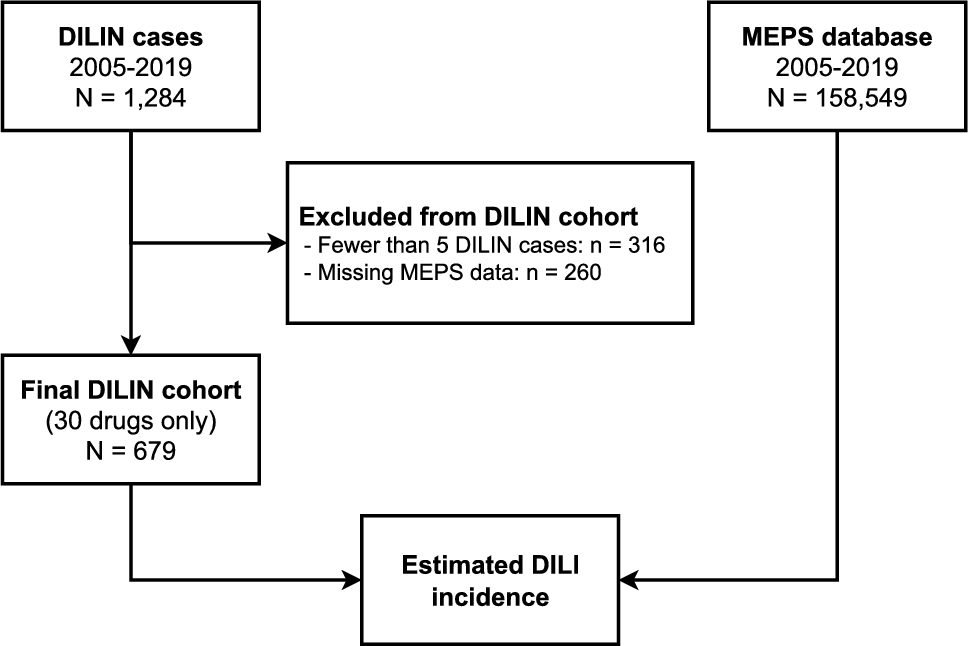
As an example, we illustrated the pooled proportions of stillbirth by trimester in Fig. 4 and by vaccine type in Fig. S6 of the ESM. The rest of the outcomes are shown in https://www.safeinpregnancy.org/proportional-meta-analyses/.
Fig. 4
Pooled proportion of stillbirth in vaccinated pregnant population per 1000 patients by trimester of exposure. CI confidence interval
3.2.2 Maternal AEFIsThe pooled proportions of AEFIs among vaccinated pregnant persons are presented by vaccine platform in Table S7 of the ESM. The pooled anaphylaxis proportion by vaccine type was 2 per 100,000 vaccinated persons (95% CI 0–92) with mRNA vaccines, and no events were reported with viral vector vaccines [48]. For serious adverse events, proportions were 0.25% (95% CI 0.13–0.41) and 0.41% (95% CI 0.10–2.24), and for lymphadenopathy, 4.41% (95% CI2.48–6.83) and 6.36 % (95% CI 4.70–8.24) with mRNA and viral vector vaccines respectively. The pooled proportion of myocarditis was 0.00% (95% CI 0.00–1.19) and the proportion of seizures was 0.05% (95% CI 0.00–0.26), both with mRNA vaccines. The pooled proportion of fever was 6.88% (95% CI 4.15–10.21) with mRNA vaccines and 30.96% (95% CI 7.47–26.15) with viral vector vaccines. The observed pooled proportion of headache was 19.83% (95% CI 14.20–26.14) with mRNA vaccines, 12.40% (95% CI 0.00–44.20) with viral vector vaccines, and 10.05% (95% CI 4.03–18.00) with inactivated virus vaccines. Fatigue proportions were 40.91% (95% CI 33.16–48.89) with mRNA, 27.76% (95% CI 0.00–94.00) with viral vector vaccines, and 11.46% (95% CI 2.02–25.42) with inactivated virus vaccines, respectively. The rest of the analyzed AEFI outcomes (chills, diarrhea, injection-site reactions, joint pain, myalgia, rash, and vomiting) are shown in Table S7 of the ESM, and in our interactive LSR online platform (https://www.safeinpregnancy.org/proportional-meta-analyses/=).
The pooled proportions by vaccine schedule (partial, complete, and booster) were generally similar with few exceptions. The proportion of headache, fatigue, fever, and lymphadenopathy was more than double with the second dose compared withthe first dose (shown in https://www.safeinpregnancy.org/proportional-meta-analyses/)
Only two cohort studies reported comparative effect measures for AEFIs between pregnant and non-pregnant persons [49, 50]. Kachikis et al. [49] observed that in comparison to non-pregnant non-lactating persons (N = 4726), pregnant persons (N = 2009) experienced more local reactions to a COVID-19 booster or third dose (adjusted OR 1.2; 95% CI 1.0–1.4 but fewer systemic reactions (adjusted OR 0.7; 95% CI 0.6–0.8). The majority of pregnant individuals (97.6%) reported no obstetric concerns following vaccination.
Shapiro et al. [50] reported that pregnant persons (N = 1650 first dose and 1014 second dose) experienced side effects less frequently than non-pregnant persons (N = 6600 first dose and 4052 second dose). Pregnancy was a weak predictor for reporting any side effect in general and in particular fatigue, myalgia, headache, chills, and fever. Estimation of each study and meta-analyses of both studies are reported in Table S8 of the ESM.
3.2.3 Infant Safety Outcomes Following COVID-19 Vaccination During PregnancyThe pooled absolute and relative effects of adjusted comparative studies on infant safety outcomes following COVID-19 vaccination during pregnancy and their certainty of evidence are presented in Table 2. Pooled proportions and background rates, including the supporting references, are shown in Table S9 of the ESM. For this particular set of outcomes, the level of evidence ranged from low to very low certainty.
Table 2 Infant safety outcomes associated with COVID-19 vaccination during pregnancy compared to no vaccination in pregnancy, by trimester of exposure and vaccine typeThree studies reported adjusted effect measures for any congenital malformations [36, 45, 51]. Regardless of the trimester of exposure, the studies did not show an increased risk of congenital malformations in the vaccinated group (RR 0.69 for 1T, 0.80 for 2,3T, and 0.72 for 1,2,3T). Pooled studies by vaccine type (RR 0.71; 95% CI 0.47–1.06 and RR 0.89; 95% CI 0.56–0.93 for mRNA and viral vector, respectively). Analysis by vaccine schedule showed similar results (Figs. S7, S8, and S9 of the ESM).
Five pooled studies [36,37,38, 42, 46] that recorded the incidence of an Apgar score ≤5 minutes revealed no statistically significant difference between vaccinated during 2T-3T or any T and unvaccinated groups (RR 0.74; 95% CI 0.33–1.88 and RR 0.90; 95% CI 0.77–1.04, respectively); pooled results were homogenous (I2 29% and 50%, respectively). Subgroup analyses by vaccine type or vaccine schedule do not show any differences (Figs. S10 and S11 of the ESM).
Nine studies reported adjusted effect measures for prematurity (gestational age at delivery < 37 weeks) [36,37,38, 42, 44, 46, 51, 52]. Pooled estimations did not show a higher incidence of preterm infants in vaccinated persons exposed at any trimester (RR 0.89; 95% CI 0.73–1.07). There were some differences by trimester but never reached statistical significance. When we analyzed pooled studies by vaccine schedule and type of vaccine (mRNA and viral vector), there was no increased risk of prematurity either (Figs. S12 and S13 of the ESM).
Ten studies reported adjusted effect measures for small for gestational age [36, 37, 42,43,44,45,46, 51, 52]. Pooled estimations did not show a higher incidence of small for gestational age cases in vaccinated persons exposed at any trimester (RR 0.98; 95% CI 0.94–1.01). There were some differences by trimester but these never reached statistical significance. When we analyzed pooled studies by vaccine status and type of vaccine (mRNA and viral vector), there was no increased risk for preterm infants (Figs. S14 and S15 of the ESM).
Six studies reported adjusted effect measures for NICU hospitalization [36,37,38, 44, 45, 51]. Pooled estimations did not show a higher incidence of NICU hospitalizations and even showed a lower incidence among vaccinated pregnant persons at 3T and 2,3T (RR 0.92; 95% CI 0.87–0.97 and RR 0.92; 95% CI 0.87–0.97, respectively) [Fig. S16 of the ESM]. A subgroup analysis by vaccine platform and vaccine status did not show any relevant difference between groups.
Only one study reported adjusted effect measures for respiratory distress in the newborn (not due to COVID-19) [43] and one reported for infant death [51] among pregnant persons receiving mRNA vaccination at any trimester. There was no increased risk (RR 0.84; 95% CI 0.42–1.68).
The background rates of infant safety outcomes were within the CIs of the proportional meta-analysis performed (see Table S9 of the ESM). Data were analyzed by trimester of exposure and vaccine type. The pooled proportions showed no important differences by vaccine type, except for low birth weight, which presented half the proportion with viral vector vaccines than with mRNA vaccines (2.25%; 95% CI 1.25–3.50 vs 5.56%; 95% CI 4.23–7.06, respectively) [Fig. S17 of the ESM; see https://www.safeinpregnancy.org/proportional-meta-analyses/ for the rest of the outcomes].
3.2.4 Effectiveness OutcomesThe absolute and relative effects of adjusted comparative studies and their certainty of evidence by vaccine type and SARS-CoV-2 variant dominance are presented in Table 3. Seven studies reported adjusted effect measures of vaccination compared with no vaccination on the VE on severe or hospitalized COVID-19 [53,54,
留言 (0)