
記住我


We included data from 49 high TB, TB/HIV and MDR/RRTB burden countries that were reported to the WHO from 2012–2021 (Kazakhstan and Uzbekistan did not have data for 2021). The 49 countries included 24 from the WHO African region, nine from the European region, seven from South-East Asia region, two from the Region of the Americas, five from Western Pacific region and two from the Eastern Mediterranean region. The observed probability of TB treatment success aggregated across all countries indicated a general increase from 2012 to 2021. A similar general decrease was seen for treatment failure and loss -to -follow up. Observed proportions of deaths fluctuated over time (Table 1).
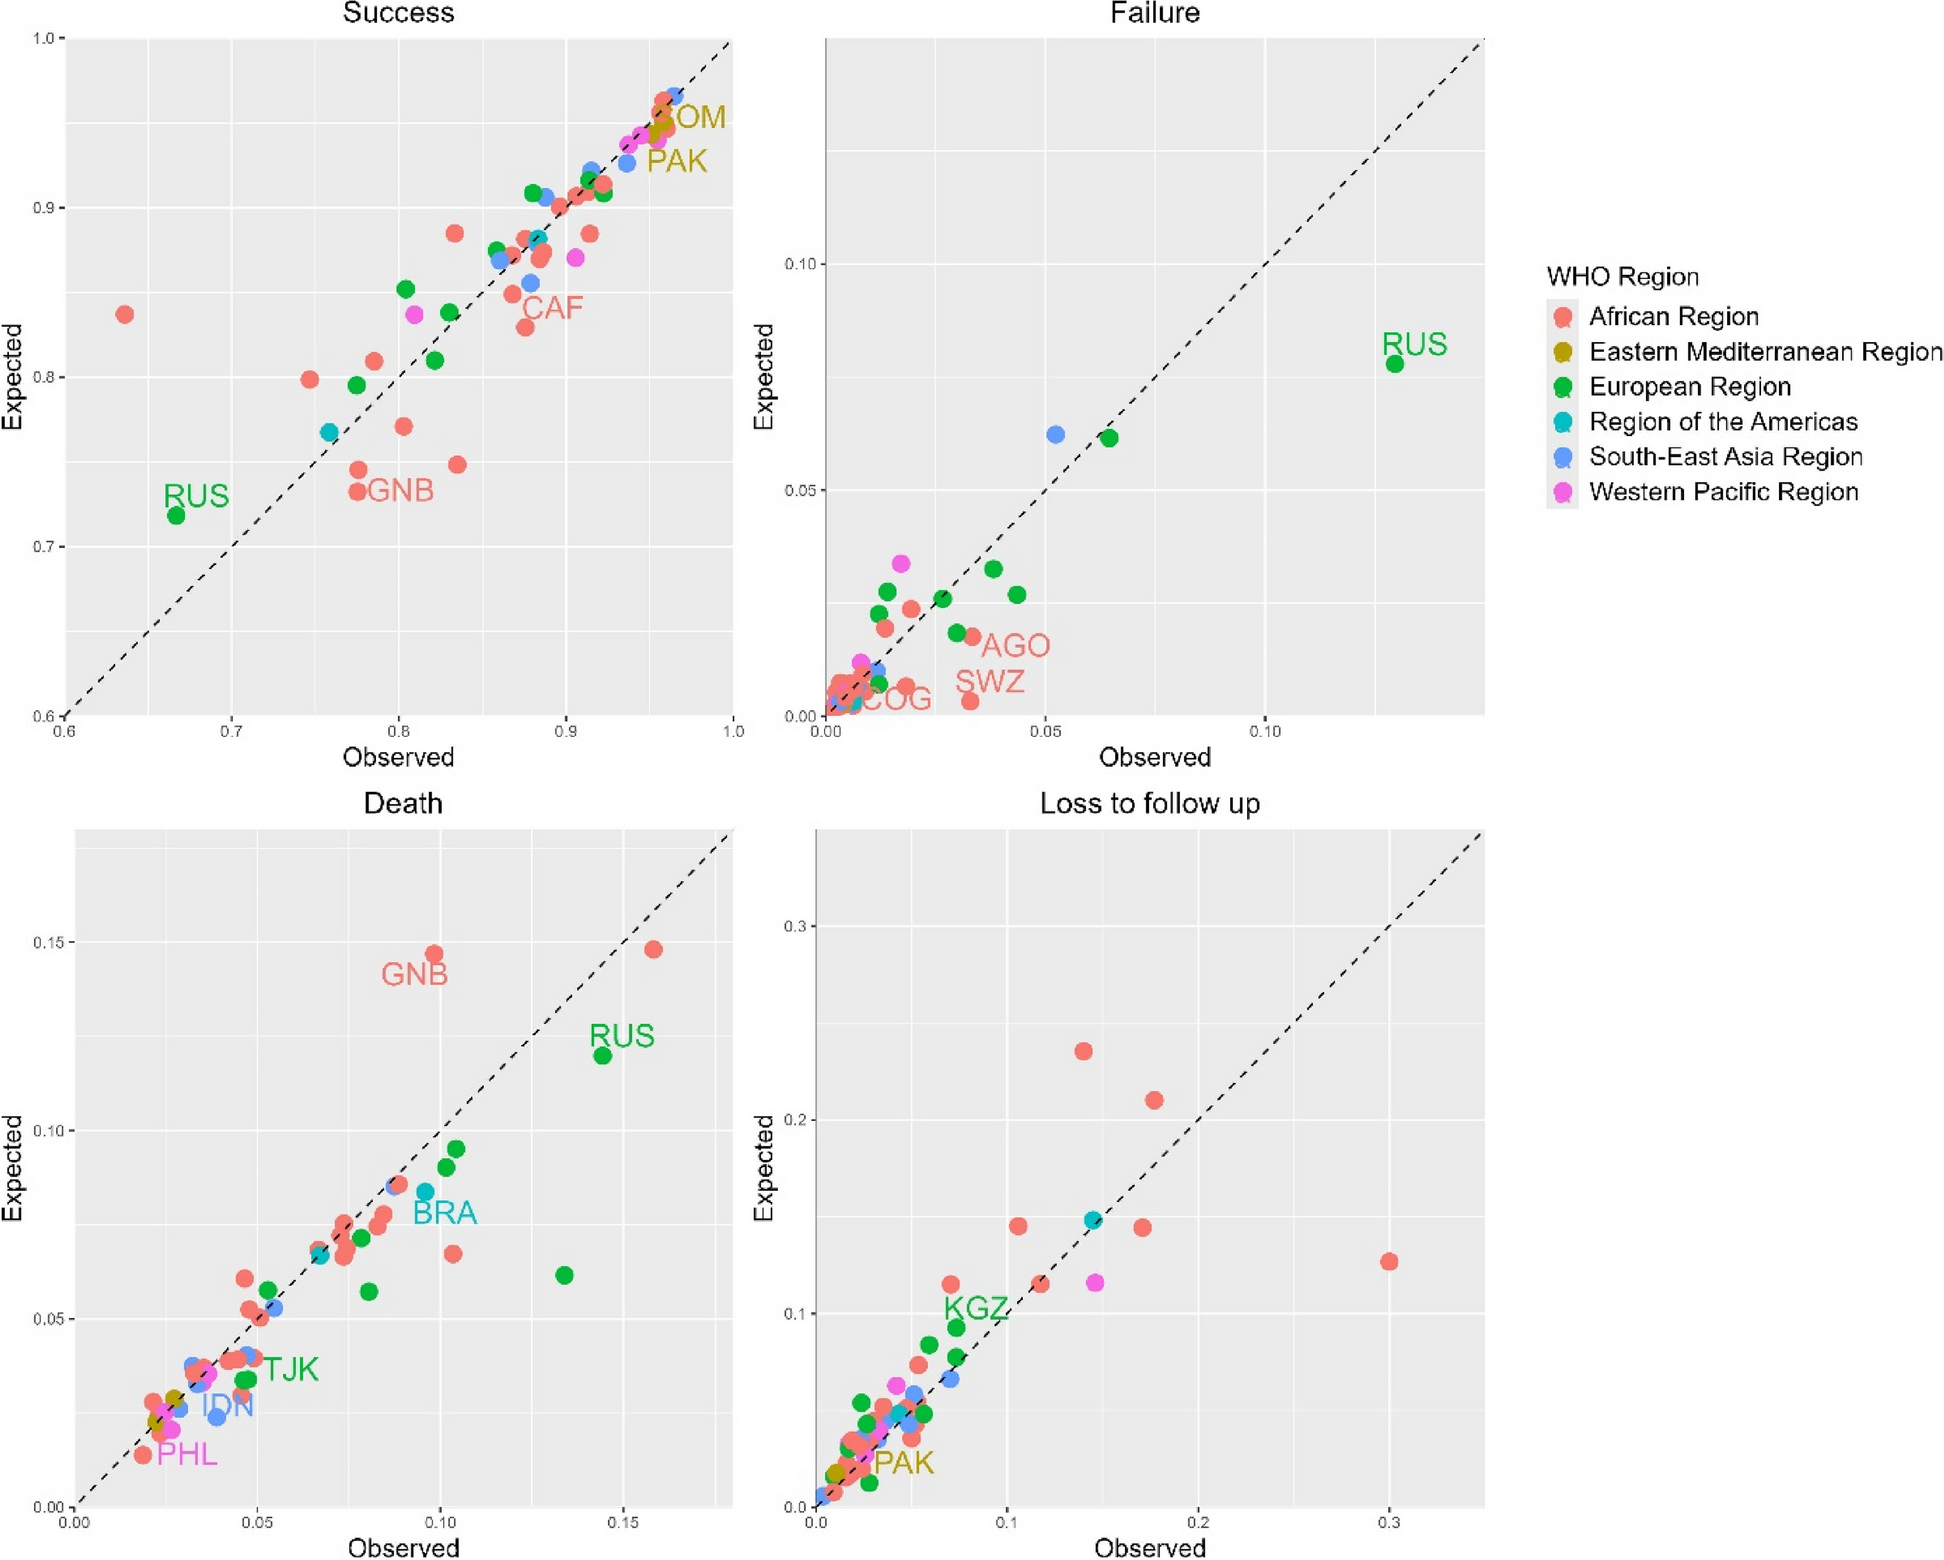
Table 1 Probabilities of TB treatment outcomes by year (2012–2021) aggregated across 49 high TB, TB/HIV and MDR/RR-TB burden countries, as a weighted average of country-specific outcomesComparing the observed and estimated TB treatment success from the MLR models in 2020 (Fig. 1), the Central African Republic (1.06, 95% CI: 1.01–1.39, p = 0.0259), Guinea-Bissau (1.06, 95% CI: 1.01–1.22, p = 0.0339), Pakistan (1.01, 95% CI: 1.00–1.06, p = 0.0218), the Russian Federation (0.93, 95% CI: 0.87–0.98, p = 0.0338) and Somalia (1.01, 95% CI: 1.00–1.05, p = 0.0143) had statistically significant ratios, i.e. there were more observed successes than expected in all countries except in the Russian Federation where there were fewer. For 2021 (Additional file 1: Fig. S1), Bangladesh (1.01, 95% CI: 1.00–1.02, p = 0.0468), the Central African Republic (1.06, 95% CI: 1.00–1.71, p = 0.0434), Pakistan (1.02, 95% CI: 1.01–1.11, p = 0.0116), the Philippines (0.98, 95% CI: 0.96–0.99, p = 0.0339) and Zimbabwe (1.03, 95% CI: 1.00–1.35, p = 0.0240) had statistically significant ratios, i.e. there were more observed successes than expected in all other countries except in the Philippines where there were fewer.
Fig. 1
Observed and expected tuberculosis treatment outcome probabilities for 49 high TB, TB/HIV and MDR/RR-TB burden countries in 2020. Labelled are those with statistically significant differences: AGO – Angola, BRA – Brazil, CAF – Central African Republic, COG – Congo, GNB – Guinea-Bissau, IDN – Indonesia, KGZ – Kyrgyzstan, PAK – Pakistan, PHL – Philippines, SOM – Somalia, SWZ- Eswatini, TJK—Tajikistan and RUS – the Russian Federation
Comparing observed and estimated TB treatment failure in 2020, statistically significant ratios were observed in Angola (1.90, 95% CI: 1.06–7.19, p = 0.0450), Congo (2.59, 95% CI: 1.26–55.18, p = 0.0232), Eswatini (10.03, 95% CI: 3.62–40.54, p = 0.0052) and the Russian Federation (1.66, 95% CI: 1.15–2.37, p = 0.0229), i.e. there were more observed failures than expected in these countries. For 2021, Congo (5.54, 95% CI: 1.91–651.18, p = 0.0137), Nigeria (16.68, 95% CI: 6.43–24.13, p = 0.0015), the Russian Federation (1.70, 95% CI: 1.05–3.01, p = 0.0352) and Viet Nam (2.03, 95% CI: 1.21–32.49, p = 0.0249) had statistically significant ratios in treatment failure, i.e. there were more observed failures than expected in these countries.
Comparing observed and expected TB deaths in 2020, statistically significant ratios were observed in Brazil (1.15, 95% CI: 1.08–1.30, p = 0.0180), Guinea-Bissau (0.67, 95% CI: 0.45–0.96, p = 0.0458), Indonesia (1.63, 95% CI: 1.36–2.44, p = 0.0022), Philippines (1.29, 95% CI: 1.08–1.66, p = 0.0337), the Russian Federation (1.20, 95% CI: 1.07–1.29, p = 0.0140) and Tajikistan (1.40, 95%CI: 1.04-1.77, p = 0.0159), i.e. there were more observed deaths than expected in these countries except in Guinea Bissau where there were fewer. For 2021, Brazil (1.26, 95% CI: 1.13–1.51, p = 0.0153), Eswatini (2.30, 95% CI: 1.05–6.18, p = 0.0467), Guinea-Bissau (0.39, 95% CI: 0.24–0.71, p = 0.0208), Indonesia (1.70, 95% CI: 1.25–3.14, p = 0.0064), Mozambique (1.71, 95% CI: 1.04-2.30, p = 0.0422), Nigeria (0.09, 95% CI: 0.03–0.13, p = 0.0017), the Russian Federation (1.24, 95% CI: 1.06–1.37, p = 0.0188) and Ukraine (1.27, 95% CI: 1.03–1.72, p = 0.0315) had statistically significant ratios in TB deaths. There were more observed deaths than expected in Brazil, Indonesia, Mozambique, the Russian Federation and Ukraine, and less observed deaths than expected in Guinea-Bissau and Nigeria.
Comparing observed and expected loss to follow up in 2020, statistically significant ratios were observed in Kyrgyzstan (0.79, 95% CI: 0.45–0.93, p = 0.0322) and Pakistan (0.72, 95% CI: 0.48–0.94, p = 0.0413), i.e. there were less observed losses to follow up than expected. For 2021, Belarus (5.76, 95% CI: 1.25–17.93, p = 0.0348), Pakistan (0.60, 95% CI: 0.35–0.96, p = 0.0434), the Philippines (1.45, 95% CI: 1.12–2.48, p = 0.0307) and the Russian Federation (0.52, 95% CI: 0.46-0.96, p = 0.0432) had statistically significant ratios in losses to follow up. There were more observed losses to follow up than expected in Belarus and the Philippines, and less observed losses to follow up than expected in Pakistan and the Russian Federation.
See Additional file 1: Tables S1, S2, S3, S4, S5, S6, S7, S8, S9, S10, S11, S12, S13, S14 for further details on differences between observed and expected TB treatment outcomes in 2020 and 2021.
Meta-analysesPooled effects for TB treatment success at WHO regional level showed evidence of systematic differences between observed and expected probabilities in 2020 (Fig. 2a) in the European Region (0.97, 95% CI: 0.94-0.99, p = 0.0140, \(I^\) =0%), and in 2021 (Additional file 1: Fig. S2a) in the European Region (0.94, 95% CI: 0.90-0.99, p = 0.0103, \(I^\) = 0%) and the Western Pacific Region (0.98, 95% CI: 0.97-1.00, p = 0.0153, \(I^\) = 0%). However, there was no evidence of systematic differences globally both in 2020 and 2021.
Fig. 2
Random effect meta-analyses forest plots highlighting ratios between observed and expected proportions for tuberculosis treatment success (a) and failure (b) in 2020 for 49 high TB, TB/HIV and drug resistant TB burden countries by WHO region. Greater than one ratio imply that the observed proportions were more than expected, and less than one ratio imply that the observed proportions were less than the expected
There was no evidence of systematic differences for treatment failure in any of the regions but there was evidence of systematic differences globally in both 2020 (1.14, 95% CI: 1.01-1.28, p = 0.0381, \(I^\) = 0%) (Fig. 2b) and 2021 (1.36, 95% CI: 1.03-1.78, p = 0.0277, \(I^\) = 43.7%) (Additional file 1: Fig. S2b).
There was evidence of systematic differences for TB deaths in 2020 (Fig. 3a) in the European Region (1.21, 95% CI: 1.12-1.30, p = 1.75e-06, \(I^\) = 0%) and the Region of the Americas (1.14, 95% CI: 1.05-1.25, p = 0.0036, \(I^\) = 0%), and in 2021 (Additional file 1: Fig. S3a) in the European Region (1.26, 95% CI: 1.13-1.40, p = 3.07e-05, \(I^\) = 0%) and the Region of the Americas (1.24, 95% CI: 1.08-1.43, p = 0.0027, \(I^\) = 0%). There was also evidence of systematic differences globally (1.08, 95% CI: 1.03-1.13, p = 0.0010, \(I^\) = 2.0%) in 2020.
Fig. 3
Random effect meta-analyses forest plots highlighting ratios between observed and expected proportions for tuberculosis treatment death (a) and loss to follow up (LTFU) (b) in 2020 for 49 high TB, TB/HIV and drug resistant TB burden countries by WHO region. Greater than one ratio imply that the observed proportions were more than expected, and less than one ratio imply that the observed proportions were less than the expected
Lastly, there was evidence of systematic differences for loss to follow up in 2020 (Fig. 3b) in the Eastern Mediterranean Region (0.70, 95% CI: 0.51-0.96, p = 0.0265, \(I^\) = 0%) and globally (0.91, 95% CI: 0.86-0.97, p = 0.0059, \(I^\) = 0%). There was no evidence of systematic differences in 2021 (Additional file 1: Fig. S3b).
留言 (0)