Patients and sample collection
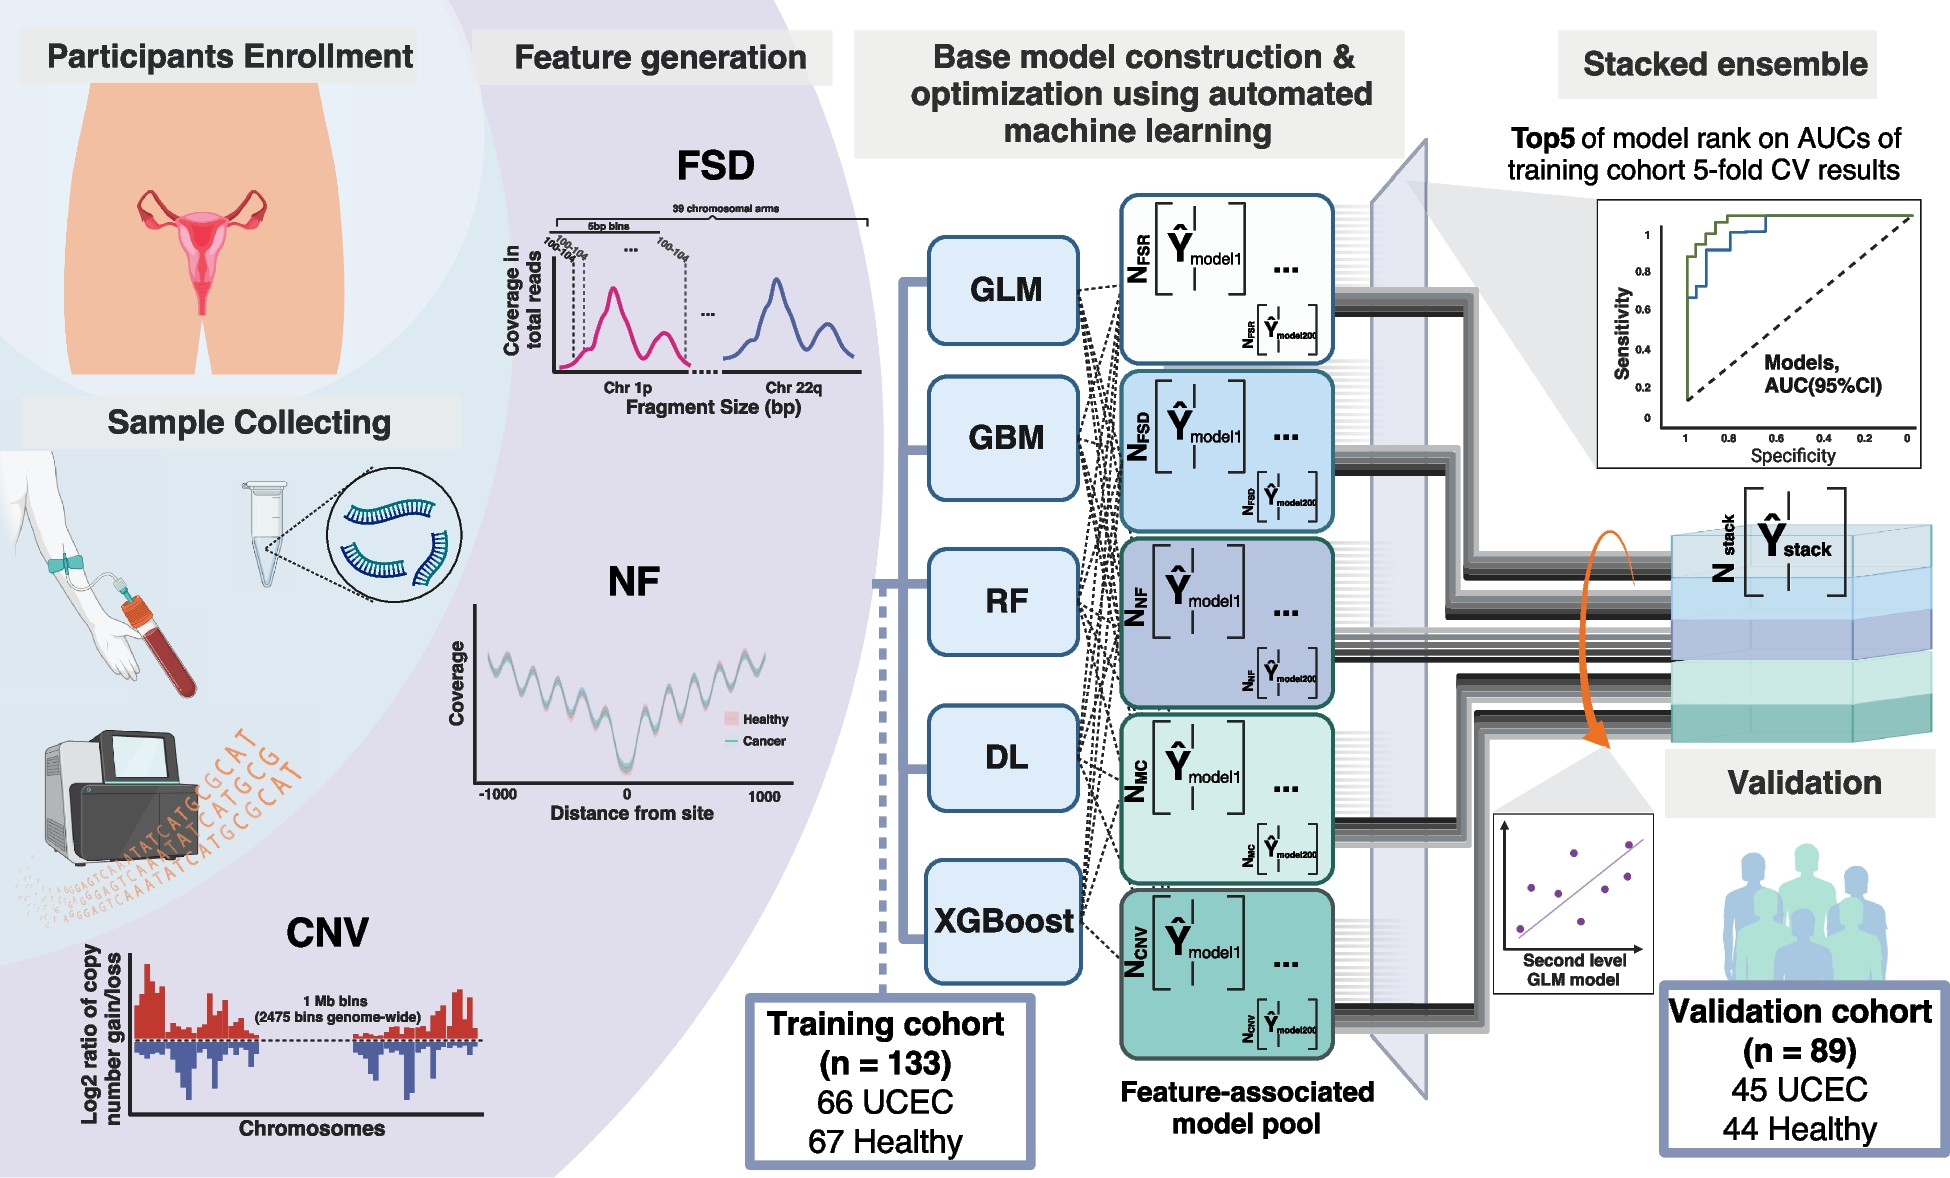
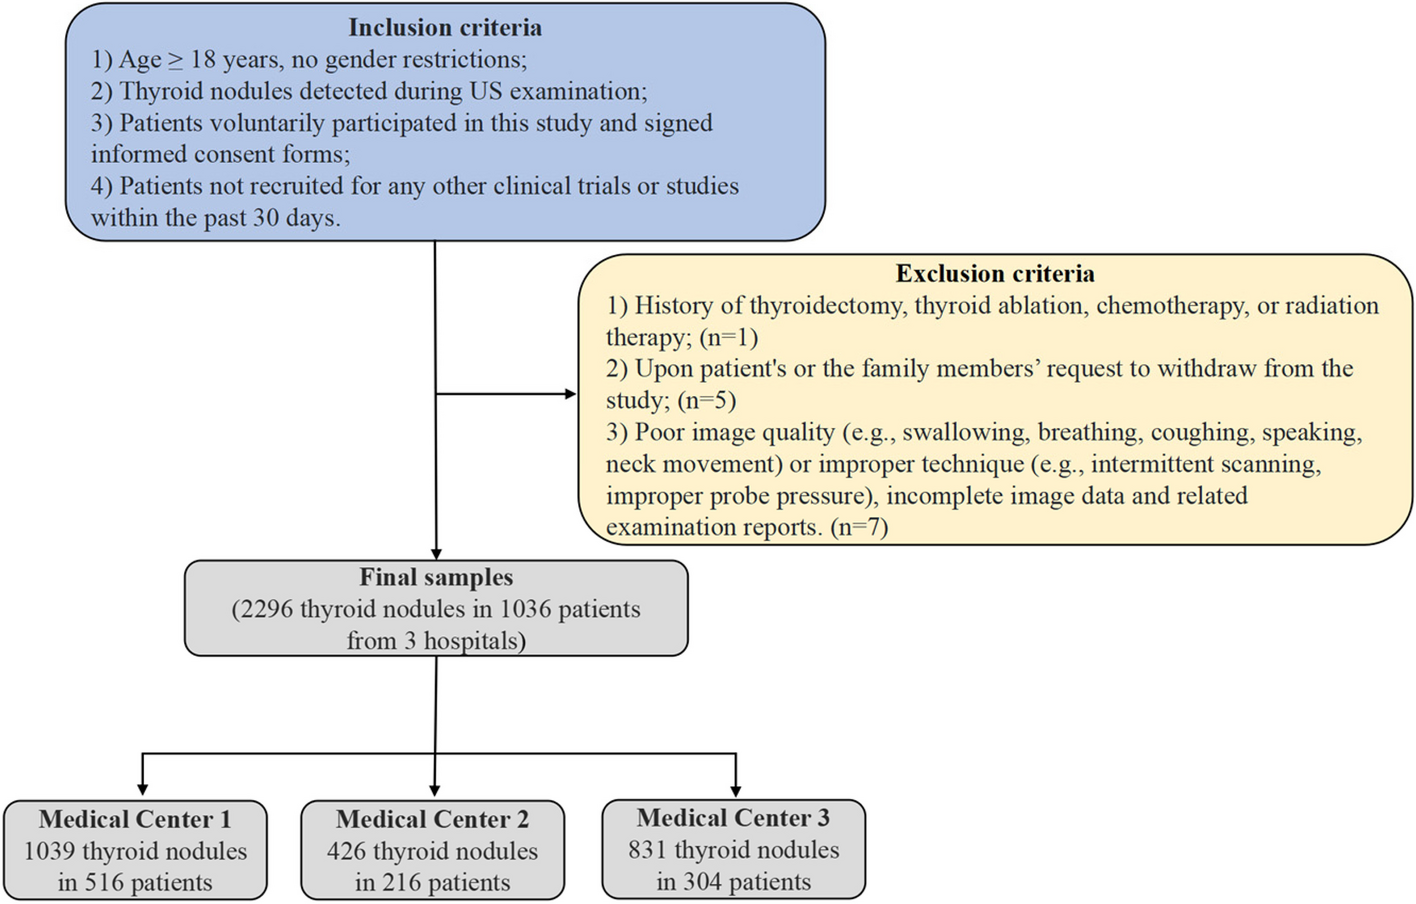
In this study, a total of 121 patients with UCEC and 119 healthy female donors were initially enrolled at the Fujian Cancer Hospital (Fujian Branch of Fudan University Shanghai Cancer Center) from August 2021 to July 2022 and from November 2022 to February 2023 (Additional file 1: Fig. S1). Participants were subsequently excluded if they were lost to follow-up, had post-treatment status, withdrew their consent, or failed to meet quality control criteria. After the exclusions, the study proceeded with 111 UCEC patients and 111 healthy donors for further analysis. A minimum collection volume of 30 ml of peripheral blood samples was collected from patients before any treatment or healthy donors and proceeded for low-depth whole-genome sequencing (WGS). One participant was excluded for failed NGS quality control. All healthy control participants underwent a thorough physical examination and were monitored for a period of one year, with routine follow-up conducted every three months to promptly identify any onset of cancer. A training cohort and an independent validation cohort were established separately based on time of enrollment. The training cohort was dedicated to train a multi-dimensional machine learning model, whereas the independent validation cohort set out to assess the performance of the model. An additional cohort of 47 patients with hysteromyoma was retrospectively collected to further validate our findings and assess the generalizability of our model across diverse patient populations. The genetic tests were performed in a centralized clinical testing center (Nanjing Geneseeq Technology Inc., China; Certified to CAP, CLIA, and ISO15189). The study was performed in accordance with the Declaration of Helsinki and approved by the Ethics Committee of Fujian Cancer Hospital. All patients provided oral and written informed consent to participation and publication.
Next-generation sequencing and data processing
Blood samples, drawn into EDTA tubes, were centrifuged at 16,000 × for 10 min within 4 h post-collection. The QIAamp Circulating Nucleic Acid Kit (Qiagen) was used to extract cfDNA from the plasma samples, without the inclusion of carrier RNA, following the manufacturer’s instructions. To ensure sufficient cfDNA for further analysis, the concentration of cfDNA in the plasma was determined using the Qubit dsDNA HS Assay Kit (Thermo Fisher Scientific) according to the manufacturer’s guidelines.
The extracted plasma cfDNA was then used for WGS with the KAPA Hyper Prep Kit (KAPA Biosystems), following the manufacturer’s instructions. Briefly, 5–10 ng of cfDNA per sample underwent a series of steps including end-repair, A-tailing, and ligation with adapters. The resulting libraries were quantified using the KAPA SYBR FAST qPCR Master Mix (KAPA Biosystems), and then loaded onto NovaSeq platforms (Illumina) for paired-end sequencing, as recommended by the manufacturer.
To ensure data quality, the sequencing output was subjected to quality control measures. Trimmomatic [18] was used for read trimming, followed by PCR duplicate removal using Picard tools (Broad Institute, MA, USA). The trimmed reads were aligned to the human reference genome (GRCh37/UCSC hg19) using the Burrows-Wheeler Aligner [19]. The median coverage depth across all samples was 8.17 × (Additional file 2). To standardize the data and mitigate the effects of variable sequencing depth, we applied a down-sampling procedure. Coverage depths that exceeded 5 × were reduced to a uniform 5 × , ensuring consistency across these samples. For samples that originally had lower coverage, no down-sampling was performed; they were analyzed at their initial sequencing depths.
Genome-wide cfDNA features
To construct a multi-facet machine learning model that differentiates UCEC and healthy individuals, fragmentomics and CNV features were extracted from the processed WGS data using an in-house script. Copy number variation (CNV), fragment size distribution (FSD), and nucleosome footprint (NF) profiling were used to construct the final model (Additional file 3).
The profiling of copy number variations was adapted from the method as described by Wan et al. [20]. Each sample’s genome was partitioned into bins of 1 Mb, resulting in a total of 2475 bins. A Hidden Markov Model was employed to compare the depth of each bin with the software baseline, generating a log2 ratio for each bin. This analysis allowed for the identification of copy number variations across the genome.
The fragment size distribution (FSD) feature quantifies the coverage of cfDNA fragments ranging from 110 to 220 bps in 5-bp stepwise (e.g., 110–114 bps, 115–119 bps, …, 215–220 bps; 24 bins) at every chromosome arm. This creates a detailed series of 24 bins across representing the distribution of cfDNA fragment size of each chromosome arm. A total of 39 chromosome arms are resolved into 936 discrete FSD features, contributing to the granularity of our analysis. The short arms of 5 acrocentric chromosomes were not included as they remained largely unsequenced to date. To ensure a focus on intrinsic, biologically relevant patterns rather than variations introduced by whole genome sequencing, we standardized the raw FSD coverage values by converting them into z-scores. This normalization contrasts each value against the overall mean within each sample. This approach enabled the enhanced detection of high-resolution chromosome-level patterns, which could potentially reveal further distinctions between the cancer and non-cancer groups.
For nucleosome footprint (NF) profiling, the framework developed by Doebley et al. [17] was utilized to analyze nucleosome occupancy in cfDNA while accounting for GC bias. We quantified the GC-corrected coverage profile using three observable characteristics: the central coverage value 30 bp away from the location, the “average coverage” value within a 1000-bp distance from the location, and the amplitude determined through fast-Fourier yransform. In this study, we analyzed a total of 854 transcription factor binding sites to optimize the ability to detect cancer from low-pass WGS data.
Model construction and cross-validation analyses
We developed a two-tiered machine learning framework to differentiate between cancerous and non-cancerous samples. The initial tier of our framework comprised a feature-specific module that processed one of three distinct feature sets: copy number variations (CNV), feature selection dimensionality (FSD), or nuclear features (NF). This module systematically applied a suite of five foundational algorithms, namely Generalized Linear Model (GLM), Gradient Boosting Machine (GBM), Distributed Random Forest (DRF), Deep Learning (DL), and XGBoost. A grid search methodology was employed to optimize the hyperparameters for each algorithm, drawing from predefined candidate values. We assessed the efficacy of these models using a fivefold cross-validation scheme, ensuring consistency in fold assignment across all feature types for both training and validation.
In the second phase of our analysis, the ensemble model of each feature type was constructed by averaging the outputs of the five leading models (determined by their cross-validation area under the curve (AUC) scores) from each category. For incoming samples, the final classification score was computed as the average prediction score from these three top-tier ensemble models, with the score ranging between 0 and 1—where a higher score indicated an increased probability of the sample being cancerous.
In the training cohort, our classifiers underwent a fivefold cross-validation, aiming for a specificity threshold of 95% to set the model’s decision boundary. An independent validation cohort was subsequently employed to assess the efficacy of our composite machine learning model.
To assess the stability and generalizability of the ensemble model, we employed a method of repeated random partitioning of the cohort. The entire dataset was randomly split into three distinct sets: a training set, a validation set, and a test set. This random partitioning was not a single event but was repeated multiple times to produce a comprehensive range of data subsets, thereby simulating a variety of potential training and testing scenarios. The training set was used to build the model, the validation set to tune the hyperparameters, and the test set to evaluate the model’s performance. This approach mitigated the risk of overfitting and provided a more robust estimation of the model’s performance in unseen data.
Tumor fraction calculation
To quantify the proportion of ctDNA within the cell-free DNA (cfDNA) and to evaluate copy number variations (CNVs) characteristic of tumor-derived DNA, we utilized the computational tool ichorCNA[20]., which is designed to work with high-throughput sequencing data. Each sample’s genome was partitioned into bins of 1 Mb, resulting in a total of 2475 bins. A Hidden Markov Model was employed to compare the depth of each bin with the software baseline, generating a log2 ratio for each bin. This analysis allowed for the identification of copy number variations across the genome. The model also integrates several data features, including total read depth, B-allele frequency, and the distribution of cfDNA fragment lengths. Through this integrated analysis, ichorCNA provides estimates of the tumor fraction, defined as the proportion of cfDNA attributable to tumor cells. The clinical limit of detection was further calculated following the approach described by Jamshidi et al. [21], defining it as the tumor fraction corresponding to a 50% probability of detecting a cancer signal.
Nucleosome footprint differentiation analysis and corresponding gene-enriched pathways
To ascertain nucleosome footprint (NF) features that exhibited unique signatures in uterine corpus endometrial carcinoma (UCEC) relative to healthy individuals, we engaged in a comparative study of NF profiles from both cohorts. Employing the multiple t-tests, we pinpointed NF features with significant variances in central coverage, average coverage, and amplitude. Features with adjusted p-value < 0.01 (Benjamini–Hochberg method) were retained for further analysis. These selected features were presumed to be reflective of UCEC-specific chromatin organization. Subsequently, we mapped the genes associated with these NF features to their respective biological pathways via the Encyclopedia of Genes and Genomes (KEGG) pathway analysis. We then rigorously evaluated the connections between these genes and their related biological functions and pathways, adopting a significance cutoff (P < 0.05) to identify pathways potentially implicated in the pathogenesis or progression of UCEC.
Pre-analytical and physiological variables analysis
To evaluate the potential effect of various pre-analytical variables and physiological variables on model robustness, a subset of true positive or true negative participants, specifically 21 healthy participants and 4 UCEC patients in the validation cohort were further analyzed. Blood samples were collected and tested multiple times to assess consistency and reproducibility, with the Positive Percent Agreement (PPA) calculated for each set of results. The impact of different transportation (24, 48, and 72 h post-collection) and storage conditions (room temperature and with an ice pack) were examined, with the reference condition defined as the state of the sample within 2 h of collection. The effect of freezing duration of plasma (3 days, 7 days, 1 month, and 6 months) on the test outcomes was also studied. Additionally, the influence of different physiological states, specifically before and after meals and exercise, was also evaluated by repeated blood collection. For each set of conditions, the PPA was calculated, and a 95% confidence interval was computed, using the stability of the PPA under different conditions to gauge the robustness and reliability of the test outcomes.
Clinical benefit analysis
To evaluate the potential clinical advantages of our model in practical settings, we employed a methodology proposed by Hubbell et al. [22], which involved integrating their interception model with the predictions generated in our current study. This approach was applied to assess the impact on colorectal cancer incidence in a Chinese cohort.
Statistical analysis
Multivariate analysis was performed with clinical variables that were statistically significant in univariate analysis. All P values were based on two-sided testing unless specified, and differences were considered significant at P < 0.05. For the calculation of 95% confidence intervals (CIs) for sensitivity and specificity, we applied Wilson’s score interval formula. To estimate the 95% CI for the AUC, we employed the bootstrap resampling technique. Specifically, 1000 bootstrap samples were generated from the validation dataset, and the AUC was recalculated for each sample to create an empirical distribution of AUC values. The 95% CI was then determined by identifying the 2.5th and 97.5th percentiles of this distribution. Positive Percent Agreement (PPA) is measured between the agreement between the results of optimal condition and test condition. Statistical analysis was performed using R software, version 4.2.3.


留言 (0)