
記住我


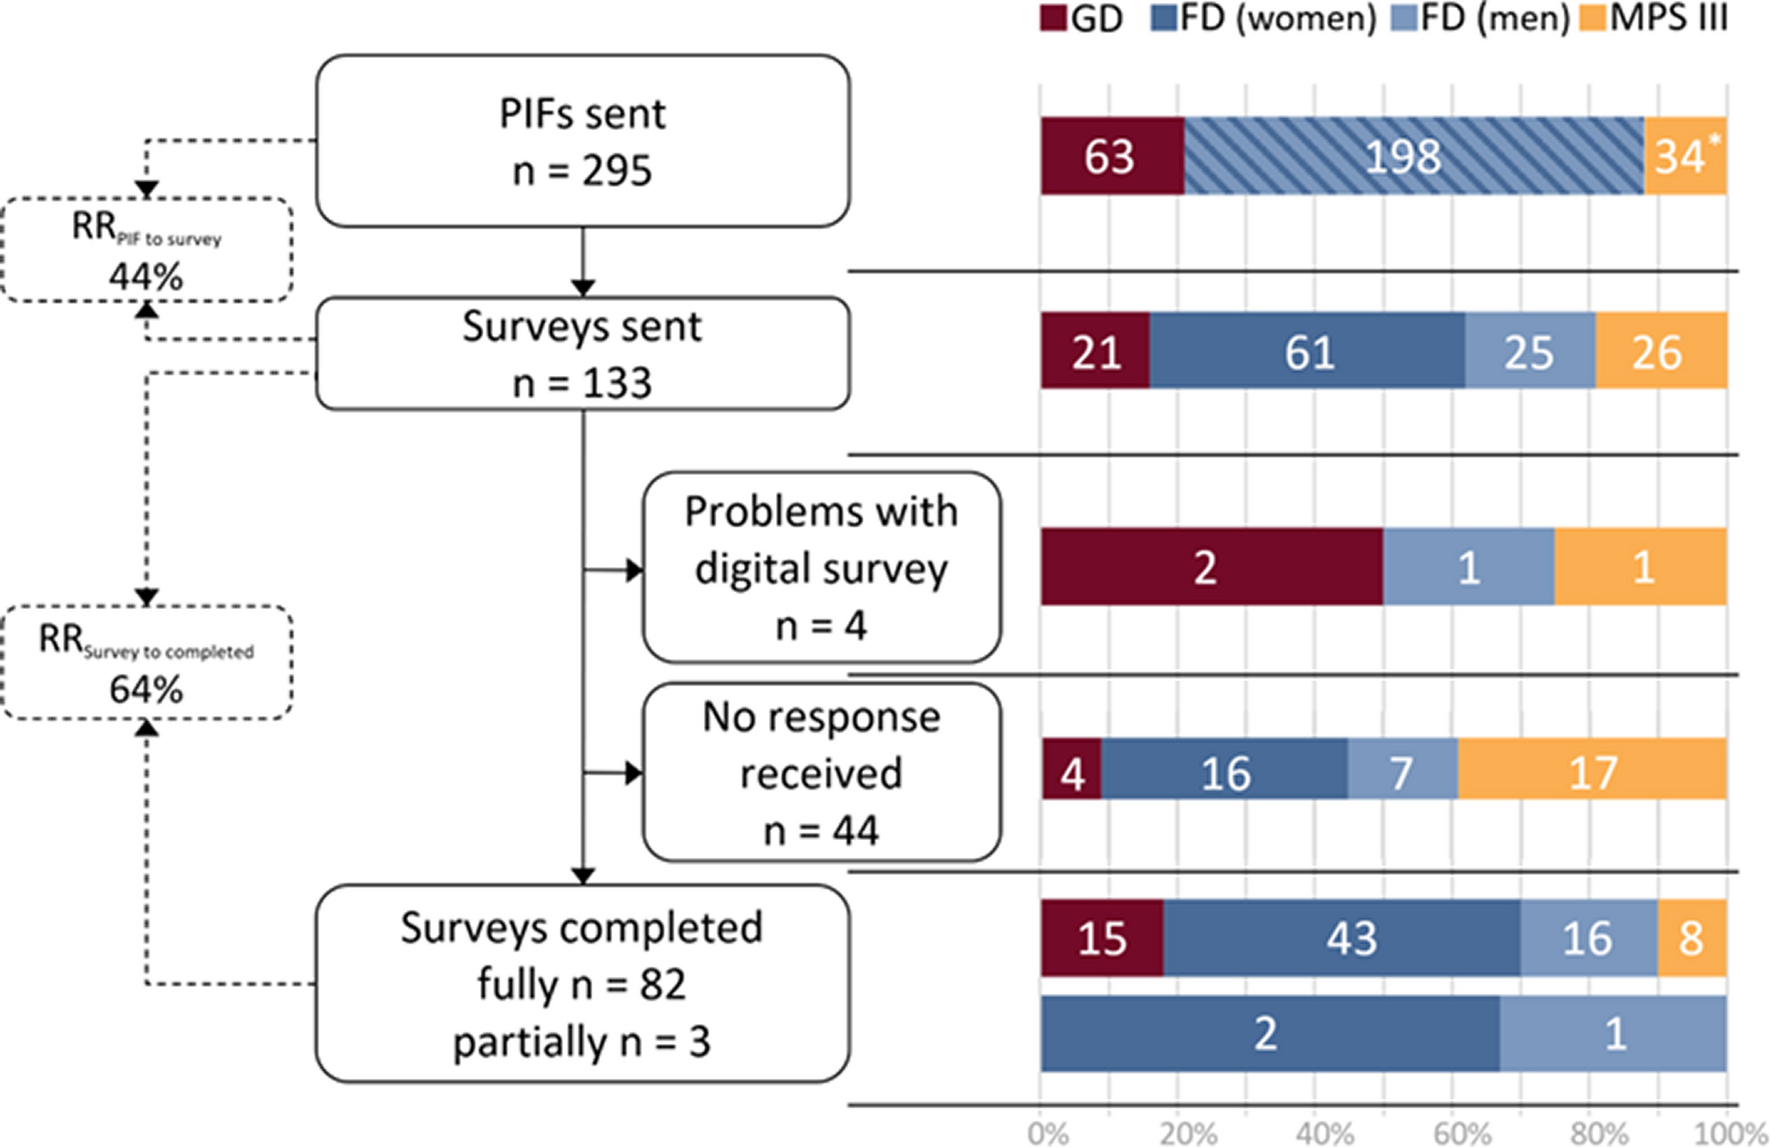


This study included a total of 194 participants diagnosed with SMA. However, considering that six participants were aged over 18 years and two questionnaires were determined to be invalid, a total of 186 questionnaires were used for final analysis (Fig. 1). Participants were recruited on a national scale (Supplementary Material 2). The average age of the participants was 6.70 ± 3.81 years, with males comprising 51.6% of the cohort. Regarding SMA types, 12.9% were classified as type 1, 71.0% as type 2, and 16.1% as type 3.
Fig. 1
Flow chart showing the distribution and collection of questionnaires
The demographics and rehabilitation situation of SMA patientsAs shown in Fig. 2(a), of the 186 patients, 43.55% (n = 81) underwent rehabilitation both at home and in a hospital/institution, 25.27% (n = 47) received rehabilitation at home only and 15.59% (n = 29) opted for standard training alone, while 29 did not undergo any rehabilitation in the past 14 months. Among these 29 patients, the primary reason for not pursuing rehabilitation were economic constraints (66.2%) and a lack of family rehabilitation skills (47.6%). The mean age of patients varied depending on the type of rehabilitation they received, and the mean ages for those undergoing family and standard rehabilitation, standard rehabilitation alone, family-based rehabilitation alone, and no rehabilitation were 5.40 ± 2.82, 5.90 ± 3.01, 7.48 ± 4.43, and 9.31 ± 3.90, respectively. As illustrated in Fig. 2(b), there was a significant age difference between those who received no rehabilitation or family-based rehabilitation only (in red, median = 8.4 years) and those who received standard rehabilitation or both family and standard rehabilitation (in green, median = 4.9 years) (z=-4.49, p < 0.001). Figure 3 provides an overview of the specific components of standard and family rehabilitation. The most frequently addressed rehabilitation elements for SMA patients included mobility and exercise, stretching, position management, and the use of assistive technology.
Fig. 2
Rehabilitative types of SMA
Fig. 3
Rehabilitative items of SMA patients
In this study, a total of 145 patients were stratified into three groups: the LR group (n = 104), SR group (n = 34), and NR group (n = 7). Comparative analysis of the demographics and clinical characteristics among these groups is shown in Table 1. The results indicate that the proportion of patients undergoing gene therapy was significantly lower in the NR group compared to the LR and SR groups (71.4% vs. 96.6% and 94.1%, p = 0.01). Furthermore, patients in the SR group (mean age = 8.43 ± 3.98) and NR group (mean age = 9.51 ± 4.44) were found to be older compared to those in the LR group (mean age = 6.16 ± 3.58). We observed that this age discrepancy corresponded with the distribution of SMA types, as a higher percentage of type III patients were observed in the SR group in contrast to the LR group (41.2% vs. 9.7%). A similar trend was observed in patients who could walk independently (12.4% vs. 35.3%, p<0.01). Additionally, it was observed that patients requiring respiratory ventilation were more inclined to short-term rehabilitation (2.8% vs. 14.7%, p = 0.01). Nevertheless, no significant differences were observed among the LR, SR and NR groups concerning gender, bone or joint deformity, nasogastric tube intubation, annual family income, parental educational background, and the duration of daily caregiving.
Table 1 Demographics and characteristics of SMA patients with different rehabilitated durationThe PedsQL score of SMA patientsAmong the 186 patients included in the study, the mean PedsQL MNN score for patients aged above 2 years (n = 170) was 55.5 ± 1.5, whereas the PedsQL infant scale (n = 16) yielded a score of 71.3 ± 8.8. Notably, all patients aged below 2 years had received gene therapy, while only 9 patients above 2 years had not undergone gene therapy. The study observed that patients who received gene therapy had significantly higher PedsQL MNN scores compared to those who did not receive it (41.56 ± 13.48 vs. 56.27 ± 15.70, p = 0.007). Consequently, further analysis was conducted specifically among the subset of patients who received gene therapy (n = 161). As presented in Table 2, the analysis revealed strong associations between the PedsQL MNN score and factors such as age, SMA type, best motor function, bone or joint deformity, and long-term rehabilitation. However, no significant differences were found in gender, nasogastric tube intubation, ventilator support, and annual family income between the two groups. Subsequently, Table 3 outlines the results of binary logistic regression about factors independently correlated with a low PedsQL MNN score. The analysis indicated that walking ability was negatively correlated with a lower PedsQL MNN score (OR = 0.027, 95%CI = 0.002–0.375, p < 0.01). Similarly, a negative correlation was observed in the long-term rehabilitation group (OR = 0.314, 95%CI = 0.106–0.927, p = 0.04). Conversely, bone or joint deformity was positively associated with a lower PedsQL MNN score (OR = 3.786, 95%CI = 1.156–12.397, p = 0.03).
Table 2 Factors associated with PedsQL MNN score in patients with gene therapy(N = 161)Table 3 Factors independently associated with a low PedQL MNN score (< 60) in patients with gene therapy (N = 161)Relevance of rehabilitation and PedsQL MNN in unable-to-walk patients with gene therapyGiven the strong correlation between walking ability and the PedsQL MNN score, we conducted subgroup analysis using data from patients who were unable to walk. As shown in Table 4, the LR group exhibited a higher total score compared to the SR and NR groups (54.2 ± 15.1 vs. 45.9 ± 14.4 and 42.3 ± 14.3, p = 0.01), which was particularly prominent in the physical function section (59.0 ± 15.8 vs. 46.8 ± 15.2 and 45.6 ± 15.9, p < 0.01). Conversely, no significant differences were observed among the three groups concerning communication and family resources. Furthermore, we assessed the relationship between rehabilitative items and the physical function score (Fig. 4), and the results indicated that mobility and exercise (OR = 0.26, 95%CI = 0.08–0.81, p = 0.02), as well as assistive technology (OR = 0.28, 95%CI = 0.10–0.82, p = 0.02), were independently associated with a lower score in a negative direction, while no significant differences were observed in the other items.
Table 4 Impact of rehabilitation treatment on PedsQL scores in unable-to-walk patients with gene therapy (N = 129)Fig. 4
Forest plot of physical function score < 60 patients and rehabilitation items (in unable-to-walk patients with gene therapy, N = 129)
留言 (0)