
記住我


The esthetic appearance of a person plays an increasingly important role in our society today.[1-3] The importance of facial attractiveness is ranked higher than the rest of the body, and smiles are particularly important in this respect.[4-6] During interpersonal communication, the focus is mainly on the eyes and mouth of the other person.[7] After the eyes, the mouth is one of the most crucial parts of the face in social interactions between people and one of the most relevant ways to convey emotions.[7-9] Thus, the importance of an esthetically beautiful smile in social life is evident.[10] Numerous studies have already dealt with aspects that have a significant influence on the esthetics of the oral region. For example, tooth position deficits and midline shifts have already found their way onto the list of problems of dental and orthodontic treatment.[5,11-16] The role of the buccal corridors is increasingly becoming the focus of discussion. Frush and Fisher defined the buccal corridor as early as 1958 as the space between the posterior teeth and the cheek.[17] The influence of the buccal corridor on facial esthetics has not yet been conclusively clarified as the current data situation still provides partly divergent results.[1] Hulsey concluded that the buccal corridor does not influence smile esthetics.[18] However, Moore et al. showed that the buccal corridor has an influence on the esthetics of the smile and that laypersons are able to perceive it.[19,20] Aside from controversial studies, evidence on the effects of facial shape and gender on the perception of buccal corridors is also lacking. It is also important to note that the different esthetic perceptions of dental professionals (DPs) compared to laypeople professionals (LPs) result in their different perceptions of treatment needs and can be a source of patient-practitioner conflict.[21] Therefore, recognizing and applying these distinctions is crucial for the clinician. The use of proper strategies is essential to meet patient expectations and outcomes.[22] Moreover, both LP as well as DPs’ perceptions should be evaluated. Thus, the present study aimed to examine the effects of buccal corridor width on the LP and DP’s perception of facial esthetics in different facial shapes. The null hypothesis stated that the increase in buccal corridor width does not affect the LP and DP’s perception of facial esthetics in different facial shapes.
MATERIAL AND METHODSEthical approval for this study was obtained from the Ethics Committee at the Johann-Wolfgang Goethe University (approval number: 20-601).
One male and one female young Caucasian model were photographed in portrait format and written consents were obtained from both models. The aim was to ensure that the models had almost symmetrical facial features and aligned teeth. The program Adobe Photoshop 2020 Version 21.1.2 (Adobe Inc., Del-aware, USA) was used for the digital manipulation of the original images. The digital manipulation described by Moore et al. was used in the present study.[20]
Since a small discrepancy in the distance between the study model and the camera could not be excluded in principle for the two models, the original buccal corridor could not simply be determined by a linear measurement. For this reason, the calculation was made on a percentage basis.[20]
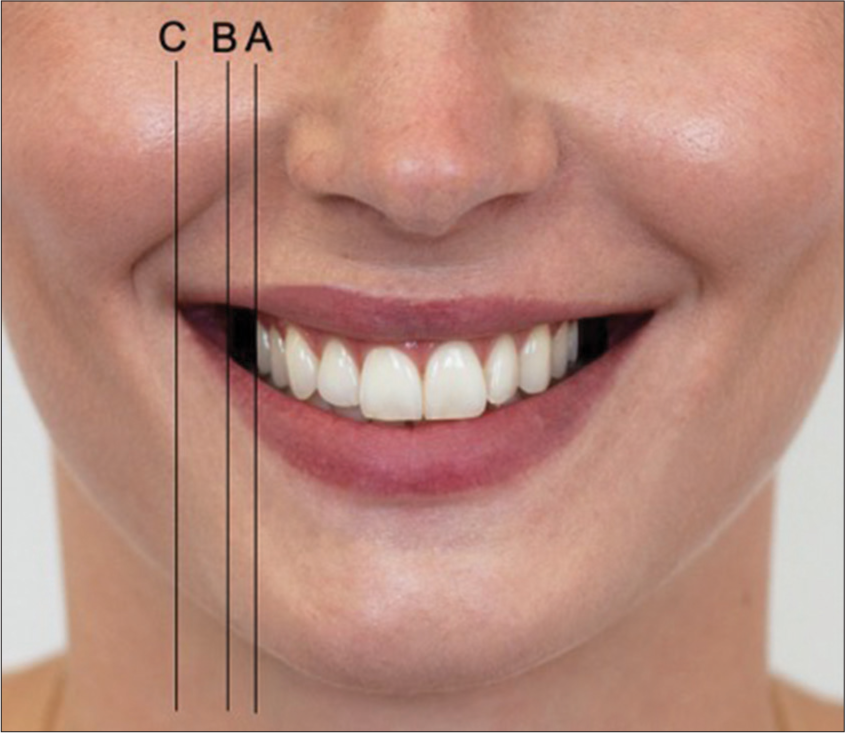
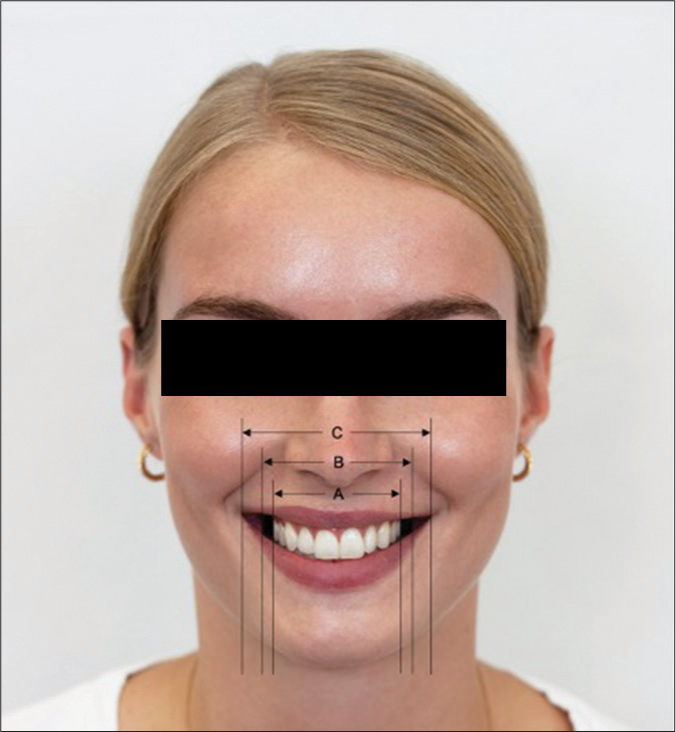
Since the cheek itself has a certain thickness, two commissures were defined for the calculation of the buccal corridor: the outer commissure (C) and the inner commissure (B). The visible maxillary dentition (A) was used for the calculation of the buccal corridors, since it can reach at most as far as the inner commissure (B) [Figures 1 and 2].
Export to PPT
Export to PPT
Thus, according to Moore et al., the following formula was used for the calculation of the buccal corridor: [20]
Buccal corridor=B−AB×100The initial images were then digitally edited to generate manipulated images with buccal corridors measuring 2%, 10%, 15%, 22%, and 28%.
By rearranging the formula, the corresponding maxillary dentition width was calculated for each buccal corridor percentage:
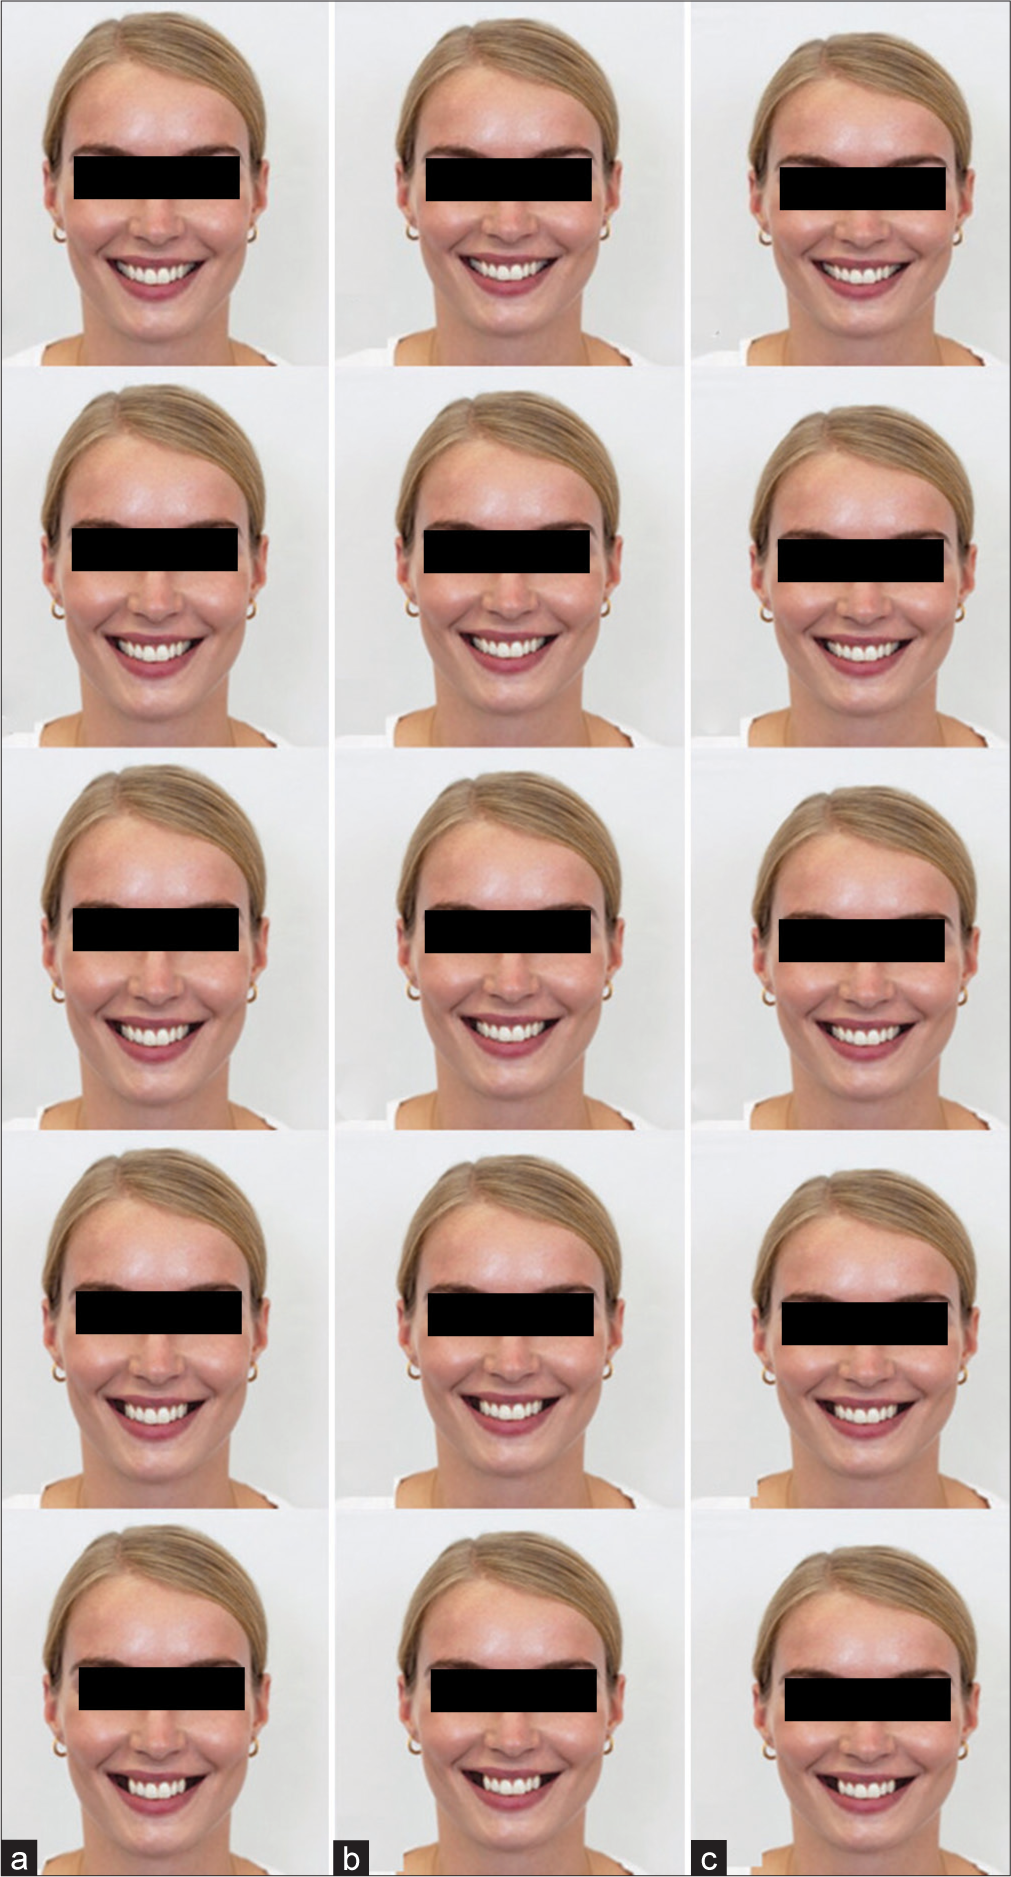
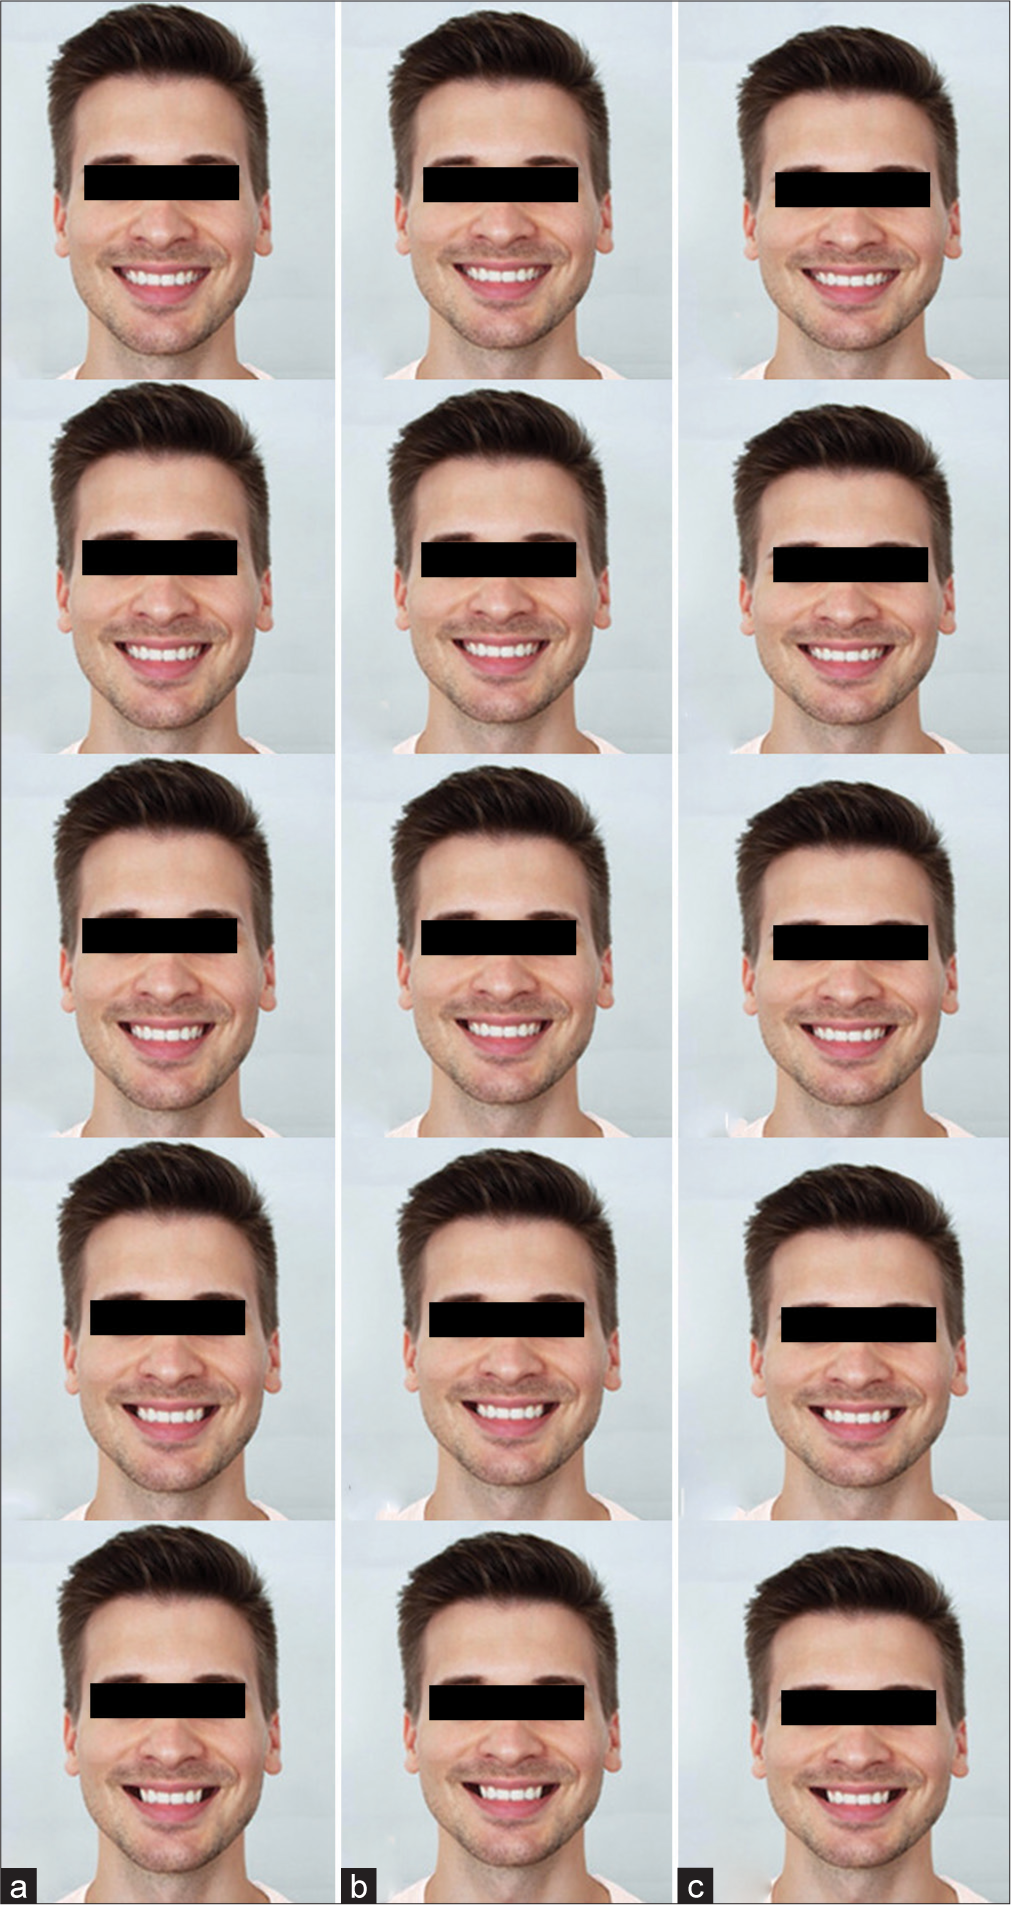
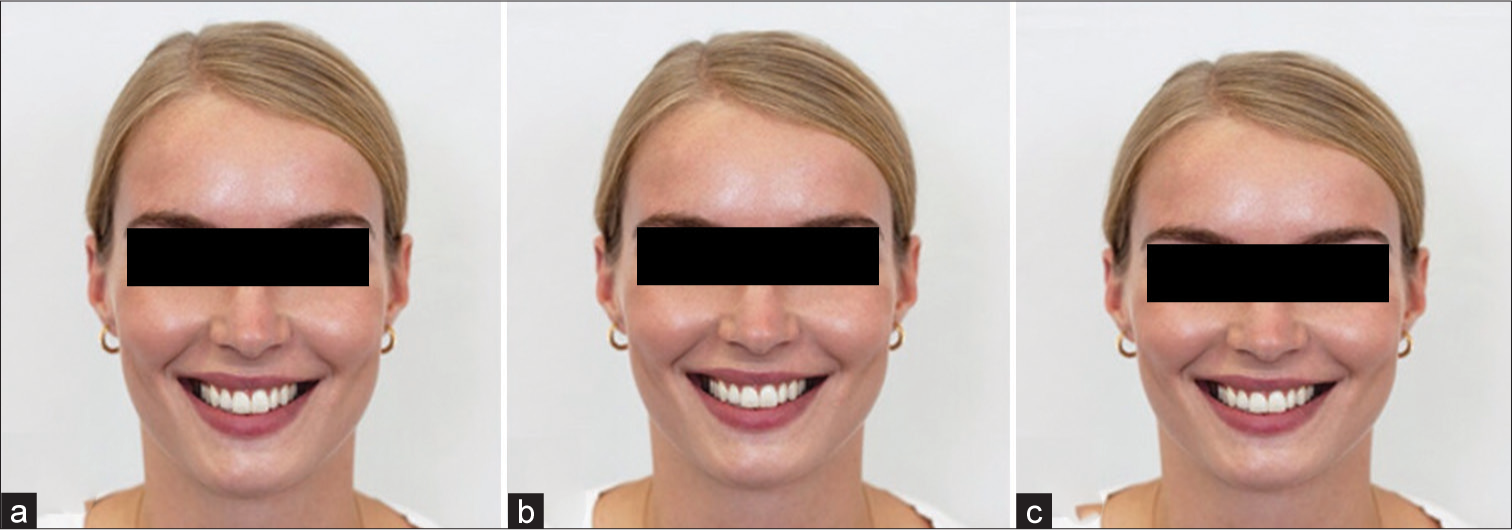
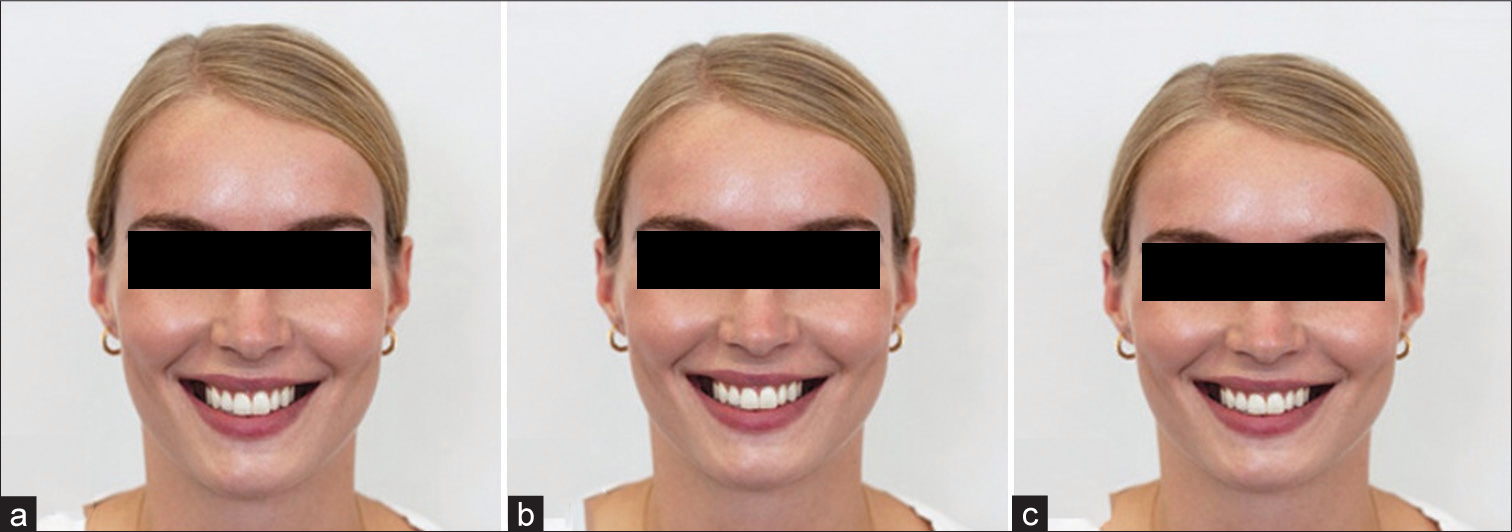
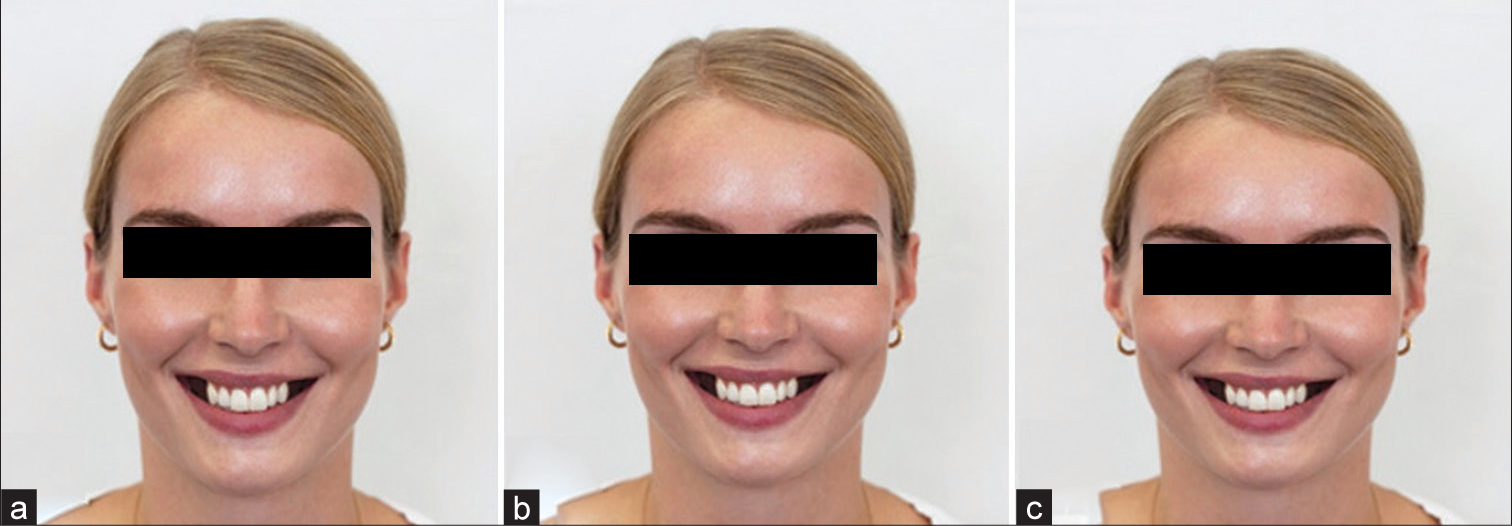
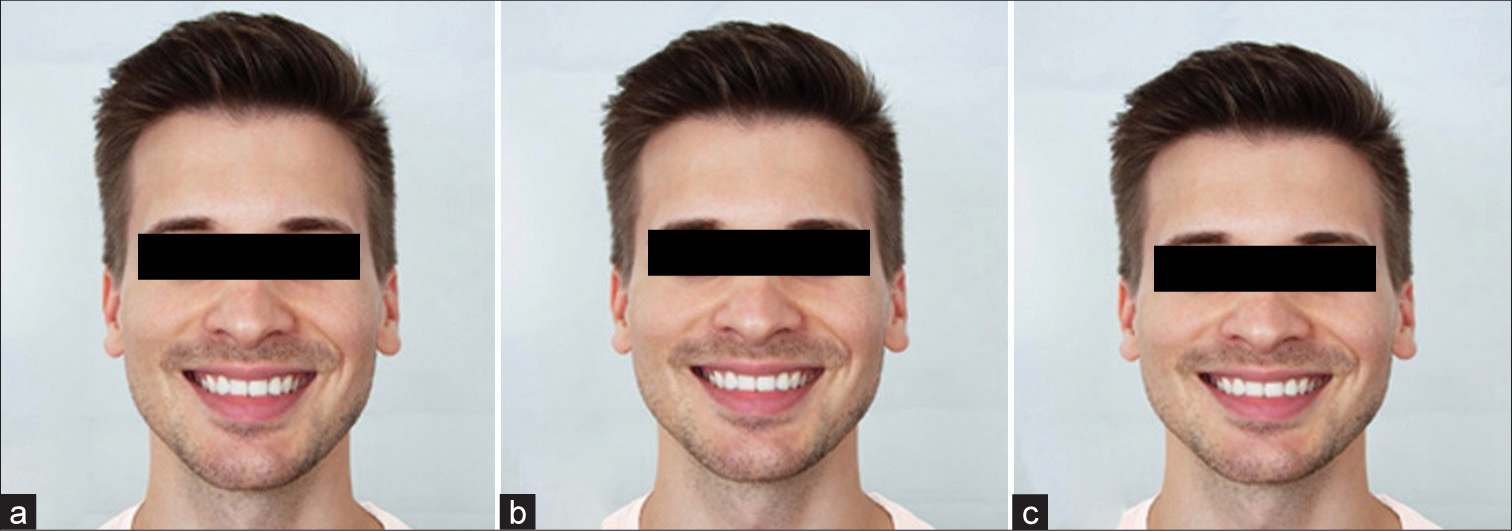
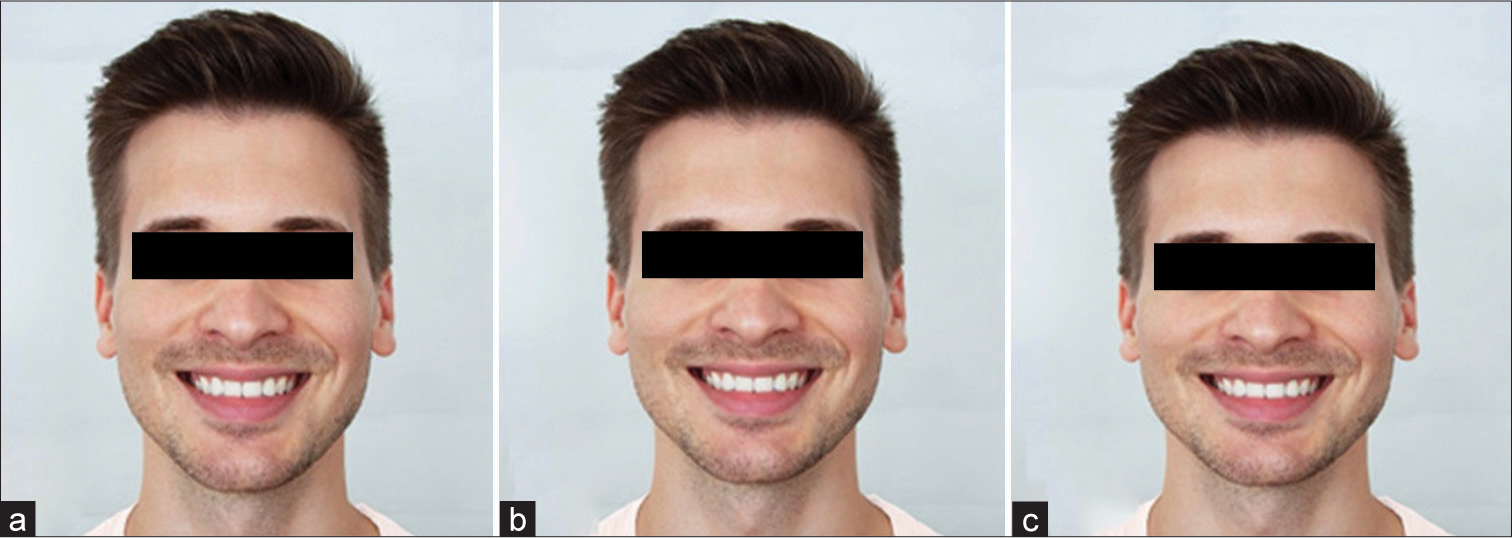
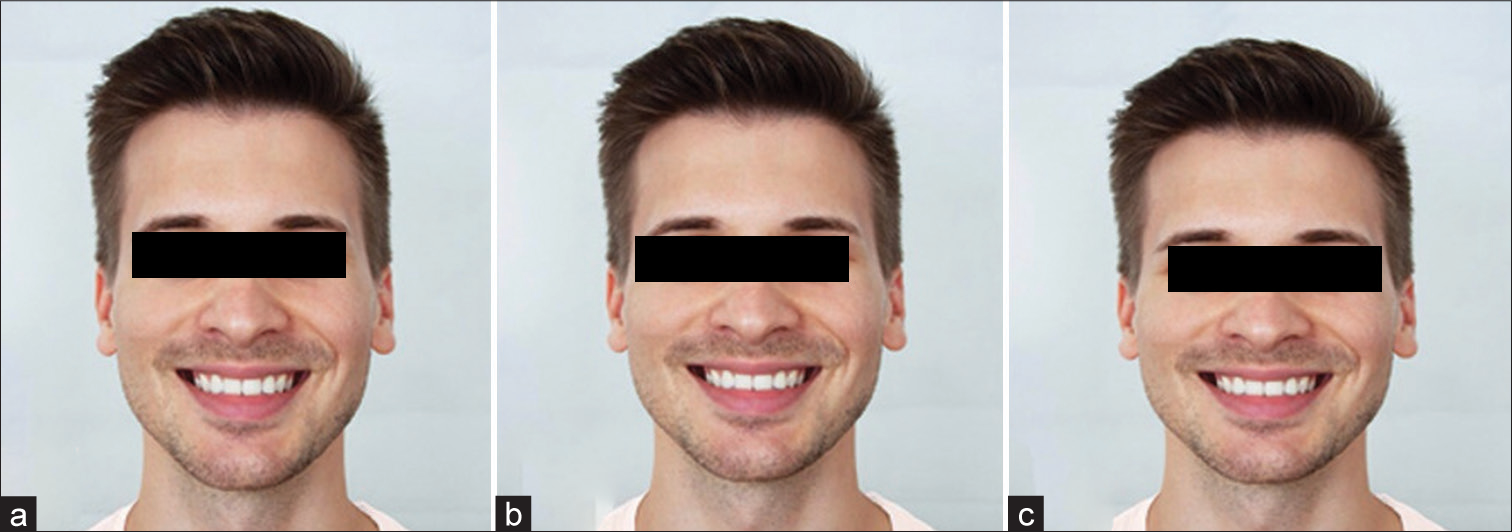
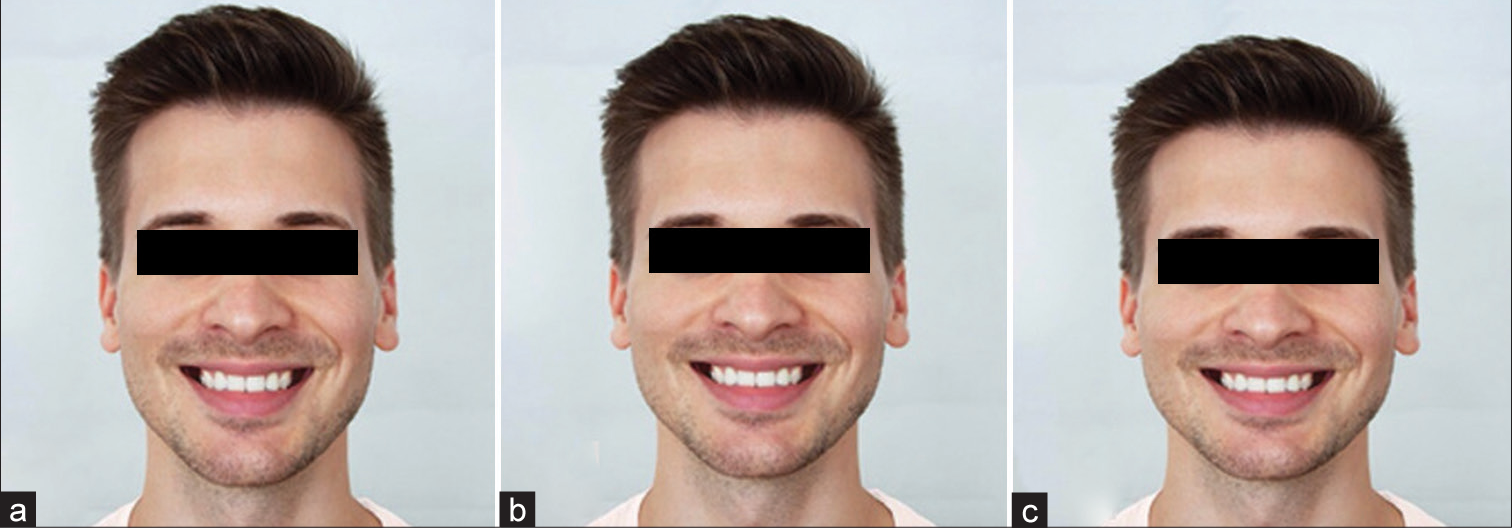
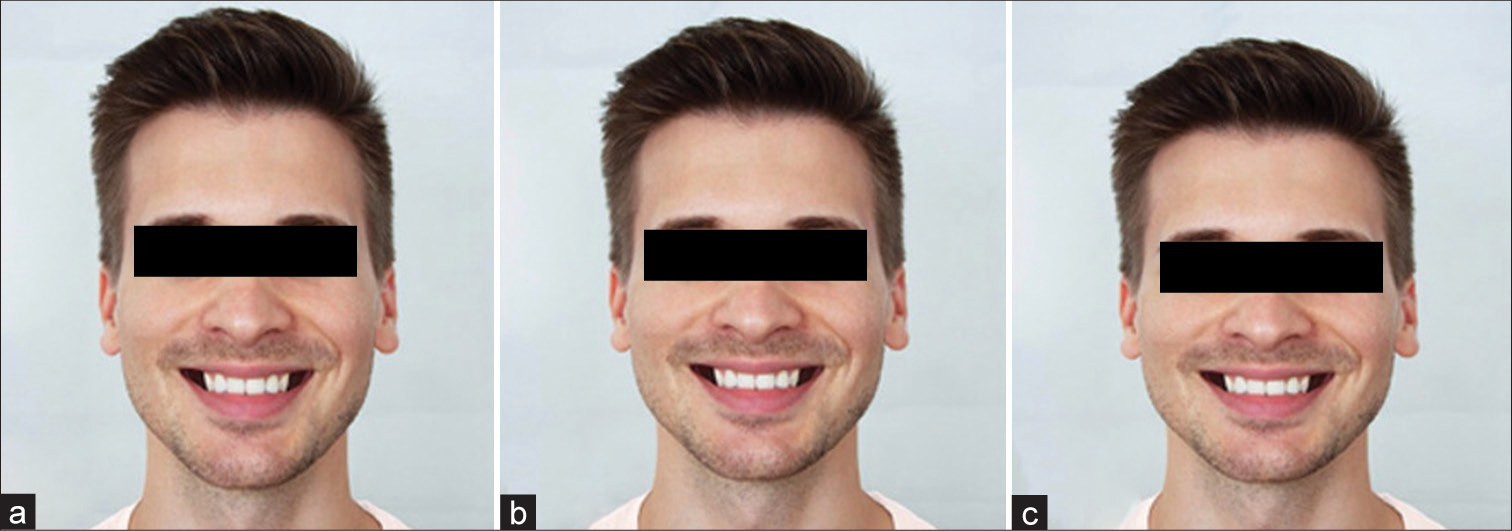
−A=Buccal corridor100×B−BUsing the ruler tool in Photoshop, the calculated maxillary dentition width was marked. Subsequently, the teeth were selected up to the necessary maxillary dentition width and color-matched to the buccal mucosa. This was done for the sake of keeping the natural facial appearance of the models as opposed to the compression of the entire visible maxillary dentition, which was used by Moore et al.[20] The compression procedure also changes the inter canine distance and, thus, leads to an unnatural-looking result. Since both study models were classified as normo-facial, the images had to be changed to dolichofacial and brachyfacial, respectively. For this purpose, the images were compressed in Photoshop by 4–96% for the brachyfacial type and stretched by 4–104% for the dolichofacial type. Thus, for each sex and each of the five buccal corridors, three images differing in facial type were created [Figures 3-12].
Export to PPT
Export to PPT
Export to PPT
Export to PPT
Export to PPT
Export to PPT
Export to PPT
Export to PPT
Export to PPT
Export to PPT
For the PowerPoint presentation, a randomized order of the 30 images was created. Solid blue slides were inserted between the individual images to make immediate and direct comparisons impossible.
The study participants consisted of two groups of LPs and DPs. The number of cases was estimated by assuming a significance level of P = 0.05 and a test strength of 80%. Based on a study by Zange et al., a dispersion of 23.09 units was assumed for the LP group, a dispersion of 21.74 for the DP group, and a mean difference between the groups of 15.2.[23] This resulted in a Cohen’s effect size of under δ = 0.67781. To achieve a test strength of 80%, a sample size of at least 37 subjects per group was required. The case number was increased to a group size of 40 study participants per group to compensate for the drop-out rate of about 5%. This resulted in a total participant size of 80 (40 in each group).
The participants were informed that they would be shown images of a male and a female model in the format of a PowerPoint presentation, and they were required to rate the facial attractiveness of these images.
Each study participant had 10 s to evaluate the individual pictures. A return to the previously shown images was not allowed. Standardized questionnaires were used for both groups of participants to evaluate the series of images. The questionnaire was divided into two parts. In the first part, a survey of anonymized personal data specified to the participant groups took place. The second part was about the evaluation of the collected pictures. The participants were asked to rate the pictures on a Likert scale from 1 (unattractive) to 7 (attractive).
To investigate the influence of the buccal corridor on facial esthetics and identify the optimal size, we first analyzed the data using descriptive statistics. Then, we applied the Wilcoxon sign-rank test to assess the significance of our findings. In addition, we examined the differences in the ideal buccal corridor between genders and the role of changes in facial shape on the assessments. To determine whether laypersons and experts evaluated the buccal corridor differently, we conducted the Mann–Whitney U-test. The Bonferroni correction method was used correctly for multiple tests to adjust the obtained significance values.
RESULTSEighty participants were recruited for the present study. Each group consisted of 20 male and 20 female participants with a mean age of 30.33 ± 5.19 (LP) and 32.03 ± 4.43 (DP) years old.
The results of the present study showed that the buccal corridor had a significant influence on observers’ perception of facial esthetics [Table 1]. Descriptive data regarding the perceived facial attractiveness of the digitally edited images are shown in [Figure 13].
Table 1: Comparisons between the perceived facial attractiveness of digitally edited images using the Wilcoxon signed-rank test and Bonferroni correction.
Image 1 Image 2 P-value B M2d M10d 0.021 0.084 M15d <0.001 <0.004 M22d <0.001 <0.004 M28d <0.001 <0.004 M2m M10M <0.001 <0.004 M15m <0.001 <0.004 M22m <0.001 <0.004 M28m <0.001 <0.004 M2b M10b 0.001 0.004 M15b <0.001 <0.004 M22b <0.001 <0.004 M28b <0.001 <0.004 f2d f10d 0.232 0.928 f15d <0.001 <0.004 f22d <0.001 <0.004 f28d <0.001 <0.004 f2m f10m 0.161 0.644 f15m 0.011 0.044 f22m <0.001 <0.004 f28m <0.001 <0.004 f2b f10b 0.004 0.016 f15b <0.001 <0.004 f22b <0.001 <0.004 f28b <0.001 <0.004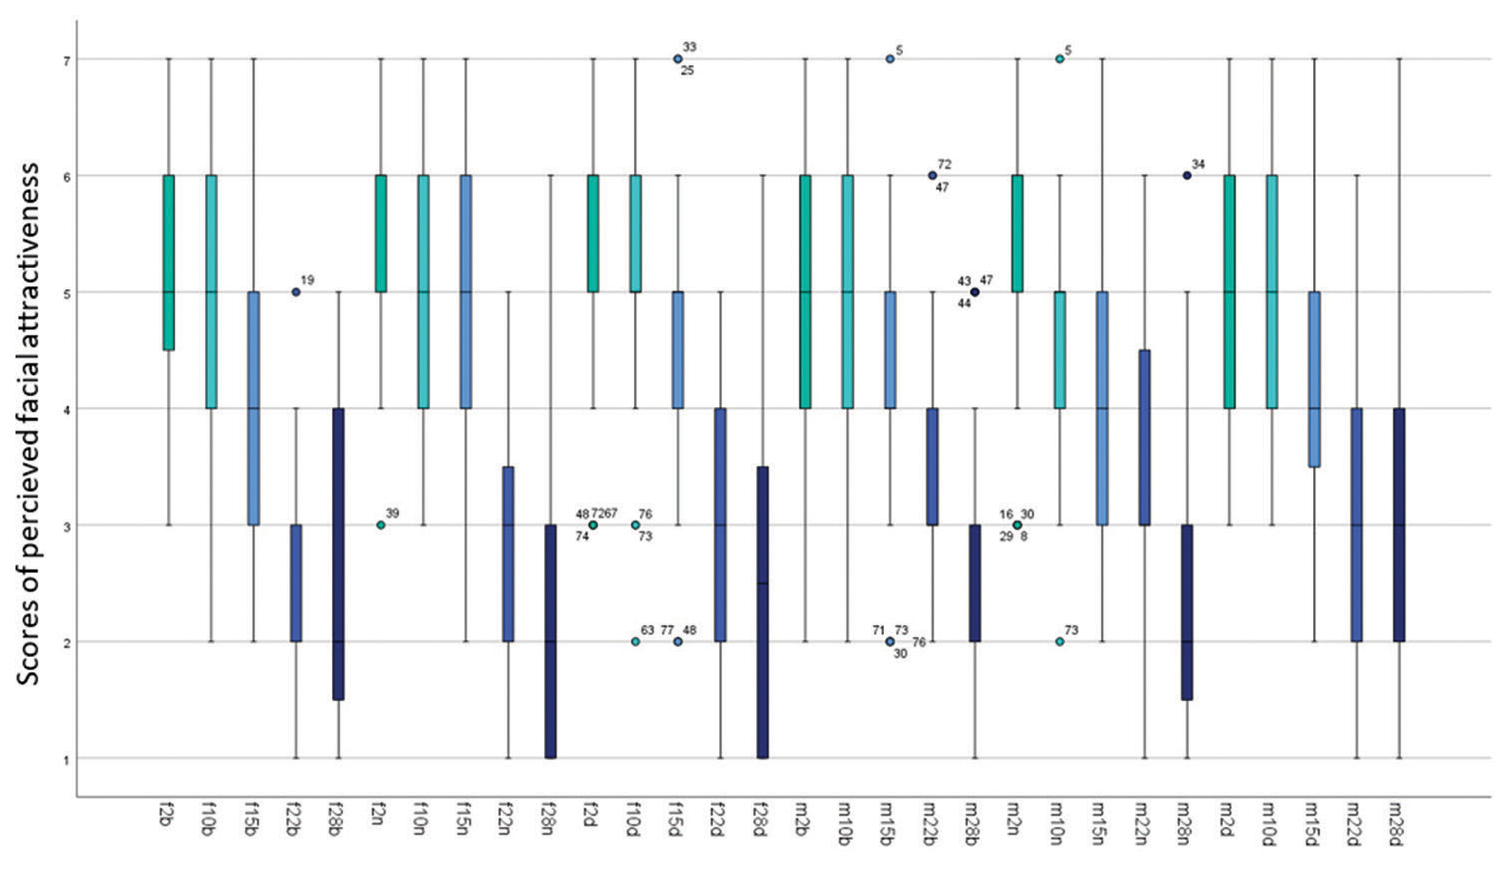
Export to PPT
No statistically significant differences were recorded between the assessment of the LP and DPs [Table 2].
Table 2: Comparisons between DP and LP groups regarding their perception of facial attractiveness of digitally edited images using the Mann–Whitney U-test and Bonferroni correction.
Image P-value B f2b 0.909 1 f2m 0.381 1 f2d 0.359 1 M2b 0.253 1 M2m 0.409 1 M2d 0.243 1 f10b 0.603 1 f10m 0.019 0.57 f10d 0.109 1 M10b 0.192 1 M10m 0.555 1 M10d 0.431 1 f15b 0.273 1 f15m 0.236 1 f15d 0.017 0.51 M15b 0.165 1 M15m 0.086 1 M15d 0.282 1 f22b 0.920 1 f22m 0.984 1 f22d 0.612 1 M22b 0.099 1 M22m 0.257 1 M22d 0.224 1 f28b 0.106 1 f28m 0.292 1 f28d 0.318 1 M28b 0.821 1 M28m 0.466 1 M28d 0.078 1The DP consisted of dentists with experience in conservative dentistry,[11] orthodontics,[9] oral and maxillofacial surgery[8] and prosthodontics.[12] Although no statistically significant differences were found among the different dental specialties, it is important to acknowledge that the sample size per group was insufficient to detect a statistical effect.
In the male study model, although the 2% buccal corridor in the dolichofacial face was rated the best in the descriptive statistics, there was no significant difference compared to the rating of the 10% buccal corridor. The 2% buccal corridor was rated better in the dolichofacial face compared to the other buccal corridor sizes (15%, 22%, and 28%) with a significance of P < 0.004. In the meso- and brachyfacial face, the 2% buccal corridor was evaluated better compared to all other buccal corridor sizes (10%, 15%, 22%, and 28%), with a significance of P < 0.005.
In the female study model, although the 2% buccal corridor was rated the best in the dolicho- and mesofacial face in the descriptive statistics, there was no significant difference compared to the rating of the 10% buccal corridor. The 2% buccal corridor was rated better in the dolicho- and mesofacial face compared to the other buccal corridor sizes(15%, 22%, and 28%) with a significance of P < 0.05. In the brachyfacial face, the 2% buccal corridor was evaluated better compared to all other buccal corridor sizes (10%, 15%, 22%, and 28%), with a significance of P < 0.02. The 2% buccal corridor of the female study model in the mesofacial face was rated best with a median of 6. However, as already mentioned above, no significant difference (P = 0.644) could be seen in the comparison between the evaluation of the 2% and 10% buccal corridors.
In the comparison between the 2% and the other buccal corridors of 15%, 22%, and 28%, a significant difference became visible (P < 0.05).
This shows that neither the shape of the face nor the gender has a significant influence on the ideal buccal corridor size.
DISCUSSIONOur results suggest that a buccal corridor of 2% has the highest attractiveness rate among DPs and LPs, regardless of the models’ facial type and gender.
We incorporated the digitally edited images of one male and one female model for our comparisons. Instead of using different models with different facial types, as described by Zange et al.,[23] we decided to generate the different facial types through digital editing of the sample images.
Using different models has the potential evaluation bias, as it may not have been the facial type, but the subjective perception of the attractiveness of the study model which leads to differences in observers’ perception of facial attractiveness (study model A more attractive than study model B ≠ dolichofacial face shape more attractive than brachyfacial face shape). Both of our models were selected according to the esthetic criteria discussed by previous studies, including a good tooth position with complete dentition and orthoaxially positioned anterior teeth.[20,23-27]
The digitally created buccal corridor sizes of 2%, 10%, 15%, 22%, and 28% in our study correspond with the values reported in similar studies.[20,23,25,28-33] We did not include the 0% buccal corridor since Frush and Fisher have already concluded that the absence of a buccal corridor is perceived as unnatural and artificial.[17] It can be assumed that many of the current studies have adopted this view and have, thus, omitted the investigation of the 0% buccal corridor.[20,23,25,34] Apart from the form in which the images were presented to the study participants, the randomization of the sequence and the time limit in the evaluation was an important aspect that was also taken into account in the present study.[23,25,26] By inserting a neutral slide between the images to be evaluated and prohibiting a return to the previously shown images, a direct comparison between them should be prevented.[23,25] This approach can be particularly interesting when testing as to whether the buccal corridor, in the eyes of the study participants, has any influence at all on the esthetics of the face and smile and, if so, at what point this can be determined. Should this turn out to be one of the essential aspects in terms of attractiveness, it could be discussed whether a subsequent, direct comparison of the images would be useful to find out, ultimately, the ideal buccal corridor. Moore et al. chose the direct comparison throughout and always presented the study participants with a pair of images.[20] In this context, it should also be discussed whether the study participant should not be given the opportunity in advance to get an overview of the images to be evaluated. This is because when assessing the first picture, the study participant sets a level for the assessment, which could subsequently prove to be impractical; all pictures shown afterward that are considered more attractive would have to be rated better accordingly and vice versa. When viewing the first image, however, the study participant does not yet know the subsequent images. If a high score is already given here, although this picture is not perceived as more attractive in comparison to the following ones, only a small scale remains for future evaluations. These distortions could, presumably, be avoided if, as in Moore et al., a warm-up had taken place beforehand or, as in Sadrhaghighi et al., the visual material had been presented once before the evaluation.[20,35] When investigating whether the change in the buccal corridor is perceived by the study participants at all, the question should be asked with regard to the objective, to what extent they should be informed about the background. If the topic is explained in detail, the study participant’s gaze could be too strongly focused on the oral region with regard to the question and, thus, this could possibly lead to a distortion of the desired result. Therefore, we asked the participants to evaluate the facial esthetics as opposed to the smile esthetics to avoid attracting their attention toward the mouth region of the models.
Aside from the influence of buccal corridor size, we also compared the role of the profession on the individual’s perception of facial esthetic (DP vs. LP group). Possible differences between the perception of dentists and patients could lead to increased treatment load and patient dissatisfaction. Since all specialties in dentistry are involved in decision-making regarding the patients’ facial esthetics, it was of great importance for the present study to select dentists from different specialties. However, we acknowledge that the combination of all specialties in one group reduced the precision of our assessments, and therefore, further studies are required to demonstrate the perception of each specialty.
Our results showed no statistically significant differences between the perception of LPs and DPs. Our results are in agreement with those of similar studies.[19,30,36-42] A possible explanation for the lack of difference between LPs and DPs would be that the buccal corridor is such a striking aspect of facial esthetics and is immediately registered consciously or unconsciously. Here, a trained eye might not be necessary for the ability to differentiate. Moore et al. used only laypersons for the assessment but confirmed the assumption that laypersons are quite capable of recognizing and assessing differences between the various buccal corridor sizes.[20] Like this study, the frequently cited studies by Moore et al. and Zange et al., in particular, but also Shalini et al., concluded that a 2% buccal corridor is the best-evaluated size.[20,23,41,43,44] The fact that the 2% buccal corridor is not significantly different from the 10% buccal corridor in some face shapes was also confirmed in this form by Zange et al. It can be concluded from this that the transitions in esthetic perception can be fluid.[23] For the treating dentist, it can be deduced from this that in borderline situations, a 10% buccal corridor can also lie within the framework of esthetic sensation. Nevertheless, the goal should be the 2% buccal corridor. Therefore, practitioners are advised to consider the buccal corridor width of patients, especially when deciding between extraction and non-extraction treatments or planning therapies involving expansion.
Contrary to our results, Nimbalkar et al. and Nascimento et al. determined an ideal buccal corridor size of 15%.[25,45] These differences may also be due to ethnic and cultural factors that result in different esthetic perceptions.[25] Nevertheless, it can be said that a small buccal corridor is considered significantly better than a large one.[20,23,24,26,30,40,41,43,46] The difference in facial shapes in relation to the buccal corridor has been relatively rarely studied. All the studies reviewed that also dealt with this topic concluded – just like the present one – that the different facial shapes do not influence the ideal buccal corridor size.[23-25,29,46]
LimitationsThe selection of sample models and evaluators exclusively from the Caucasian ethnicity significantly reduces the generalizability of our results. This should be considered the primary limitation of the present research.
CONCLUSIONOur results suggest that the 2% buccal corridor could be aimed for as an ideal value in treatment planning for both genders regardless of their facial type. From the point of view of the present study, a 10% buccal corridor represents an alternative treatment goal in borderline situations where the 2% cannot be achieved due to other reasons.
Even though no differences were seen between the perception of DPs and LPs, the patients and their individual needs should stay the focus of treatment. Thus, different esthetic ideals must be respected and included in the treatment planning.
留言 (0)