
記住我


According to the World Health Organization Global Cancer Observatory (GLOBOCAN) project for 2020, colorectal cancer is the third most common malignancy after breast cancer in women and lung cancer (in both sexes) and the second most common cause of death from malignancy. There were 732 000 new rectal tumors registered for 2020. The highest incidence of the disease is in Europe, East Asia, and Australia, despite the fact that it is a preventable disease and in most developed countries with an established screening program.[1] There has been a year-on-year increase in incidence in the age group <50 years of up to 1–4%.[2,3]
The therapy of colorectal cancer is currently a combination of oncological and surgical treatment. Despite the standardization of processes and technical and technological advances in surgical treatment, there is still a high rate of post-operative complications. According to current studies, sarcopenia appears to be an important and therapeutically controllable risk factor for post-operative complications.[4-8]
Sarcopenia is defined as a generalized, progressive skeletal muscle disorder characterized by an accelerated loss of muscle mass and function, associated with an increased incidence of adverse events such as falls, leading to a decline in activity, development of frailty, and ultimately increasing mortality.[9] According to the updated definition of the European Working Group on Sarcopenia in Older People, an important aspect is the decline in muscle strength, which seems to be more important and, above all, more measurable in clinical practice than muscle quality and quantity.[10] The changes are not only functional but also structural. Histologically, there is loss of muscle fibers or fatty degeneration.
Loss of muscle mass is a natural consequence of aging, but pathologically it can be accelerated by various disease states, such as malignant processes. Sarcopenia is a proven risk factor for post-operative complications and overall poorer prognosis of patients. These claims are supported by a number of studies already conducted, for example, in patients with gastric cancer, rectal cancer, patients undergoing emergent laparotomy, or patients with acute mesenteric ischemia.[5,11-13] Radiological imaging methods such as dual X-ray absorptiometry, computed tomography (CT), and magnetic resonance imaging (MRI) are one of the ways to detect muscle loss or changes in muscle structure.[9] As shown in the work of Shen et al. and Mourtzakis et al., the examination of skeletal muscles on CT section at the level of the third lumbar vertebra (L3) correlates strongly with the skeletal muscle status of the whole body.[14,15] However, we found a number of controversies in the previous studies. In the work of Chai et al. found that sarcopenia is significantly associated with the incidence of postoperative complications after curative colorectal cancer resections.[4] In this work, they defined sarcopenia by CT volumetry using total abdominal muscle area, or also skeletal muscle area (TAMA or SMA, including the abdominal muscles, psoas, and erector spinae). A similar view is also presented by Rutten et al.[16]
The authors Wu et al. and after him also Benedek et al. agree that a suitable predictive tool for post-operative complications is the total psoas area (TPA), even when compared to psoas muscle density (PMD).[12,17] In contrast, Pekarova et al. found PMD to be predictive and TPA to be insignificant, which is consistent with the study by Cuijpers et al..[18,19] A very recent study by Xiao et al. then evaluates that PMD in particular is a predictive tool that correlates with the development of short-term post-operative complications in the population over 65 years of age, compared to TAMA and TPA.[20]
The primary objective of this study is to validate the claim that CT volumometry and densitometry of the musculus psoas can be used for pre-operative prediction of complications in patients undergoing elective rectal resection.
The secondary objective is to confirm the predictive value of serum C-reactive protein (CRP) levels in post-operative prediction of anastomotic leak (AL) development.
MATERIAL AND METHODSThis study was approved by the Ethics Committee of the Hradec Králové University Hospital. All the patients were informed about the study and the informed consent was obtained. A retrospective data analysis was performed on 305 patients who underwent surgical treatment for rectal cancer at the University Hospital Hradec Kralove between January 2017 and December 2021. Inclusion criteria were planned resection of the rectum for cancer with primary anastomosis and available staging CT of the trunk. Exclusion criteria were acute surgery, surgery other than rectal resection with primary anastomosis, and unavailable staging CT scan. Of the original cohort, 206 patients met the inclusion criteria for the study.
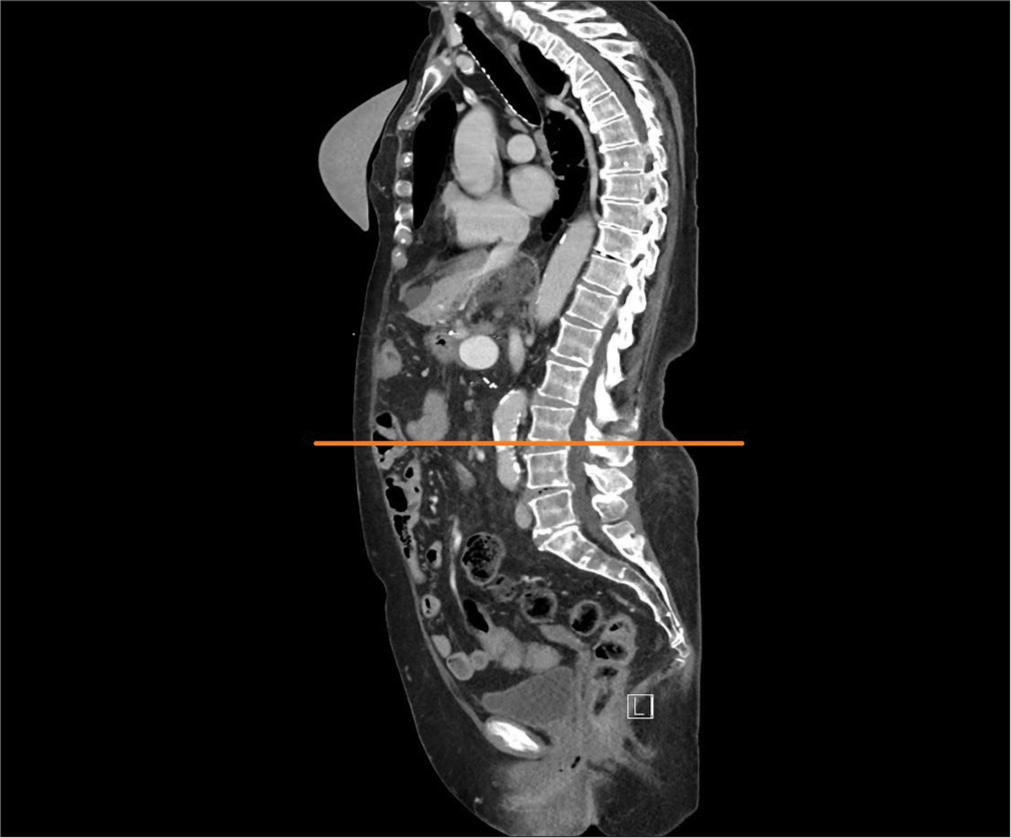
Patients underwent pre-operative staging trunk CT scans, which were stored in the picture archiving and communication system (PACS). Total psoas muscle area (PMA) was measured bilaterally and PMD was measured in the PACS using professional imaging software MUSE JiveX (VISUS Health IT GmbH Transfer, Bochum, Germany). Standard pre-operative staging CT is performed using Iomeprolum 90 mL intravenous contrast agent (Iomeron, Bracco S.p.A.). The analysis and calculation of these CT scan data was performed by a single radiologist without knowledge of other patient data to avoid potential bias in the results. PMA and PMD analysis was performed on a single CT slice at the level of the L3 inferior end plate [Figure 1]. Manual tracing of the muscle edges was used to determine the PMA, while plotting and averaging the Hounsfield unit (HU) values for the area, ranging from −30 to 150 HU for skeletal muscle, was used to determine the PMD [Figure 2]. The PMA was related to the patient‘s height for a more accurate correlation, resulting in the psoas muscle index (PMI).
Export to PPT

Export to PPT
Pre-operative anamnestic and post-operative hospital course data were obtained from the electronic records of the hospital information system. This included demographic and clinicopathological information such as Age, sex, body mass index (BMI), nicotinism, American Society of Anesthesiology grade, neoadjuvant chemoradiotherapy, tumor location, histological grading, and tumor node metastasis classification. Post-operative outcomes included leukocyte and CRP levels on post-operative days (POD) 3 and 5 and the incidence of complications. Complications were, further, subdivided into Clavien-Dindo 0–II and ClavienDindo III–V based on the Clavien-Dindo classification, which were classified as major.[21,22] Particular attention was paid to AL.
Statistical analysis of collected data was performed using Number Cruncher Statistical Systems (NCSS) Statistical Software (NCSS, LLC, Kaysville, Utah, USA), data with normal distribution were presented as mean ± standard deviation, and Student‘s t-test was used to compare groups. Data with rejected normal distribution were presented as median and interquartile range, Mann–Whitney U-test and Kolmogorov–Smirnov test were used for comparison. Results were considered significant at a level of P < 0.05.
RESULTSA total of 206 patients were enrolled in accordance with the study entry criteria. The basic characteristics of the cohort are shown in Table 1. The median age was 67 years, and there were 135 men (65.5%) in the study cohort. There was an association between the occurrence of post-operative complications and PMD at the borderline of statistical significance – [Figure 3]. There was no statistically significant difference for the PMI comparison – [Figure 4]. Tumor localization in the lower rectum appeared to be statistically significant for the development of complications, compared to localization in the upper or middle rectum. Leukocyte (White blood count) and C-reactive protein (CRP) levels of POD 3 and 5 in patients who experienced a complication during hospitalization were also statistically significant.
Table 1: Demographic data and clinical characteristics.
Total (n=206) No complication (n=124) Complication (n=82) P-value PMI, media n (0.25, 0.75) cm2/m2 6.57 (5.46, 7.95) 6.59 (5.48, 8.26) 6.50 (5.35, 7.83) 0.671 PMD, media n (0.25, 0.75) HU 47.72 (41.37, 54.35) 49.05 (42.23, 55.29) 45.21 (39.51, 53.11) 0.056 Age, media n (0.25, 0.75) years 67 (59, 73) 67 (57, 74) 68 (62, 73) 0.546 BMI, media n (0.25, 0.75) kg/m2 27.7 (24.9, 30.5) 27.3 (24.9, 30.6) 28.6 (24.8, 30.4) 0.597 Gender 0.498 Male, n (%) 135 (65.53%) 79 (63.7) 56 (68.3) Female, n (%) 71 (34.47) 45 (36.3) 26 (31.7) ASA score 0.457 ≤2, n (%) 122 (59.23) 76 (61.3) 46 (56.1) ≥3, n (%) 84 (40.77) 48 (38.7) 36 (43.9) Tumor location 0.041 Upper, n (%) 102 (49.5) 64 (51.6) 38 (46.4) Middle, n (%) 74 (35.9) 47 (37.9) 27 (32.9) Lower, n (%) 30 (14.6) 13 (10.5) 17 (20.7) TNM stage 0.434 I, n (%) 48 (23.3) 29 (23.3) 19 (23.1) II, n (%) 79 (38.3) 43 (34.7) 36 (43.9) III, n (%) 64 (31.1) 41 (33.1) 23 (28.1) IV, n (%) 15 (7.3) 11 (8.9) 4 (4.9) Neoadjuvant therapy, n (%) 125 (60.7) 79 (63.7) 46 (56.1) 0.357 Type of operation 0.523 Robotic, n (%) 130 (63.1) 80 (64.5) 50 (61) Laparoscopic, n (%) 50 (24.3) 31 (25) 19 (23.2) Conventional, n (%) 26 (12.6) 13 (10.5) 13 (15.8) Diverting stoma 61 (29.6%) 33 (26.6%) 28 (34.1) 0.246 WBC 3. POD, media n (0.25,0.75) *106 8.05 (6.28, 10.24) 7.58 (6.22, 9.28) 8.87 (6.84, 11.16) 0.004 WBC 5. POD, media n (0.25,0.75) *106 7.28 (5.66, 9.72) 6.59 (5.26, 8.72) 8.4 (6.04, 10.64) 0.0025 CRP 3. POD, media n (0.25,0.75) mg/L 92.8 (57.6, 149.1) 75.1 (51, 108.7) 130.5 (76.3, 226.3) <0.0001 CRP 5. POD, media n (0.25,0.75) mg/L 52.1 (23.7, 94.8) 38.4 (18.3, 57.9) 88.2 (47.5, 162.7) <0.0001![Comparison of values for psoas muscle density in patients with complicated and uncomplicated post-operative course. (median, inter-quartile range [IQR], whisker boundaries = ×1.5 IQR). (The black dot is value which is out of even whisker boundaries - in this case 1 patient). (HU: Hounsfiled unit.)](https://clinicalimagingscience.org/content/12/2024/14/1/img/JCIS-14-26-g003.png)
Export to PPT
![Comparison of values for psoas muscle index in patients with complicated and uncomplicated post-operative course. (median, inter-quartile range [IQR], whisker boundaries = ×1.5 IQR). (The black dot is value which is out of even whisker boundaries - in this case 3 patients)](https://clinicalimagingscience.org/content/12/2024/14/1/img/JCIS-14-26-g004.png)
Export to PPT
For comparison with other studies, PMD and PMI were also evaluated to classify complications into severe and non-severe, that is, grade 0–II and grade III–IV according to the Clavien-Dindo classification, as shown in Table 2. No statistically significant relationship was found between these values.
Table 2: Comparison of PMI and PMD according to severity of complications.
Clavien-Dindo classification Dindo 0–II (n=167) Dindo III–IV (n=39) P-value PMI, media n (0.25, 0.75) cm2/m2 6.66 (5.47, 8.33) 6.39 (5.33, 7.25) 0.178 PMD, media n (0.25, 0.75) HU 47.7 (41.64, 53.63) 48.93 (39.54, 54.66) 0.781Based on the evaluation of the severity of post-operative complications according to the Clavien-Dindo classification, the complications were categorized as follows: Grade I in 18 patients (21.95%), Grade II in 25 patients (30.49%), Grade III in 21 patients (25.61%), and Grade IV in 18 patients (21.95%). In 82 patients, a total of 107 complications were reported, indicating that some patients experienced several complications during hospitalization. The list of the most significant and most frequent complications is presented in Table 3.
Table 3: List of post-operative complications.
Complications Total % Surgical site infection Superficial 3 2.8 Deep 4 3.7 Intraperitoneal absces 3 2.8 Anastomotic leak Type A 18 16.8 Type B 16 14.9 Type C 17 15.9 Noninfectios wound complications Seroma, hematoma 7 6.5 Rectovaginal, rectovesical fistula 5 4.8 Cardiovascular and respiratory Cardiac arrest 3 2.8 Arrhythmia with intervention 3 2.8 Cardiac failure decompenzation 1 0.9 Bronchopneumonia 2 1.8 Sepsis and shock 5 4.8 Ileus 3 2.8 Bleeding 3 2.8 Others 14 13.1AL remains the most frequent and the most feared complication in colorectal surgery, which was diagnosed in 51 patients (24.76%) in our cohort, of which clinically manifest AL (grade B and C) was diagnosed in 33 patients (16.01%).[23] Evaluation of AL according to Clavien-Dindo classification was as follows: Grade A = Clavien-Dindo I– II, Grade B = Clavien-Dindo III, and Grade C = ClavienDindo IV. The AL was diagnosed by the clinical course and laboratory parameters on POD 3 and 5. Each patient also underwent endoscopic inspection of anastomosis on POD 5–10, if not reoperated earlier for AL. The most frequent surgical procedure was then anastomosis deconnection and derivation through terminal stoma according to Hartmann (8 patients). Axial ileostomy was constructed in six cases. Two patients underwent drainage only, a diverting stoma was already constructed during the primary procedure. One patient underwent dehiscence resuture under general anesthesia. Selected values compared for patients with and without AL are provided in Table 4.
Table 4: Comparison of selected values in AL patients.
AL AL (n=51) No leak (n=155) P-value PMI, media n (0.25,0.75) cm2/m2 6.49 (5.22, 7.62) 6.57 (5.51, 8.21) 0.522 PMD, media n (0.25,0.75) HU 45.33 (39.40, 54.34) 48.45 (41.97, 54.66) 0.278 Age, media n (0.25,0.75) years 68 (60, 72) 67 (58, 74) 0.668 BMI, media n (0.25,0.75) kg/m2 27.3 (25.4, 30.4) 27.7 (24.9, 30.6) 0.914 Gender 0.592 Male, n (%) 35 (68) 100 (64) Female, n (%) 16 (32) 55 (36) Tumor location 0.016 Upper, n (%) 17 (33.3) 85 (54.8) Middle, n (%) 22 (43.2) 52 (33.5) Lower, n (%) 12 (23.5) 18 (11.7) Neoadjuvant therapy, n (%) 32 (62.8) 94 (60.7) 0.790 Type of operation 0.667 Robotic, n (%) 34 (66.7) 96 (61.9) Laparoscopic, n (%) 10 (19.6) 40 (25.8) Conventional, n (%) 7 (13.7) 19 (12.3) Diverting stoma, n (%) 14 (27.5) 47 (30.3) 0.696 CRP 3. POD, media n (0.25,0.75) mg/L 167.7 (102.1, 229.7) 77.6 (50.3, 113.3) <0.0001 CRP 5. POD, media n (0.25,0.75) mg/L 114.2 (63.6, 202.8) 40.3 (20.5, 71) <0.0001A statistically significant risk factor for the development of AL was the localization of the tumor and, thus, the construction of the anastomosis in the lower rectum. The fact that the construction of defunctioning stomas does not reduce the incidence of AL was confirmed (P = 0.696). However, the claim that stoma construction reduces grade of AL was not confirmed (P = 0.4), which is contrary to recent studies.[24,25]
The secondary aim of the study was to verify the correlation of CRP levels with the development of AL, but also other complications. In this case, their negative predictive value (NPV) is particularly statistically significant. Using receiver operating characteristic (ROC) analysis, cutoff values for CRP levels of POD 3 and 5 in relation to the risk of developing AL were determined. The cutoff for CRP level of 3rd POD was 115.7 mg/L. For this value, the sensitivity (SE) was 0.807, specificity (SPEC) 0.703, positive predictive value (PPV) 0.368 (95% confidence interval [CI] 0.254–0.493), NPV 0.944 (95% CI 0.883–0.979), and area under the curve (AUC) 0.825. The cutoff for CRP level on post-operative day 5 was 76 mg/L (SE = 0.936, SPEC = 0.779, PPV = 0.475 [95% CI 0.346–0.607], NPV = 0.983 [95% CI 0.939–0.998], and AUC = 0.919). These values are in broad agreement with the results of the present studies.[26-28]
DISCUSSIONSarcopenia has attracted attention in recent years as a risk factor for increased incidence of post-operative complications and poor patient survival. These claims are reported, for example, in studies by Gaillard et al., in which they monitored the incidence of leakage after sleeve gastrectomy using pre-operative detection of sarcopenic obesity.[29] Berkel et al. reported a significant relationship between sarcopenic obesity and post-operative complications in patients after chemoradiotherapy and after resections for rectal cancer.[8] Miyamoto et al. confirmed the predictive value of sarcopenia in patients treated for colorectal cancer.[30] These patients had worse prognosis, shorter recurrence-free survival, and overall survival. Sarcopenia was also identified as an independent predictive factor for the development of complications in patients undergoing resection for colorectal cancer by Nakanishi et al.[31]
Thanks to the latest revised recommendations for the diagnosis of sarcopenia, we know that the decline in muscle strength is more important for clinical practice than changes in muscle volume and structure detectable by imaging examination. Thus, CT and MRI remain mainly a research tool, given their availability, radiation burden in the case of CT and higher cost in the case of MRI.[10] The studies performed often present conflicting results using different methodologies and examining several variants of muscle groups, which introduces a number of uncertainties into this issue.
For example, Chai et al. analyzed a group of 228 colorectal cancer patients using TAMA to measure sarcopenia.[4] As a result, sarcopenia was considered as a predictive factor for major complications in patients with colorectal cancer and for any complications in patients with rectal cancer. Benedek et al., in their prospective study of 51 patients with colorectal cancer, used PMA measurement and its conversion to PMI, which correlated with the incidence of post-operative complications.[17] In this study, PMD was also measured but without clinically significant impact. Similar results were also presented by Wu et al. using data from 228 patients who underwent emergent laparotomy.[12] In this study, PMI was monitored, which again was significantly correlated with morbidity, and also PMD, which, in contrast, was not found to be a significant parameter for predicting post-operative complications. Using data from 350 colorectal cancer patients undergoing resection, Richards et al. concluded that sarcopenia, as measured by PMI, was associated with an increased risk of post-operative complications, longer hospital stay and higher mortality.[32] A similar study but without PMD measurements was conducted by Jones et al., who identified PMI in 100 patients operated for colorectal cancer as a tool to predict major post-operative complications.[33]
However, some recent studies contradict these claims. Pekarova et al. analyzed 118 patients with colorectal cancer after resection procedures.[18] TAMA and PMA were monitored and had no correlation with the development of major post-operative complications. In contrast, PMD showed a strong correlation in both patients after colon and rectal resection. These results were also supported by Cuijpers et al., who, in an analysis of 238 patients undergoing surgical treatment for colorectal cancer, concluded that low pre-operative PMD was associated with an increased incidence of major post-operative complications.[19] Blackwell et al. used PMD to determine myosteatosis in 1122 patients undergoing elective colorectal surgeries.[34] Based on their results, they found that myosteatosis was not predictive of major complications, although it appeared to be a predictive factor for the incidence of AL. Xiao et al. demonstrated in an analysis of 191 patients over 65 years of age that TAMA and PMA did not correlate with the development of major post-operative complications; in contrast, PMD was strongly predictive.[20]
Our study does not support the hypothesis of a correlation of PMI or PMD with the risk of developing major post-operative complications according to Clavien-Dindo. In terms of predicting the development of post-operative complications alone, PMD appeared to be borderline significant. Based on our results, we cannot say with certainty whether these values can be used as a predictive tool for the development of complications after rectal resections. However, it can be said that PMD is the most promising of the screening options, although further efforts are needed to implement it in clinical practice.
Why do our results differ from those of most authors? One factor may be the use of CT scans with contrast agent. While some of the studies compared so far have used a native scan without contrast agent,[7,18,20] we have also come across studies that have used a contrast scan.[19,34] According to the work of Rollins et al., significant differences can be observed in the measurement of muscle density between the different phases of the examination.[35] They reported a difference of up to 18% between the native and contrast scan in the venous phase. Van Vugt et al., in another paper, highlighted a significant difference in muscle density results when using contrast and non-contrast CT scans, but this did not affect the measured muscle area.[36] Based on their results, they recommended the standard use of contrast scans in the venous phase. However, our measured values are very close to those reported by Herrod et al. and Pekarova et al.[7,18] The results of Xiao et al. differ slightly more, but we explain this difference by the fact that the measurements were performed on a sample of the Asian population.[20] The difference in PMD values alone in these studies between the group with and without complications is only a few units of HU. Despite being reported as statistically significant, this difference is so small in clinical use and thus not applicable as a tool without clearly defined cutoff values. In addition to the differences in scan phases, the study also speaks to the dependence of the software used to evaluate them. According to Rollins et al., who tested four muscle parameters using two different software, the results were statistically significantly different in all parameters studied.[37] This fact was confirmed by van Vugt et al. and Teigen et al.[38,39]
Another reason for the difference between the results of our work and the work of other authors seems to be the lack of consistency in the concept of how to approach the measurement itself. Most current studies performed measurements at the L3 level, where both transverse processes were visible.[7,18-20,34] Wu et al.,[12] like us, used data from the L3 level of the inferior endplate, which are well documented by Simpson et al.[40,41] in patients undergoing emergent laparotomy. Another important issue in the case of PMD assessment is the potential of the surrounding tissue to influence the outcome when drawing the muscle boundary. This problem was solved by Pekarova et al. by shifting the area of selection 3 mm centrally from the measured muscle border when measuring PMD.[18]
In addition, the choice of muscle model, which for most studies has been the psoas muscle, is also diverging. According to the work of Shen et al. and Mourtzakis et al., the volume of muscle tissue at the L3 level correlated linearly with the state of all muscle mass in the body.[14,15] This hypothesis was also confirmed by Rollins et al., who, further, investigated whether the psoas muscle can be used as a separate model correlating with the state of muscle tissue at the L3 level.[42] In her work, PMA correlated with TAMA (SMA), although PMD had higher values on average, thus underestimating the incidence of myosteatosis. Thus, due to its simple and rapid measurability, the psoas muscle has become a simplified model for predicting post-operative outcomes, despite the fact that this muscle is easily affected by catabolism in inactivity, as well as in degenerative diseases and spinal fractures.[16] As a major hip flexor, a decrease in hip strength is also a sign of decreased functional capacity and is associated with an increased risk of falls and other complications, as also noted by Looijaard et al.[43] Rutten et al., in their work in patients with ovarian cancer, found that PMA did not have the same predictive power as SMA (TAMA) and, therefore, did not recommend its simplified use.[16] Rather, the current consensus is that muscle area measurements (either PMA or SMA) do not correlate with post-operative morbidity.[18,20,43]
Overall, there are few studies attempting to map the condition of muscle tissue in a large cohort of patients undergoing CT scans. Therefore, cutoff values corresponding to the results of population-based studies are not available. An attempt in this direction is at least the work of Hamaguchi et al., who analyzed data in 541 healthy adult donors for living donor liver transplantation (LDLT).[44] They used CT scan to analyze PMI at the L3 level and thus determined cutoff values for males and females, moreover in different age groups of the Asian population. In other work, Lawlor et al. looked at psoas muscle values in healthy young Americans aged 19–40 years.[45] In this work, they established cutoff values for both PMI and PMD in both sexes. De Marco et al. analyzed data from 390 patients with benign complaints who were referred to the emergency department and had no major comorbidities.[46] The study population ranged in age from 20 to 80 years and both PMA and PMD were analyzed. The expected outcome was differences according to gender and age. The data obtained allowed to establish population cutoff values; however, the disadvantage of this study is that the measurement was performed at L4 level, when all other studies use L3 level. Abbass et al. analyzed data from 1002 patients undergoing resection procedures for colorectal cancer.[47] In this study, the authors established a cutoff for their population, although stratification by age and sex was not performed. In contrast, Bahat et al., in their unicentric study including 601 patients screened as LDLT, established cutoff values for PMI and SMI at the L3 level for the Turkish population.[48] In his conclusion, he also emphasizes the need for further validation of the results by means of further studies. Martin et al. identified cutoff values for myosteatosis in 1473 lung and gastrointestinal cancer patients with a history of weight loss that correlated with patient survival.[49] These values were subsequently stratified for population use based on BMI and have provided the basis for several authors to compare post-operative outcomes and survival in colorectal cancer patients.[50-52]
Many questions also arise with regard to the selection of the patient population. In our case, we selectively included patients with rectal tumors only, that is, up to 15 cm from the anal verge. However, most of the compared studies included patients with colon and rectal tumors together and did not take into account the specificity of rectal cancer with regard to its anatomical and pathophysiological differences.[7,17,34,47] As confirmed by Tamas et al., the treatment strategy for this disease is different and the surgical procedure is more technically demanding.[53]
The higher incidence of AL (24.76%) in our cohort of patients is only relative, mainly due to our proactive approach when searching for this complication. All patients undergoing rectal resection are having endoscopic control of the anastomosis 5–10. POD, which allows us to detect type A AL at an increased rate, leading to a bias in the result compared to other studies. Depending on the operative diagnosis, the reported incidence of AL is between 3% and 20%, but this is the incidence of symptomatic AL.[54-56] If we exclude type A AL from our cohort, we reach a similar result, namely, 16%.
CONCLUSIONThe overall risk of lower rectal resection is increased in the context of development of post-operative complications. The importance of PMI measurement for predicting the development of these complications has not been confirmed, the determination of PMD values is at the very limit of statistical significance. Further, efforts in this field will be needed to achieve standardization of the measurement method and to establish cutoff values valid for European population. In the light of comparison with other presented studies, we were also able to justify the importance of the NPV of CRP levels (3. and 5. POD) on the prediction of AL development and to confirm comparable cutoff values using ROC analysis.
留言 (0)