
記住我


The UKB study is a population-based cohort of around half a million participants from the UK aged between 40 and 59 years who were recruited between 2006 and 2010 (baseline assessment). Deep phenotype and genetic data are available for participants, including blood and urine biomarkers, whole-body imaging, lifestyle indicators, physical and anthropometric measurements, genome-wide genotyping, exome and genome sequencing. Follow-up is currently ongoing, and participants are further linked to routinely collected EHRs. Detailed information is available at https://biobank.ndph.ox.ac.uk/showcase/.
Proteomic profiling was performed in EDTA-plasma samples from ~54,000 UKB participants as part of the UKB-PPP. Details of the sample selection and sample handling have been described previously40. Briefly, the study design included three elements: (1) a randomized subset of 46,595 individuals; (2) 6,356 individuals selected by the UKB-PPP consortium members (‘consortium selected’), in which proteomic profiling was done on samples from the baseline assessment and (3) 1,268 individuals who participated in a COVID-19 imaging study with repeated imaging at several visits.
We carried out a cohort study in the UKB-PPP to develop, validate and compare predictive models with and without proteins. While the randomized subset was representative of the entire UKB population, ‘consortium selected’ participants had different baseline characteristics for common risk factors (on average older, higher BMI and more smokers) and were enriched in cases for 122 different diseases40. Therefore, we based analyses on individuals from the randomized subset excluding those with missing data for age, sex and BMI, or who failed quality control (QC) criteria for proteomic measurements (N = 41,931). For 25 less frequent diseases we further included incident cases occurring within the ‘consortium-selected’ participants (Supplementary Table 1). UKB has approval from the North West Multi-Centre Research Ethics Committee as a Research tissue biobank (REC reference 11/NW/0382). Participants provided written informed consent.
Clinical risk informationClinical risk information (without blood assays) recommended as part of usual primary care, was obtained from UKB health questionnaires. This included: age at baseline, self-reported ethnicity, smoking status, alcohol consumption, paternal or maternal history for 15 individual diseases available (datafield IDs 20197 and 20110; Supplementary Table 1), and measured BMI. We further included 37 of the most widely performed blood assays (16 of these are based on proteins), which were assessed in all UKB participants. These included 28 blood assays (UKB Category 17518) and 9 blood cell traits (UKB Category 100081) (leukocyte, lymphocyte, monocyte, neutrophil, eosinophil, basophil, platelet count, hemoglobin concentration and hematocrit percentage), and refer to these 37 blood-based tests41 (Supplementary Table 8) as clinical assays. Estrogen and rheumatoid factor were not included in the analyses given these had more than 50% of missing values. For the n = 9 blood cell traits, we excluded blood cell measures from individuals with extreme values or relevant medical conditions as described previously42. Relevant medical conditions for exclusion included pregnancy at the time the complete blood count was performed, congenital or hereditary anemia, HIV, end-stage kidney disease, cirrhosis, blood cancer, BM transplant and splenectomy. Extreme measures were defined as leukocyte count >200 × 109 l−1 or >100 × 109 l−1 with 5% immature reticulocytes, hemoglobin concentration >20 g dl−1, hematocrit >60%, and platelet count >1,000 × 109 l−1. Quality control of these ‘clinical assays’ was done based on methods previously described41,42.
Proteomic profilingProteomic profiling was performed in EDTA-plasma samples from ~54,000 UKB participants obtained at baseline as part of the UKB-PPP, using the Olink Explore 1536 and Explore Expansion platforms, which captured 2,923 unique proteins targeted by 2,941 assays. Assay details have been described previously40,43,44, including comparisons with seven overlapping clinical assays measured in UKB, yielding strong correlations for matching isoforms (r = 0.82)40. Briefly, Olink relies on proximity extension assays, which targets proteins by pairs of antibodies conjugated to complimentary oligonucleotides. Upon binding to their target protein, hybridization between probes enables amplification and subsequent relative quantification through next generation sequencing. Protein targeting assays are grouped across four 384-plex panels: inflammation, oncology, cardiometabolic and neurology. Olink’s internal controls involve an incubation (a nonhuman antigen with matching antibodies), extension (IgG conjugated with a matching oligonucleotide pair) and amplification controls (synthetic double-stranded DNA). Additional external controls are included in each plate, namely negative, plate and sample controls. Limit of detection values are calculated for each protein targeting assay per plate based on negative controls run in triplicate. Normalized protein expression (NPX) values are generated by normalization to the extension control, log2 transformation and further normalization to the plate controls. Samples are flagged with a warning if NPX values from internal controls are not within ±0.3 NPX from the plate median across an abundance block, or if the mean assay count for a sample is less than 500. Assays are flagged with a warning if the median from the negative control triplicated deviate more than 5 s.d. from predefined values set by Olink. We excluded (1) participants that were removed from the study and (2) samples that were defined as outliers. Outliers included individuals for which standardized first or second principal component values were further than 5 s.d. from the mean or had a median NPX or IQR of NPX greater than 5 s.d. for the mean median or mean IQR. Individual datapoints with sample or assay warnings, or those belonging to 70 plates that failed to satisfy QC criteria were set to missing.
Incident disease definitionsWe developed prediction models for 218 diseases, with more than 80 incident cases within 10 years of follow-up (censoring date was the 31 December 2020 or death date if this occurred first) in the random subset (N = 41,931, 193 diseases), or by including incident cases within the ‘consortium-selected’ subset (25 diseases) (Supplementary Table 1). The 218 diseases include common and rare diseases, and diseases associated with high morbidity, high mortality or both. Disease definitions were based on validated phenotypes described by Kuan et al.14 by integrating data from primary care available only for a subset of participants (that is, not using any primary care data made available solely for COVID research), hospital episode statistics, cancer and death registries and from UKB health questionnaires, including self-reported illnesses. We excluded prevalent cases (first occurrence before or up to the baseline assessment visit) or incident cases recorded within the first 6 months of follow-up. We note that we did not exclude ‘controls’ (that is, individuals that did not develop the disease under study) with other prevalent conditions. This represents the scenario that is closest to the clinical reality were multimorbidity is increasingly common and the most useful prediction models will be those that can discriminate the outcome of interest in the presence of other underlying diseases or conditions.
We performed a sensitivity analysis for 19 of the 25 diseases, for which incident cases among consortium-selected participants were included. For these 19 diseases, there were at least 60 incident cases within the random subset of UKB-PPP, enabling demonstrating good agreement in predictive performance from the main analyses and by excluding consortium-selected incident cases from the test set (Pearson r = 0.97). This showed no strong bias introduced from inclusion of participants who were selected based on specific characteristics or genetic risk of specific diseases.
Protein and biomarker imputationAfter quality control, we imputed missing NPX values, using the missForest R package45, for all individuals from the randomized or consortium-selected subsets who met the QC and inclusion criteria, had no missing data for age, sex and BMI, and had no more than 50% of missing values across all proteins (N = 48,054; 41,931 from the randomized subset and 6,123 from ‘consortium-selected’ cases; Supplementary Table 2). Imputation was done per panel (that is, separately for Cardiovascular, Cardiovascular II, Inflammation, Inflammation II, Neurology, Neurology II, Oncology and Oncology II panels), including additional information on age and sex. Subsampling (that is, without replacement) was used to grow the number of trees in each forest, which, in turn, was set to 50 (‘ntree’ parameter). As a sensitivity analysis, we tested all optimized models in individuals from the validation set that had no missing values (for the proteins from the final model) to assess the quality of the imputation procedure. We observed good agreement between performance metrics derived in the test set, which included a small proportion of imputed protein values and those derived from individuals with no missing data (Pearson r = 0.94).
We further imputed missing values for clinical assays (UKB Category 17518) and nine blood cell traits (leukocyte, lymphocyte, monocyte, neutrophil, eosinophil, basophil, platelet count, hemoglobin concentration and hematocrit percentage) in the individuals who also had clinical assays available (N = 47,901).
Statistical analysesWe adapted a three-step machine learning framework including (1) feature selection, (2) hyperparameter tuning and optimization and (3) validation. Individuals were grouped as follows: 50% for feature selection, 25% for model optimization (training), and 25% for validation, for diseases with more than 800 cases; otherwise, into a 70% feature selection and model optimization set and 30% for validation. Validation sets included nonoverlapping individuals completely blinded to previous model development stages.
We used regularized Cox regression to derive a ‘benchmark’ clinical model, by fivefold crossvalidation in the optimization or training set using the features described above. Validation was performed in the held-out test set, where we computed the C-index over 1,000 bootstrap samples.
For each disease, we performed feature selection among 2,941 protein targets, or among the 37 clinical assays by least absolute shrinkage and selection operator (LASSO) regression over 200 subsamples of the feature selection set. While six proteins were measured across four Olink panels, we included all measurements, albeit for the same protein. This was to enable data-driven selection of the best performing set of measurements given our machine learning framework will shrink coefficients to zero for strongly correlated variables. This also allowed for previously proposed biomarkers to compete with all available proteins in a data-driven framework. In each iteration, we ran fivefold crossvalidation over three repeats using a grid search to tune the hyperparameter lambda, implemented with the caret R package. We used the ROSE R package46 to address case imbalance. Selection scores were computed as the absolute sum of weights from the model with the optimal lambda from each of the 200 iterations and were used to identify the top 20 proteins or clinical assays. The top 20 proteins or clinical assays with the highest feature selection scores were taken forward for optimization of a regularized Cox model including the clinical risk factors, by fivefold crossvalidation (optimization set, or feature selection set for diseases with fewer than 800 cases), implemented through the glmnet R package. To further identify sparser predictor sets, the top five and top ten features were identified as those with the highest product of the weights from optimized models (clinical risk factors + top 20 features) and feature selection scores. Optimization of a clinical model plus five or ten features was similarly done by regularized Cox regression by fivefold crossvalidation (optimization set). Performance was tested in the validation set, by computing the C-index over 1,000 bootstrap samples. Finally, models based on the top five proteins alone (without any clinical risk factors) were further trained and tested in the same manner.
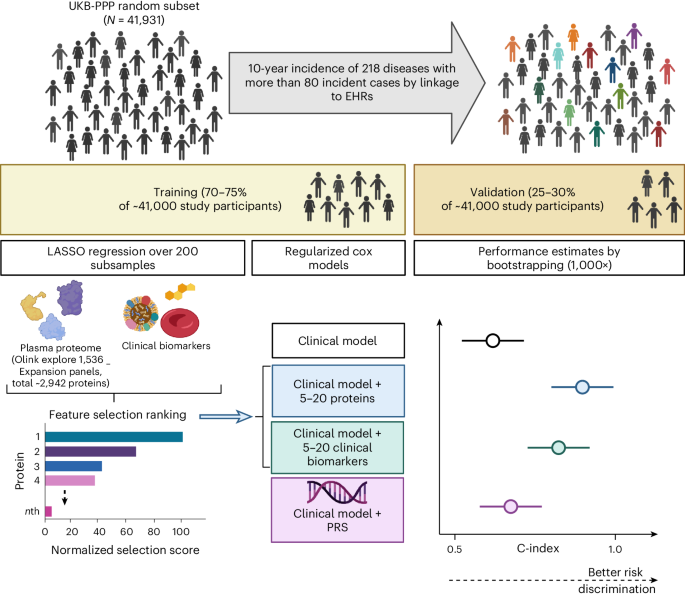
We tested improvement in models by adding onto the clinical ‘benchmark’ model: (1) 5–20 proteins, (2) 5–20 clinical assays or (3) genome-wide PGSs37 (UKB category 301) (Fig. 1). For these comparisons, we kept the best performing protein signature and clinical assay signature as the one that had the highest C-index in the validation set. Significant improvements between models were considered as those for which the 95% CI of the differences in the bootstrap C-index distributions did not include zero.
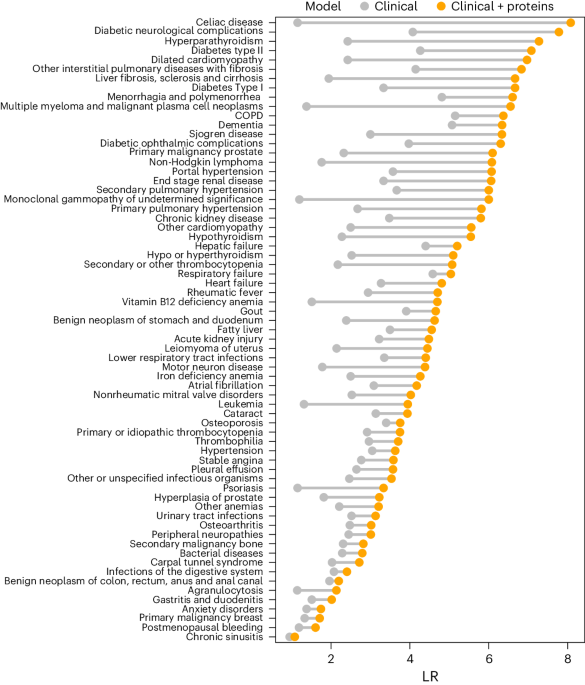
We calculated the following screening metrics: DRs and LRs in the validation set at FPR ranging from 5% to 40%. The FPR was calculated as FPR = false positives (FP)/(true negatives (TN) + FP); and detection rates were calculated as DR = true positives (TP)/(false negatives (FN) + TP). LRs were computed as LR = DR/FPR. All analyses were performed in R software v.4.1.1.
We calculated category-free net reclassification improvements from addition of proteins to the clinical models using a 0.15 cut-off in risk difference to provide more conservative estimates, using the R package nricens. We further calculated integrated discrimination improvements from addition of proteins to the clinical models using the R package survIDINRI.
Age- and sex-stratified performance of prediction modelsThe performance of the clinical and clinical + protein models was tested by stratifying the validation set by sex (men versus women) and age at onset (<65 years versus ≥65 years at disease onset). We retained only 121 and 134 diseases for which sex-stratified and age-stratified validation sets had at least 20 incident disease cases, respectively. We computed the C-index over 1,000 bootstrap samples of the stratified validation sets. Significant differences between age- or sex-stratified performance were considered as those for which the 95% CI of the differences in the bootstrap C-index distributions did not include zero. Similarly, significant differences between stratified performance of protein-informed models and clinical models were considered as those for which the 95% CI of the differences in the bootstrap C-index distributions did not include zero.
Performance of prediction models for 5-year incidenceThe performance of the clinical and clinical + protein models trained to predict the risk of 10-year incidence, was tested for 5-year incidence (same validation sets). This was tested for diseases for which 10-year incidence prediction (C-index) was significantly improved or improved by more than 4%, and had at least 20 incident cases within 5 years of follow-up in the validation set (54 diseases).
Predictive performance of the Olink Explore 1536 versus Expansion panelsWe further repeated the entire procedure (that is, feature selection, model optimization and testing) on the first subset of Olink Explore 1536 proteins, using the exact same data splits for comparability (that is, the same individuals used in this analysis as those used in training/testing for the main analyses done on 1536 + Expansion proteins).
Downsampling sensitivity analysisWe performed an additional analysis to rule out the possibility that a statistical artifact could lead to the observed inverse relationship between incident case numbers and the improvement in C-index achieved by proteins. We used hypertension (the disease with the highest number of incident cases) as an example to run this sensitivity analysis, in which we restricted selection of the number of incident cases to 80, 100, 150, 250, 500, 1,000 and 2,000. We repeated the entire framework, including, feature selection, model optimization and validation, in these different configurations including fewer incident cases. We showed there was no inflation in the improvements in C-index achieved by adding proteins onto the clinical model, when restricting the analyses to fewer incident cases (Supplementary Table 13).
Proportion of variance explained in protein plasma levelsWe used the variancePartition R package47 to estimate the proportion of variance explained in plasma levels of each of the proteins by a joint model including age, sex, BMI, smoking status and the Elixhauser comorbidity index48 as explanatory variables. Briefly, this method fits a linear mixed model and estimates the proportion of variance explained attributed to each of the explanatory variables. We used this framework to identify the main correlates for each of the five proteins. We compared the proportion of variance explained by each of the variables for these five proteins with the average proportion of variance explained across all other proteins.
Tissue mapping of proteinsTo understand the possible tissue origin of plasma proteins, we programmatically downloaded tissue- and cell-type specificity data from the Human Protein Atlas (HPA)49 for the Olink proteins in JSON format (on 30 December 2022).
Before joining HPA data with Olink data, we split Olink IDs corresponding to several proteins (protein complexes) into their components based on ENSEMBL gene IDs. Nine proteins (AKR7L, ANP32C, BTNL10, FHIP2A, HCG22, KIR2DL2, KIR2DS4, LILRA3, PNLIPRP2) assayed by Olink were not found on HPA, and NTproBNP was assigned to NPPB, leaving 2,918 unique protein targets.
To determine whether proteins that HPA reports as tissue specific were enriched among selected protein candidates, we performed a two-sided Fisher’s exact test for each tissue-specificity, with the number of selected/nonselected and specific/nonspecific proteins. We defined tissue specific as ‘enhanced,’ or ‘enriched’ according to HPA classification. Some proteins were hence ‘specific’ to several tissues.
Pathway enrichmentWe performed pathway enrichment analysis using the R package gprofiler2 (v.0.2.1)50 restricting to KEGG and REACTOME database to maintain specificity. We used all protein coding genes covered by the Olink Explore platform as a background and tested for enrichment of (1) selected protein candidates per disease and (2) proteins selected for at least three diseases. We used the Benjamini–Hochberg (BH) procedure to account for multiple testing.
MM scRNA-seq analysesThe scRNA-seq data including UMAP representation, cell-type annotation and plasma cell malignancy classification via inferCNV was taken from ref. 16. Differential gene expression between BM cell types and healthy versus malignant states was investigated by comparing the mean expression levels of the gene of interest per patient or control using Wilcoxon rank sum test. BH was used to adjust for multiple comparisons.
External validationTo provide evidence of generalizability of the models developed in UKB, we tested performance of the clinical and protein-informed models in the EPIC-Norfolk study. The EPIC-Norfolk study is a cohort of 25,639 middle-aged individuals from the general population of Norfolk—a county in Eastern England51. The study was approved by the Norfolk Research Ethics Committee (reference no. 05/Q0101/191). Participants provided written informed consent.
Participants from the EPIC-Norfolk study51 were flagged for mortality at the UK Office of National Statistics and vital status was ascertained for the entire cohort. Death certificates, hospitalization data and cancer registry data was obtained using National Health Service (NHS) numbers through linkage with the NHS digital database. EHRs were coded by trained nosologists according to the International Statistical Classification of Diseases and Related Health Problems, ninth (ICD-9) or tenth Revision (ICD-10). Participants were identified as having experienced an event if the corresponding ICD-10 code was registered on the death certificate (as the underlying cause of death or as a contributing factor), cancer registry or as the cause of hospitalization. Given that the long-term follow-up of EPIC-Norfolk included the ICD-9 and ICD-10 coding system, codes were consolidated.
Serum samples from the baseline assessment (1993–1997) that had been stored in liquid nitrogen were used for proteomic profiling of a randomly selected subcohort (N = 749; Supplementary Table 14) and a T2D case-cohort study (N = 1,173; Supplementary Table 14), using the Olink Explore 1536 and Olink Explore Expansion panels, targeting 2,923 unique proteins by 2,941 assays. Participants were excluded due to failed proteomic QC, missing information on age, sex, BMI or smoking status.
Out of the 67 diseases for which proteins improved prediction over and above the clinical benchmark in UKB, we were able to test model replication in the EPIC-Norfolk study for T2D (in the T2D case-cohort), prostate cancer, heart failure, COPD, chronic kidney disease and cataracts (in the random subcohort) (Supplementary Tables 14 and 15). Because family history of the disease was not available in EPIC-Norfolk, we trained models in UKB without this variable. We used the weights from the models trained in UKB to evaluate their performance in EPIC-Norfolk. While the models developed in UKB were trained for prediction of 10-year incidence, we tested predictive performance for 10-year and 20-year incidence in EPIC-Norfolk given the low sample size and design of this study. We excluded prevalent cases (for the disease being tested) and incident cases occurring within the first 6 months of follow-up. Performance was tested in EPIC-Norfolk, by computing the C-index over 1,000 bootstrap samples. As in UKB, significant improvements between models were considered as those for which the 95% CI of the differences in the bootstrap C-index distributions did not include zero.
Reporting summaryFurther information on research design is available in the Nature Portfolio Reporting Summary linked to this article.
留言 (0)