
記住我


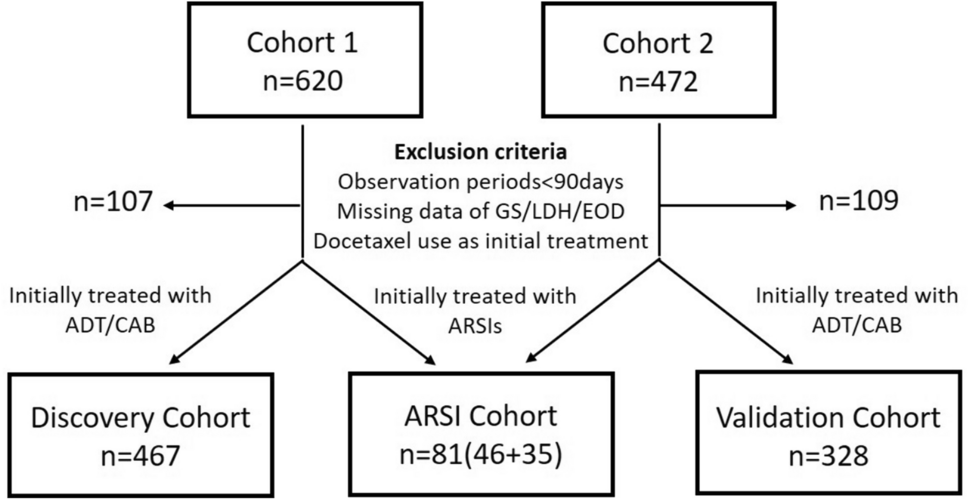


Table 1 presents the characteristics of the patients included in the Discovery, Validation, and ARSI cohorts. The patients’ backgrounds in the Discovery and Validation cohorts were generally similar. Over 90% of the patients had an International Society of Urological Pathology (ISUP) Grade Group of ≥ 4. and there were more patients with primary Gleason pattern of 5 in the Validation cohort than in the Discovery cohort (21.2% vs. 26.5%, p = 0.089). There were more patients with bone metastases of EOD ≥ 2 in the Validation cohort (47.1% vs. 55.5%, p = 0.021). Patients in the ARSI cohort showed higher initial PSA levels and EOD scores, and there were more patients with primary Gleason pattern of 5 and visceral metastasis compared to the Discovery and Validation cohorts. In Japan, abiraterone for high-risk mHSPC was covered by public insurance in 2016. Therefore, the most common ARSI used was abiraterone (90.1%).
Table 1 Characteristics of the study populationCreation of the CSS prognostic modelIn the Discovery cohort, the median follow-up time was 37.8 months (IQR, 23.2–52.7), during which 126 (27.0%) patients died of PCa, and 318 (68.1%) were diagnosed with CRPC. Although the original Kyoto model was created to predict the OS, in the present study, we focused on the CSS to better represent the characteristics of PCa. In the Cox proportional hazards model analysis, the C-statistic for predicting the 5-year CSS was 0.690 when the original Kyoto model was applied to the Discovery cohort. In the Discovery cohort, univariate and multivariable analyses of various clinical parameters showed that in addition to the clinical variables used to create the original Kyoto model, serum albumin levels at diagnosis were significantly associated with the CSS (Table 2). The cutoff for albumin level was determined to be 3.7 g/dl using time-dependent receiver operating characteristics analysis (Figure S1). Because of the small number of patients with liver metastases at diagnosis (n = 16) was clearly smaller than the number of patients having other risks, we decided to group EOD ≥ 2 and liver metastases together in terms of metastatic volume. These two factors were shown to have similar hazards ratio for OS in our previous study establishing the original Kyoto model. Cox proportional hazards model analysis showed that an initial albumin level ≤ 3.7 g/dl was independently associated with the CSS, along with the other prognostic factors used to create the original Kyoto model (Table 3). The C-index for predicting the 5-year CSS was 0.73 for the Discovery cohort. Comparing the performance of the original Kyoto model with the novel model incorporating serum albumin levels in their ability to predict the 5-year CSS, the predictability of the novel model was significantly improved with a continuous NRI of 0.37 (IQR, 0.24–0.51; p < 0.0001) and IDI of 0.08 (IQR, 0.03–0.16; p < 0.0001) (Table 4).
Table 2 Univariable and multivariable Cox regression analyses for the prediction of CSS in the Discovery cohortTable 3 Multivariable Cox regression analyses for the prediction of CSS in the Discovery cohortTable 4 Evaluation of the predictive ability of CSS in the original Kyoto model and the Modified Kyoto modelNext, we assigned one point to each of the four risk factors and calculated the hazard ratio for each risk score (Fig. 2A). The patients were classified into three risk groups according to the total score: 0 points for the low-risk group, 1–2 points for the intermediate-risk group, and 3–4 points for the high-risk group (Modified Kyoto model). According to the model, the number of patients in the high-, intermediate-, and low-risk groups was 77 (17.3%), 218 (49.0%), and 150 (33.7%), respectively. There was a significant difference in the CSS between the risk groups (Fig. 2B). The median CSS for the high- and intermediate-risk groups was 29.9 months (IQR, 21.1–43.2) and 73.6 months (IQR, 63.7–Not Evaluable [NE]), respectively, and was not reached for the low-risk group (p < 0.001). For each risk group, we also examined the differences in the time to CRPC as well the CSS after becoming castration-resistant. The median times to CRPC in the high-, intermediate-, and low-risk groups were 7.4, 16, and 45 months, respectively (p < 0.001, Fig. 2C). The high-risk group not only had a shorter time to CRPC but also had a significantly worse CSS after castration resistance (median, 20.1 months; IQR, 12.6–26.0) than the non-high-risk groups (p < 0.001, Fig. 2D).
Fig. 2
A Risk stratification based on the distribution of the predicted hazard ratios. Each combination of risk factors (x-axis) was scored according to the regression coefficients from the multivariable Cox regression model (Table 2). The y-axis shows the hazard ratio calculated for each combination. Kaplan–Meier curves for the CSS (B), time to CRPC (C), and CSS after castration resistance (D) according to the risk stratification
Validation of the novel prognostic modelIn the Validation cohort, the median follow-up time was 41.3 months (IQR, 25.1–59.3), during which 77 (23.5%) patients died of prostate cancer, and 194 (59.1%) were diagnosed with CRPC. The Cox proportional hazards model analysis showed that an initial albumin level ≤ 3.7 g/dl was also significantly associated with the CSS (Table 5). Moreover, the risk model incorporating the albumin level showed high reproducibility in the Validation cohort; the C-statistics for predicting the 5-year CSS was 0.76.
Table 5 Multivariable Cox regression analyses for the prediction of CSS in the Validation cohortAccording to the Modified Kyoto model, the number of patients in the high-, intermediate-, and low-risk groups was 45 (14.5%), 171 (55.0%), and 95 (30.5%), respectively. The median CSS for the high-risk group was 30.9 months (IQR, 25.8–NE) and was not reached for the intermediate- and low-risk groups (p < 0.001, Fig. 3A). Similar to the Discovery cohort, there were significant differences in the time to CRPC and the CSS after castration resistance between the risk groups (Fig. 3B, C).
Fig. 3
Kaplan–Meier curves for CSS (A), Time to CRPC (B) and CSS after castration resistance (C) according to the risk stratification in the Validation cohort
Reclassification of the LATITUDE risk groups by the novel prognostic modelNext, we examined whether the Modified Kyoto model could further stratify the LATITUDE high- and low-risk groups. Approximately 22.6, 65.8, and 11.6% of the patients in the Validation cohort defined as high-risk by the LATITUDE criteria were grouped into high-, intermediate-, and low-risk groups by the Modified Kyoto model, respectively (Table 6). The prognosis of each group was also clearly stratified, and median CSS was 29.9 and 71.4 months in the high- and intermediate-risk groups, respectively, and was not reached in the low-risk group (p < 0.001, Fig. 4).
Table 6 Stratification of LATITUDE high and low risk groups by the Modified Kyoto modelFig. 4
Kaplan–Meier curves for the CSS after reclassification of the LATITUDE high-risk patients by the Modified Kyoto model in the Validation cohort
Validation in the ARSI cohortIn the ARSI cohort, the median follow-up time was 31.8 months (IQR, 17.3–40.6). According to the Modified Kyoto model, the number of patients in the high-, intermediate-, and low-risk groups was 18, 50, and 7, respectively. During the follow-up time, 5(62.5%), 11(22.0%) and 0 patients died of prostate cancer, and 12(66.7%), 16(32.0%) and 1(14.3%) were diagnosed with CRPC. High-risk group had a significantly shorter time to CRPC than the intermediate-risk group (NE vs. 14.3, p < 0.001), however, CSS after castration resistance was similar (20.4 vs. 23.2, p = 0.577). (Fig. 5) Median CSS was not reached in either group during the follow-up.
Fig. 5
Kaplan–Meier curves for the time to CRPC (A) and CSS after castration resistance (B) of the intermediate- and high-risk patients in the ARSI cohort
留言 (0)