
記住我
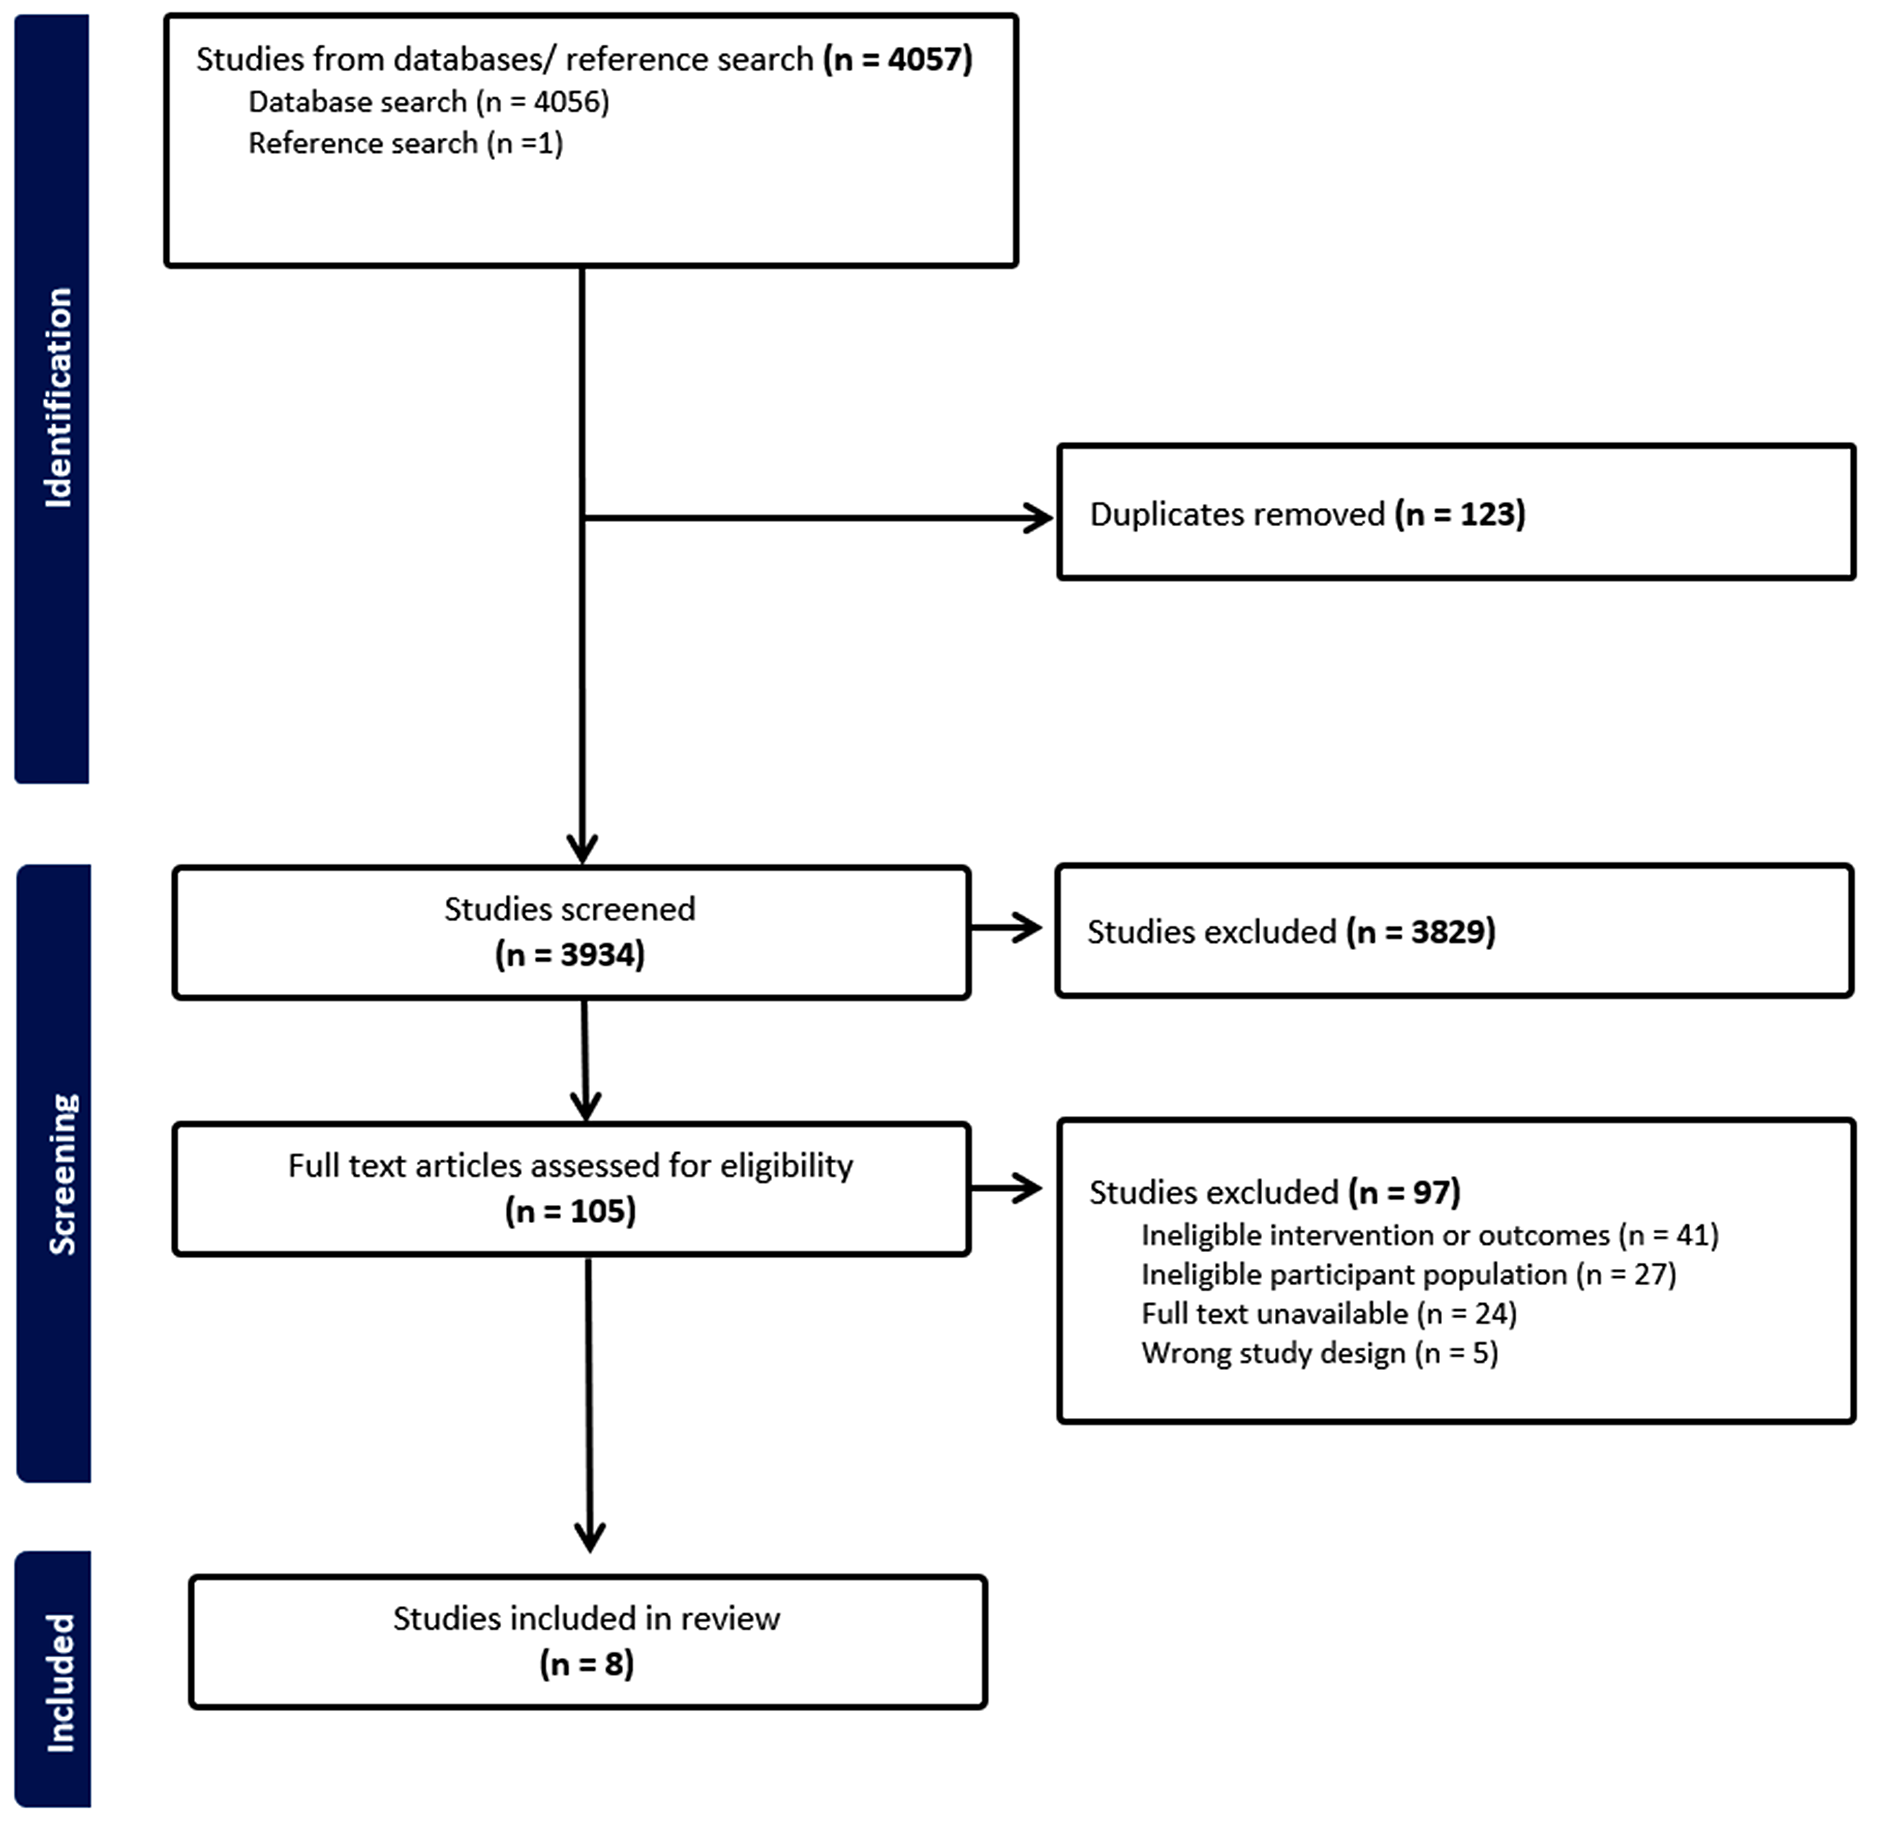


Out of a total of 4,739 studies retrieved through database searching, 86 were eligible for a full-text review. Thirty-three studies in total, 30 studies [33,34,35,36,37,38,39,40,41,42,43,44,45,46,47,48,49,50,51,52,53,54,55,56,57,58,59,60,61,62] from database searching and three studies [63,64,65] from other sources, qualified for inclusion in this study (Fig. 3). The studies that were excluded during the full-text review are provided in the supplementary file (Table S3).
Fig. 3
PRISMA flow diagram showing the study selection process
Characteristics of the Included StudiesThe majority of studies were published in 2023 (n = 16/33; 48.5%) and originated from the United States (n = 13/32; 40.6%; one study did not report the country). Approximately, 39.4% (n = 13/33) of the studies used a sample size of 10,000 or more. Two studies focused exclusively on one gender (one on men and the other on women), whilst the majority of studies analysing both genders had a higher percentage of women (50% and above) (Table S4).
Follow-up Time and Incidence of Cardiovascular DiseasesThe mean or median follow-up time ranges from 4.4 years to 25.03 years in studies of community-dwelling people, and 4.3 months to 8.05 years in studies of institutionalised-people (Table S4). Various CVD outcomes, with their definitions and corresponding ICD codes detailed in Table S4, were identified (Fig. 4). The incidence of CVD outcomes ranged from 2.1% (CVD-related mortality) to 43.7% (MACE) (Table S4).
Fig. 4
Number of studies based on predicted cardiovascular diseases outcomes. ASCVD: Atherosclerotic cardiovascular disease; CHD: Coronary heart disease; CVD: Cardiovascular disease; HF: Heart failure; and MACE; Major adverse cardiovascular events. Note: Since one study can incorporate more than one outcome, the sum total reported here exceeds the total number of included studies
Model Related CharacteristicsEmployed ML and DL ModelsEight ML and nine DL models were utilised, with Fig. 5 presenting the names of each model and the number of studies that employed them, and Table S5 providing further details.
Fig. 5
Identified ML and DL models. Since a single study could utilise multiple ML and/or DL models, the total number of studies presented here exceeds 33 (the total number of studies included)
Best Performing ML and DL ModelsTo evaluate the predictive performance, studies utilised C-index, area under the curve (AUC), and Brier score or calibration plot. In addition, some studies also explored other measures such as decision curve analysis. These performance evaluation metrics are presented in Table S5. The mean C-index (standard deviation) was 0.79 (0.069) for ML models, 0.82 (0.061) for DL models, 0.81 (0.144) for Penalised Cox, 0.80 (0.058) for RSF, 0.79 (0.032) for DeepSurv, and 0.77 (0.055) for survival Gradient Boosting Models (GBM) (Table 3).
Table 3 Descriptive statistics of predictive performance (C-index/area under the curve) by ML and DL algorithmsEight studies only used one ML [35, 37, 39, 41, 47, 50, 57, 58] and four studies only used one DL [34, 36, 43, 59] algorithm to predict CVD. The 26 studies [33,34,35,36,37, 39,40,41,42,43,44,45,46, 48, 49, 52,53,54,55,56,57, 59, 62,63,64,65] that compared ML and DL models with the Cox PH model revealed that ML and DL models were better in predicting CVD. Nine studies [33, 38, 51,52,53, 55, 60, 62, 65] among 18 studies [33, 38, 42, 44, 46, 48, 49, 51,52,53,54,55, 60,61,62,63,64,65] that compared the RSF with other models, selected RSF as the best performing model. Six studies [35, 37, 39, 41, 50, 57] used RSF without comparison with other ML or DL models. Among the seven studies [38, 44, 55, 56, 63,64,65] that compared the survival GBM with other models, the boosting models were better in two studies [56, 64]. In another two studies [47, 58], the boosting method was used to predict CVD without comparing with other models. All of the five studies [38, 44, 45, 56, 63] that evaluated Elastic Net Cox compared the model with other models, and in the two studies [45, 63] Elastic Net Cox was the best performing model for CVD prediction. In the nine studies [
留言 (0)