
記住我
A total of 203 gastric mucosa samples from 70 volunteers were ultimately included in the present study after screening. The baseline clinical characteristics of the mucosa samples from the gastric horn, antrum, and body are shown in Supplementary Table 1. The experimental flow chart is shown in Fig. 1. A few confounders of microbiota analyses, such as patient sex (p = 0.235), in various stomach microhabitats were not significantly different (Supplementary Table 1). However, there was a significant difference in age (p = 0.0141) among patients with different clinical symptoms, and the average age of patients in the gastric carcinoma group was significantly older, which was consistent with previous research. The collected samples were subjected to next-generation high-throughput sequencing. A total of 12,421,783 high-quality reads were obtained via amplicon sequencing, and an average of 54,722 reads per mucosa sample were used for subsequent taxonomic annotation. The species accumulation curves of the OTUs (Supplementary Fig. 1a) in all the samples and the rarefaction curves of the observed species (Supplementary Fig. 1b) in the different groups confirmed that the number of samples collected in the present study was sufficient, indicating that the obtained taxonomic annotation information represented the majority of the identifiable bacteria present in the gastric mucosa. The Venn diagram (Supplementary Fig. 2) indicated common and unique OTUs, with 230 OTUs in the PSG group, 847 OTUs in the PAG group, 11 OTUs in the PP group, and 16 OTUs in the PC group. The PSG and PC groups shared 255 taxa. Moreover, the Venn diagram based on OTUs also showed that there were 773 OTUs in the NSG group, 805 OTUs in the NAG group, 28 OTUs in the NP group, and 4 OTUs in the NC group. The NSG and NC groups shared 269 OTUs. To reveal these differences, multiple α diversity indices were calculated for each sample, and statistical analyses were performed for different groups (Fig. 2, Supplementary Table 2). The Shannon index significantly increased in patients with GC and H. pylori infection (Hp+ group), while in the Hp− group, low species richness and low abundance of OTUs were observed in the tumoral microhabitats. Species evenness, such as the Simpson index, decreased in the Hp+ group with tumours, while in the Hp− group, the Simpson index increased. To further investigate whether H. pylori colonization alters the community structure of the gastric microbiota in different pathological states, the α diversity of the gastric microbiota was compared in patients with histopathological Hp+ and Hp− strains. Mucosa-associated microbiota in different H. pylori statuses showed differences in composition and structure (Fig. 2c, d). Notably, the present data demonstrated that H. pylori abundance was negatively correlated with the Shannon index, especially in the gastritis microhabitats (Supplementary Fig. 3), which confirmed the crucial role of H. pylori in the community diversity of the intragastric microhabitats.
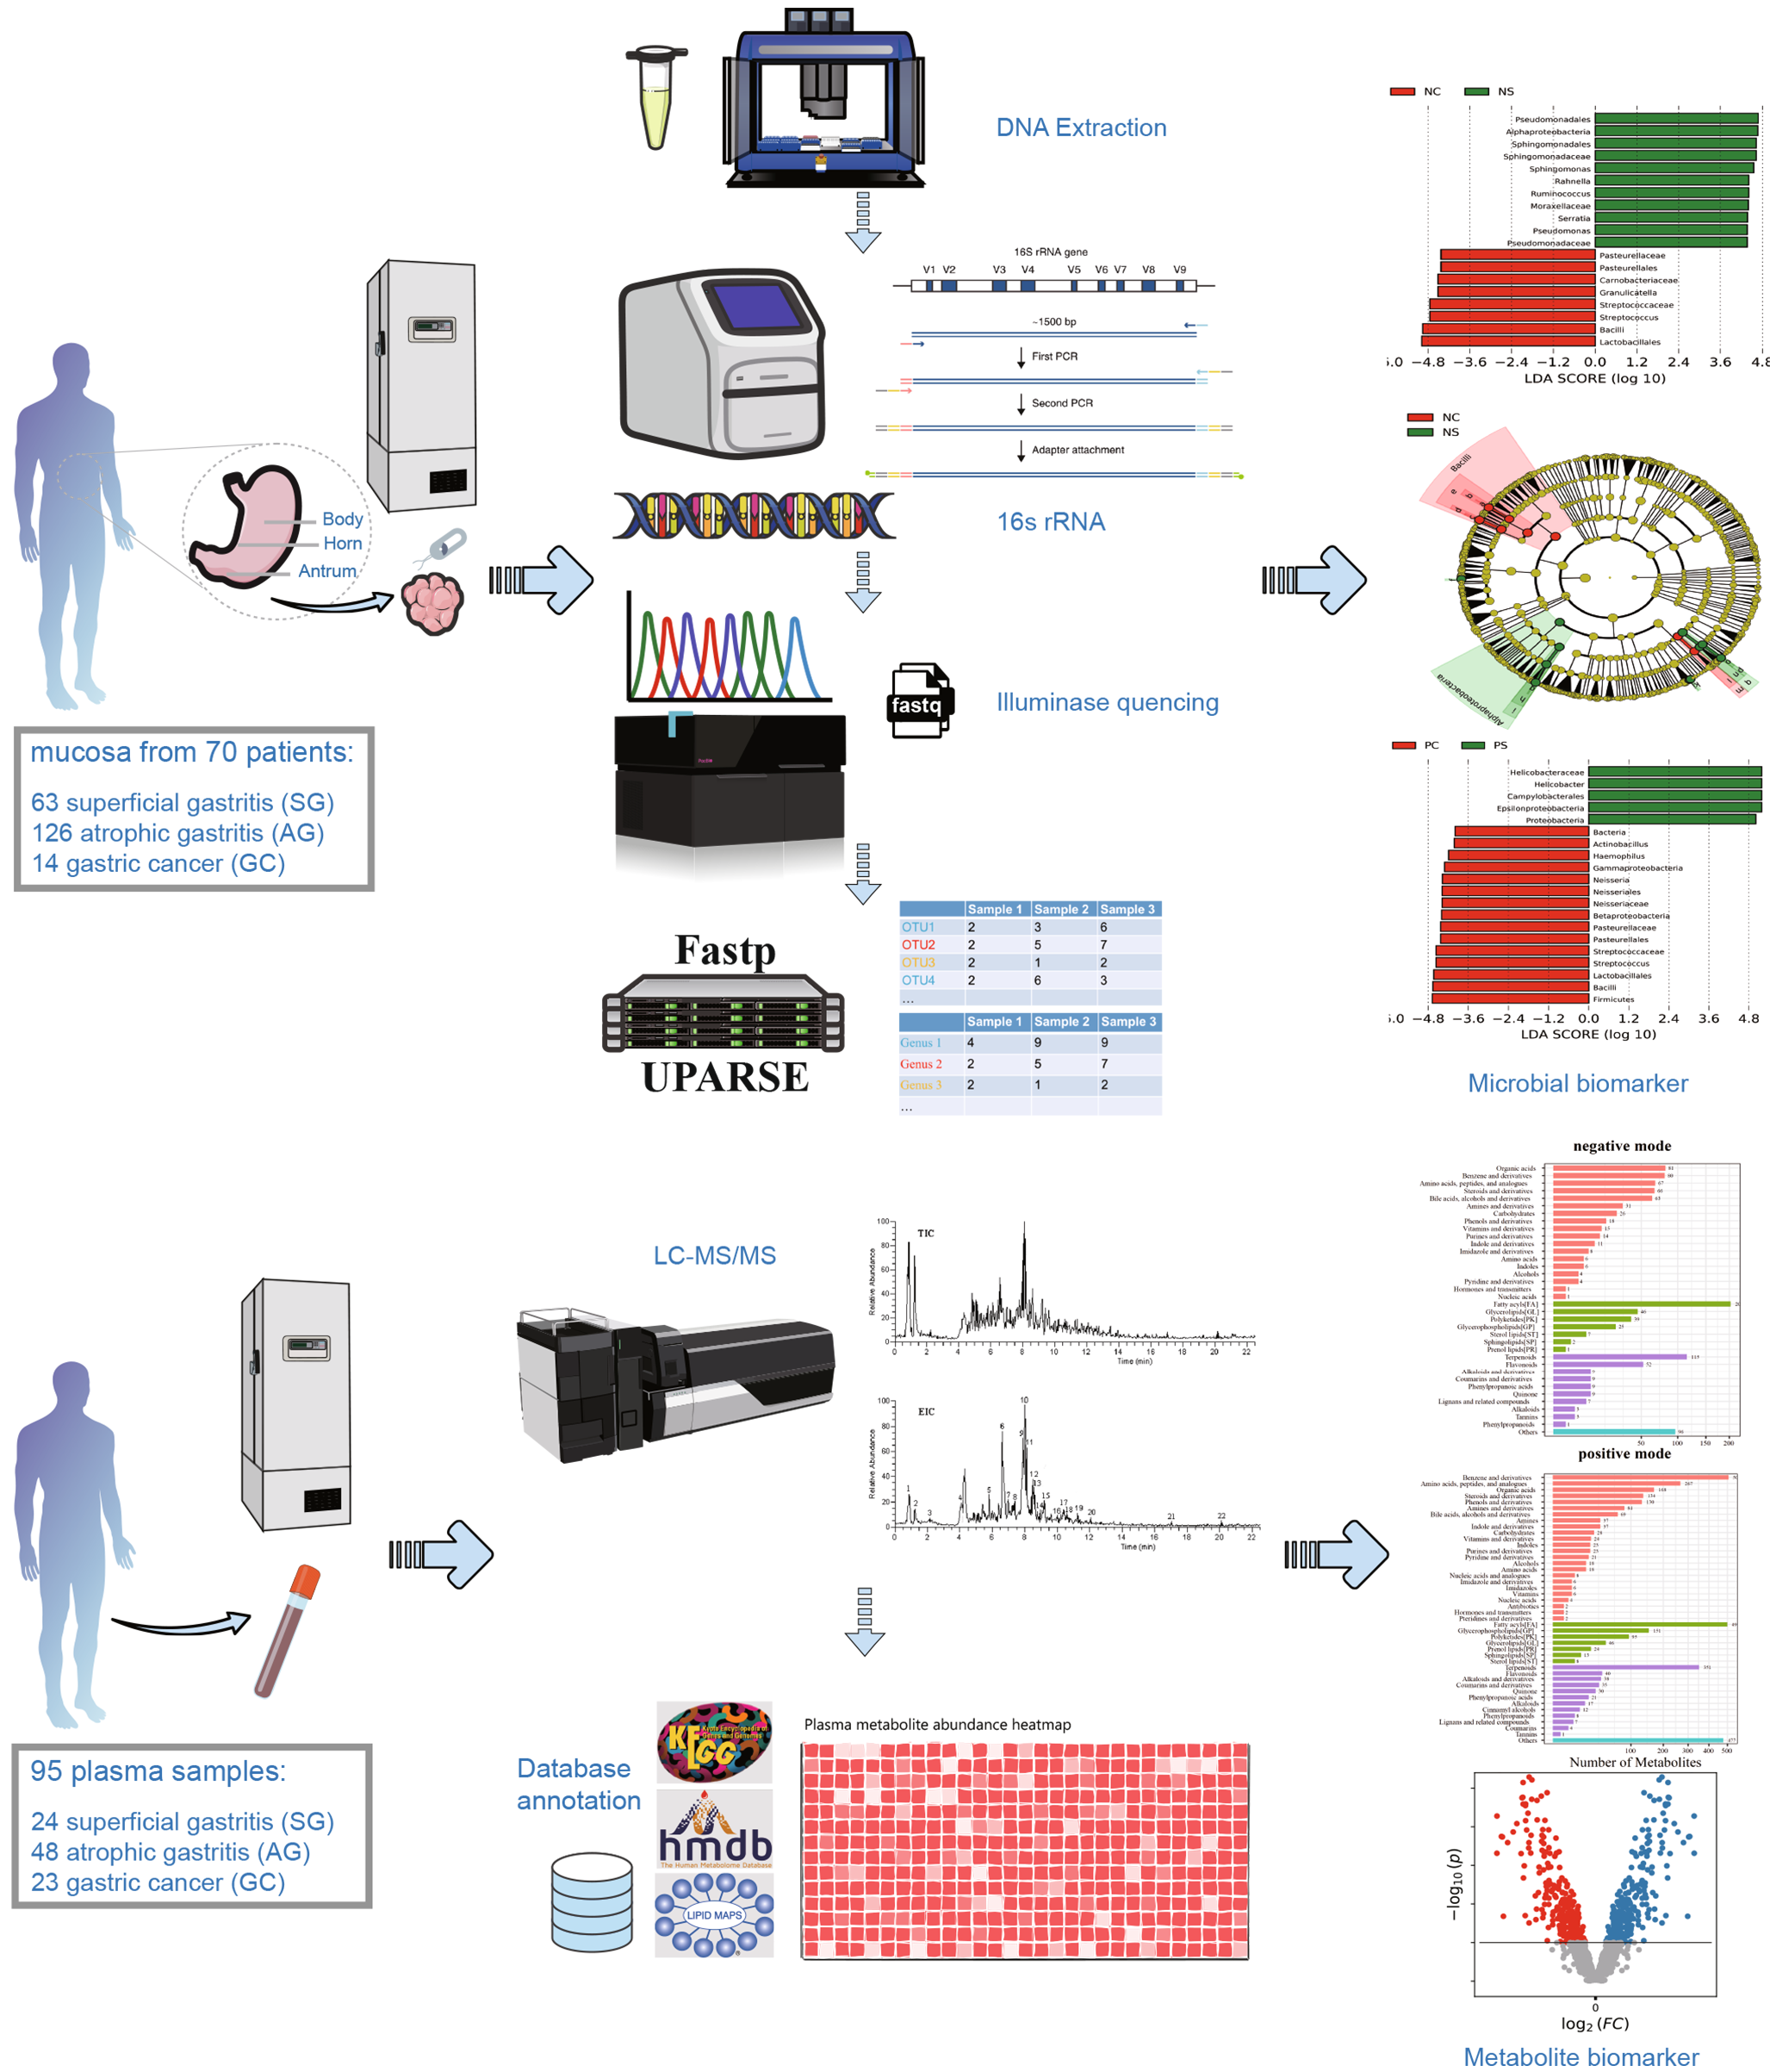
Fig. 1
Summary of the study design and experimental flowchart. Sample collection and processing strategy for the microbiome and metabolome analyses.
Fig. 2
Shannon indices of the gastric microbiota under different pathological conditions in the H. pylori− group (a) and H. pylori+ group (b). Comparison of the Shannon (c) and Simpson (d) diversity indices of H. pylori infection in different stomach microhabitats. SG superficial gastritis, AG atrophic gastritis, C carcinoma. e PCoA clustering of H. pylori-positive and H. pylori-negative samples. f NMDS analysis of H. pylori-positive and H. pylori-negative samples. ANOSIM analysis of parameter results. N: H. pylori-negative, P: H. pylori-positive.
To explore whether the colonization of H. pylori differed among the various groups, the β diversity was calculated using the weighted (quantitative) Bray‒Curtis distance computing method (Fig. 2e). PCoA1 and PCoA2 divided all samples into two clusters between the Hp+ and Hp− groups under pathological conditions of superficial gastritis, atrophic gastritis, and tumoral microbiota. Moreover, nonmetric multidimensional scaling (NMDS) also revealed that H. pylori colonization distinguished between the Hp+ and Hp− groups (Fig. 2f, stress = 0.187). A subsequent ANOSIM analysis revealed that there was a significant between-group difference (Fig. 2f, R2 = 0.685, p = 0.001).
Taken together, the α- and β-diversity analyses indicated that the community structure in patients with gastritis was altered compared to patients with gastric cancer, and multiple diversity indices were significantly different between patients with and without H. pylori infection. The present data demonstrated that in all H. pylori-positive samples, the relative abundance of H. pylori showed a significant negative correlation with the Shannon index, which confirmed that H. pylori infection may be one of the main factors affecting the structure of the bacterial community in the stomach.
3.2 Microbial dysbiosis is associated with gastric carcinomaTo further investigate the taxonomic differences of bacteria in the stomach based on the stage of gastric cancer development, the bacterial annotation information was identified for the stomach microhabitats of superficial gastritis (SG), atrophic gastritis (AG), and gastric carcinoma (GC) patients. At the phylum level, the relative abundances of Firmicutes, Bacteroidetes, Proteobacteria, Actinobacteria, and Fusobacteria were dominant (Fig. 3a, Supplementary Table 3). Although the relative abundances of these phyla were dominant in the three groups, the abundance of Proteobacteria gradually decreased, while that of Firmicutes and Bacteroidetes gradually increased during the development of gastritis and gastric cancer.
Fig. 3
Taxonomic composition of different stomach microhabitats and H. pylori infection status at the (a) phylum and (b) genus levels. Differences in the relative abundances of the 15 most abundant genera at different pathological stages in the (c) Hp− group and (d) Hp+ group. ROC analysis verified the feasibility of these bacterial genera as biomarkers in the Hp− group (e) and Hp+ group (f). SG: superficial gastritis, AG: atrophic gastritis, C: carcinoma. N: H. pylori negative, P: H. pylori positive. *p < 0.05 between SG and C; §p < 0.05 between SG and AG; and ┼p < 0.05 between AG and C.
At the genus level, Helicobacter, Streptococcus, Prevotella, and Neisseria abundances were significantly different across all groups. Notably, the relative abundances of Streptococcus, Prevotella, and Granulicatella significantly increased from the SG and AG groups to the GC group in the Hp−gastric mucosa microhabitat, while the relative abundances of Thermus, Citrobacter, and Sphingomonas decreased (Fig. 3b). Compared to the SG and AG microbiota, the relative abundances ofPrevotella and Haemophilus were significantly increased in the GC microbiota, while the relative abundances of Faecalibacterium and Roseburia were decreased in the Hp+ gastric mucosa microhabitat in the GC group compared to the SG group (Fig. 3c, d). The genus Prevotella significantly colonized the GC microhabitat without H. pylori, while Oribacterium was significantly more abundant in the GC microhabitat with H. pylori (Fig. 3c, d). In contrast to previous reports, the present bacterial annotation data indicated that Lactobacillus was enriched in the GC microhabitat without H. pylori (Supplementary Fig. 4a). Moreover, the present data confirmed that the relative abundance of Helicobacter was substantially decreased during cancer development (Supplementary Fig. 4b). Overall, these results showed that the microbial community structure in the stomach is significantly different between patients with gastritis and patients with GC with or without H. pylori infection, as reflected by significant changes in the relative abundances of dominant taxa and specific low-abundance taxa.
Next, 2,330 OTUs were selected to calculate the mean value in the SG group, and the microbial dysbiosis index (MDI) was calculated across all samples. For the Hp− samples, the MDI was higher in the GC group compared to the SG group. (p < 0.05; Supplementary Fig. 5). In contrast, for Hp− patients, a significantly higher MDI was observed in the SG group (p < 0.05). This result indicated that the decrease in the MDI was caused by a decrease in the relative abundance of H. pylori, which is consistent with the reduced bacterial diversity in Hp+ patients with SG. In conclusion, the MDI showed an opposite trend between groups with or without H. pylori infection.
To explore which taxa contribute more to the three state classifications, LEfSe analysis was performed, and differential taxa were screened among the three patient groups. Pairwise analyses were performed to obtain the LDA scores and P values of all taxa (Supplementary Tables 4, 5, 6 and 7), and the top 20 taxa were selected for visualization (Supplementary Fig. 6). In Hp− patients, Sphingomonas, Rahnella, Pseudomonas, Roseburia, and Akkermansia were significantly enriched in the SG group, while Rothia, Actinocatenispora, Porphyromonas, and Bacillus were enriched in the GC group (Supplementary Fig. 6a). In Hp+ patients, Helicobacter, Ruminococcus, Blautia, Faecalibacterium, and Bacteroides were significantly enriched in the SG group, while Streptococcus, Neisseria, Haemophilus, and Veillonella (Supplementary Fig. 6b) were enriched in the GC group, most of which were potentially pathogenic bacteria in humans and/or animals.
To verify whether the obtained taxa could be used as biomarkers for gastric carcinoma diagnosis, receiver operating characteristic (ROC) curve analysis was performed (Fig. 3e, f). The predictive ability of several genera was assessed using the relative abundances of Fusobacterium, Lactobacillus, Leptotrichia, Prevotella, Streptococcus, and Veillonella in the GC group without H. pylori, as well as Campylobacter, Helicobacter, Oribacterium, and Rothia in the GC group with H. pylori. The abundance of these bacterial genera showed good sensitivity with a high area under the curve (AUC) value (AUC > 0.6).
The present study also explored the discrepancies in gastric microbial communities among the horn, antrum, and body under different disease conditions (SG vs. GC) and H. pylori infections. Generally, the bacterial diversity among the three groups was significantly greater in the Hp− group at the same anatomical location (Supplementary Fig. 7d). Despite the anatomical location, there was no significant difference in the stomach microbiota among the horn, antrum, and body at the same H. pylori status (Supplementary Fig. 7). PCA showed that the samples of the three groups could not be clustered well in the GC group with or without H. pylori (Supplementary Fig. 7b). Taken together, wegastric bacterial communities are similar among the three anatomical locations but that the diversity of the microbiota in cancer tissues is significantly different from that in gastric body, horn, and antrum mucosa samples.
3.3 Interactions between community membersThe differences in the relative abundances of microbiota in the stomach are the result of the interactions and dynamic balance of species in the community. To assess the correlations between species in stomach flora, Spearman’s correlation analysis with Benjamini-Hochberg(BH) adjustments was conducted to calculate interaction matrices based on several top relative abundances of species in all samples (Supplementary Tables 8 and 9), and the results were visualized using Cytoscape software (Fig. 4). Because a previous study [15, 17, 19] has indicated that the colonization of H. pylori has a significant influence on the gastric bacterial community, the patients were divided into two groups, namely, the H. pylori-infected group and the uninfected group, for the co-occurrence network analysis in the present study.
Fig. 4
Spearman’s correlation network in the Hp− group (a) and Hp+ group (b). The node area represents the relative abundance of the species. The thickness of the edge indicates the correlation coefficient. Red indicates a positive correlation, and blue indicates a negative correlation.
In the Hp+ group (Fig. 4a), there was a significant inverse correlation between the relative abundance of Helicobacter and that of Streptococcus, Prevotella, Neisseria, and Haemophilus. Moreover, the relative abundance of Helicobacter, such as Faecalibacterium, Ruminococcus, and Roseburia, was negatively correlated with probiotic populations. These genera, such as Faecalibacterium, Acinetobacter, and Roseburia, formed a bacterial cluster with strong positive correlations among their internal members.
In the Hp− group (Fig. 4b), Escherichia, which had a high relative abundance, was inversely correlated with Streptococcus, Prevotella, and Veillonella. Additionally, Streptococcus and Rahnella abundances showed a strong negative correlation. These genera showed mainly positive correlations within a bacterial cluster. Similar to those in the Hp+ group, the abundances of the genera Faecalibacterium, Ruminococcus, and Roseburia in the gastritis microbiota of the Hp− group were strongly positively correlated.
3.4 Inferred functional changes and the predicted bacterial metabolic contributionBased on the matrix of bacterial abundances obtained from 16S rRNA amplicon sequencing, the functional abundances (COG and KO) of the gastric bacterial communities from each sample were predicted using PICRUSt2 based on the OTU table. Two databases, namely, COG and KEGG, were used to predict the gene functions of the gastric flora (Supplementary Tables 10 and 11), and the results were visualized by STAMP. All differential analyses were corrected by BH adjustment.
In the present study, H. pylori colonization was significantly different between the Hp+ and Hp−groups of the SG, AG, and GC patients for the following COG categories: ribosomal structure and biogenesis; cell wall/membrane/envelope biogenesis; replication; recombination; and repair, (Supplementary Fig. 8). These pathways are generally associated with bacterial cell proliferation and DNA damage repair, suggesting that H. pylori may have a high survival ability in the gastric environment and that H. pylori colonization may have a wide impact on the proliferation and DNA repair of the gastric microbiota. In particular, several predicted pathways are relevant to bacterial carbohydrate transport and metabolism, and these metabolic reactions have a critical function in the production of short-chain fatty acids (SCFAs). These pathways were enriched in the Hp− group, suggesting that H. pylori colonization may inhibit short-chain fatty acid-related functional pathways.
Two functional genes, namely, urease and nitrate reductase, were selected to explore differences in the abundance of genes related to different clinical symptoms and H. pylori status (Fig. 5). H. pylori neutralizes hydrogen ions around its own cells through ammonia produced by urea decomposition of urease, reducing the acidity of the overall colonization environment, allowing H. pylori to survive and colonize the stomach cavity. Consistent with the results of the species composition analysis, multiple KOs associated with urease expression were predicted to increase significantly in the Hp+ group (Fig. 5a). In addition, nitrate reductase-associated KOs were significantly enriched in the GC group (Fig. 5b).
Fig. 5
The gastric carcinoma microbiota was characterized by urease and nitrosating bacteria. Functional classification of the predicted metagenome content of the microbiota in chronic gastritis and gastric carcinoma using COG and KO. a Differences in predicted urease-producing functions in different groups. b Differences in predicted nitrate reductase-producing functions in different groups.
3.5 Analysis of differential metabolites and pathways in the SG and GC groupsA total of 95 plasma samples and 18 QC samples were analysed by LC‒MS/MS via positive (ESI+) and negative ion (ESI−) modes to improve the coverage of metabolites. The data quality was evaluated through the repeatability of QC sample testing. The base peak chromatograms (BPCs) of the QC samples overlapped well, indicating that the instrument was in a normal state and that the signal was stable throughout the entire process of sample detection and analysis. The percentages of RSD ≤ 30% ion number in the QC samples to total ion number were 94.84 and 94.41% in the ESI+ and ESI− modes, respectively. The spectra and ratios demonstrated that the data were of good quality.
After preprocessing, 9,371 and 3,480 peaks were detected in the ESI+ and ESI− modes, respectively. Qualitative identification was then performed using publicly available and self-built databases, such as HMDB, KEGG, the BGI Library, and mzCloud (Supplementary Tables 12 and 13). In total, 3,763 metabolites in the ESI+ mode and 1,226 metabolites in the ESI− mode were identified and used for subsequent statistical tests (Supplementary Table 14). To adjust the plasma metabolites of extremely high and low concentrations, which may produce systematic differences in subsequent statistical analysis, a quantile normalization of the metabolite characterization table was conducted. All identified metabolites were classified into three categories as follows: compounds with biological roles (the largest number of metabolites in this classification were organic acids in ESI− and benzene and derivatives in ESI+); phytochemical compounds (the largest number of metabolites were terpenoids in both modes); and lipids (the largest number of metabolites were fatty acyls in both modes) (Supplementary Fig. 9). Additionally, all these metabolites were identified in the KEGG pathway and classified into six level 1 pathways (such as metabolism and human diseases) with a few level 2 subclasses (Supplementary Fig. 9). In conclusion, these classifications and identifications revealed the overall profile of the metabolites detected in the metabolome.
To explore the differences in the metabolite profiles and search for differentially abundant metabolites with potential effects, heatmap analysis with clustering was performed to evaluate the differences in the metabolite profiles between the two groups, and the Wilcoxon test was used to screen all the metabolites to construct a heatmap (p < 0.05). These metabolites were significantly different between the two groups, and had a distinction of colors in the heat map, which differed between the SG and GC groups (Fig. 6a). Moreover, a score plot of the sPLS-DA model was construct, and a heatmap analysis with clustering was performed. The sPLS-DA plot showed a significant separation in all samples between the SG and GC groups, demonstrating the differences in metabolic profiles between the two groups (Fig. 6b). Therefore, these findings indicated that the heatmaps and sPLS-DA models were sufficient to characterize the profile of plasma metabolites and to verify the apparent separation between the SG and GC groups.
Fig. 6
Plasma metabolomics for quantification of metabolites in the gastritis and GC groups. a Heatmap of SG and GC samples. Metabolites were clustered and sorted according to p value from small to large. b sPLS-DA score plot of SG and GC samples.
Specific differentially abundant metabolites between the SG and GC groups were further explored. Based on the HMDB, the identified metabolites in the two modes were combined (a total of 1,545), and fold change calculations and Wilcoxon tests were performed. FC values and P values were obtained (Supplementary Table 15) and visualized with a volcano plot (FC > 1.5 or < 0.67 and p < 0.05 were used as the filtering conditions) (Fig. 7a). In total, 81 differentially abundant metabolites were upregulated in the GC group, including metanephrine, 2-methoxyestradiol, equol, 2-indolecarboxylic acid, and alpha-N-phenylacetyl-L-glutamine, whereas 86 differentially abundant metabolites were downregulated in the GC group, including 8,9-DiHETrE, leukotriene B4, prostaglandin J2, 15(S)-HETE, and 15(S)-hydroxyeicosatrienoic acid. Moreover, metabolic pathway enrichment analysis of differentially abundant metabolites was performed based on the SMPDB, which revealed that a few metabolic pathways (p < 0.05) were significantly enriched (Fig. 7b), such as phenylacetate metabolism, pyrimidine metabolism, and folate metabolism.
Fig. 7
Identification of the differential plasma metabolites and significantly changed metabolites between the SG and GC groups. a Volcano plot of the SG and GC groups. Red represented upregulation in the GC group, and blue represented downregulation in the GC group. Grey indicated no significant difference. FC > 1.5, p < 0.05. b Pathway enrichment analysis of the SG and GC groups. c ROC curve analysis verified the feasibility of multiple differentially abundant metabolites as biomarkers between the SG and GC groups. SG: superficial gastritis, GC: gastric carcinoma.
To verify whether the obtained differentially abundant metabolites could be used as markers to distinguish SG from GC in clinical diagnosis, six differentially abundant metabolites with potential predictive ability were selected for receiver operating characteristic (ROC) curve analysis based on p values and FC values. By calculating the integral area of the curve, the differentially abundant metabolites with an AUC value > 0.7 were considered candidate markers (Fig. 7c). The AUC values showed that prostaglandin J2 and 2-methoxyestrone efficiently distinguished GC patients from SG patients.
3.6 Analysis of differential metabolites and pathways in the NAG and PAG groupsAtrophic gastritis is a common condition with multiple pathogenic factors, and it exhibits no significant specificity in clinical patients. However, atrophic gastritis has potential to develop into intestinal metaplasia or precancerous lesions. Globally, H. pylori infection is common in the atrophic gastritis stage due to its potential cytotoxicity and genotoxicity. To investigate whether colonization by H. pylori had a significant effect on the plasma metabolite profile, the same data preprocessing and statistical analysis were performed in the NAG and PAG groups.
Heatmap analysis with clustering was performed to evaluate the differences in metabolite profiles between the two groups, and the Wilcoxon test was used to screen all the metabolites to construct a heatmap (p < 0.05), which demonstrated that these metabolites were significantly different between the two groups (Fig. 8a). A score plot of the sPLS-DA model was conducted, a heatmap analysis with clustering was performed. The sPLS-DA plot showed a significant separation in all samples between the NAG and PAG groups, demonstrating the differences in metabolic profiles between the two groups. (Fig. 8b). The metabolites were clustered into three clusters, and two of them had different “heat” colours between the NAG and PAG groups. Therefore, these results indicated that heatmaps and the sPLS-DA model were also sufficient for characterizing the profiles of plasma metabolites and confirming the apparent differences between the NAG and PAG groups.
Fig. 8
Plasma metabolomics for the quantification of metabolites in the Hp− and Hp+ groups. a Heatmap of NAG and PAG samples. Metabolites were clustered and sorted according to p value from small to large. b sPLS-DA score plot of NAG and PAG samples.
Based on the HMDB, the identified metabolites in the two modes were combined (a total of 1545), and fold change calculations and Wilcoxon tests were performed. The FC and P values were obtained (Supplementary Table 16) and visualized with a volcano plot (FC > 1.5 or < 0.67 and p < 0.05 were used as the filtering conditions) (Fig. 9a). Overall, 15 differentially abundant metabolites, such as N-acetylserotonin, uric acid, imidazoleacetic acid, phenylethylamine, and indoleacrylic acid, were upregulated in the PAG group, while 13 differentially abundant metabolites, such as chorismate, oleanolic acid, melanin, and 3,4-dihydroxyphenylglycol, were downregulated in the PAG group. In addition, metabolic pathway enrichment analysis of differentially abundant metabolites was performed based on SMPDB, and a few metabolic pathways (p < 0.05) were significantly enriched (Fig. 9b), such as ammonia recycling, beta-alanine metabolism, and folate metabolism.
Fig. 9
Identification of the differential plasma metabolites and significantly changed metabolites between the NAG and PAG groups. a Volcano plot of the NAG and PAG groups. Red represents upregulation in the PAG group, and blue represents downregulation in the PAG group. Grey indicates no significant difference; FC > 1.5, p < 0.05. b Pathway enrichment analysis of the NAG and PAG groups. c ROC curve analysis verified the feasibility of multiple differentially abundant metabolites as biomarkers between the NAG and PAG groups. NAG: atrophic gastritis with H. pylori negative, PAG: atrophic gastritis with H. pylori positive.
Furthermore, six differentially abundant metabolites with potential predictive ability were selected for receiver operating characteristic (ROC) curve analysis based on p values and FC values. By calculating the integral area of the curve, the differentially abundant metabolites with an AUC value > 0.7 were considered candidate markers (Fig. 9c). The curves indicated that N-acetylserotonin and chorismate efficiently distinguished the PAG and NAG groups.
留言 (0)