5.1 The cancer genome atlas (TCGA) database
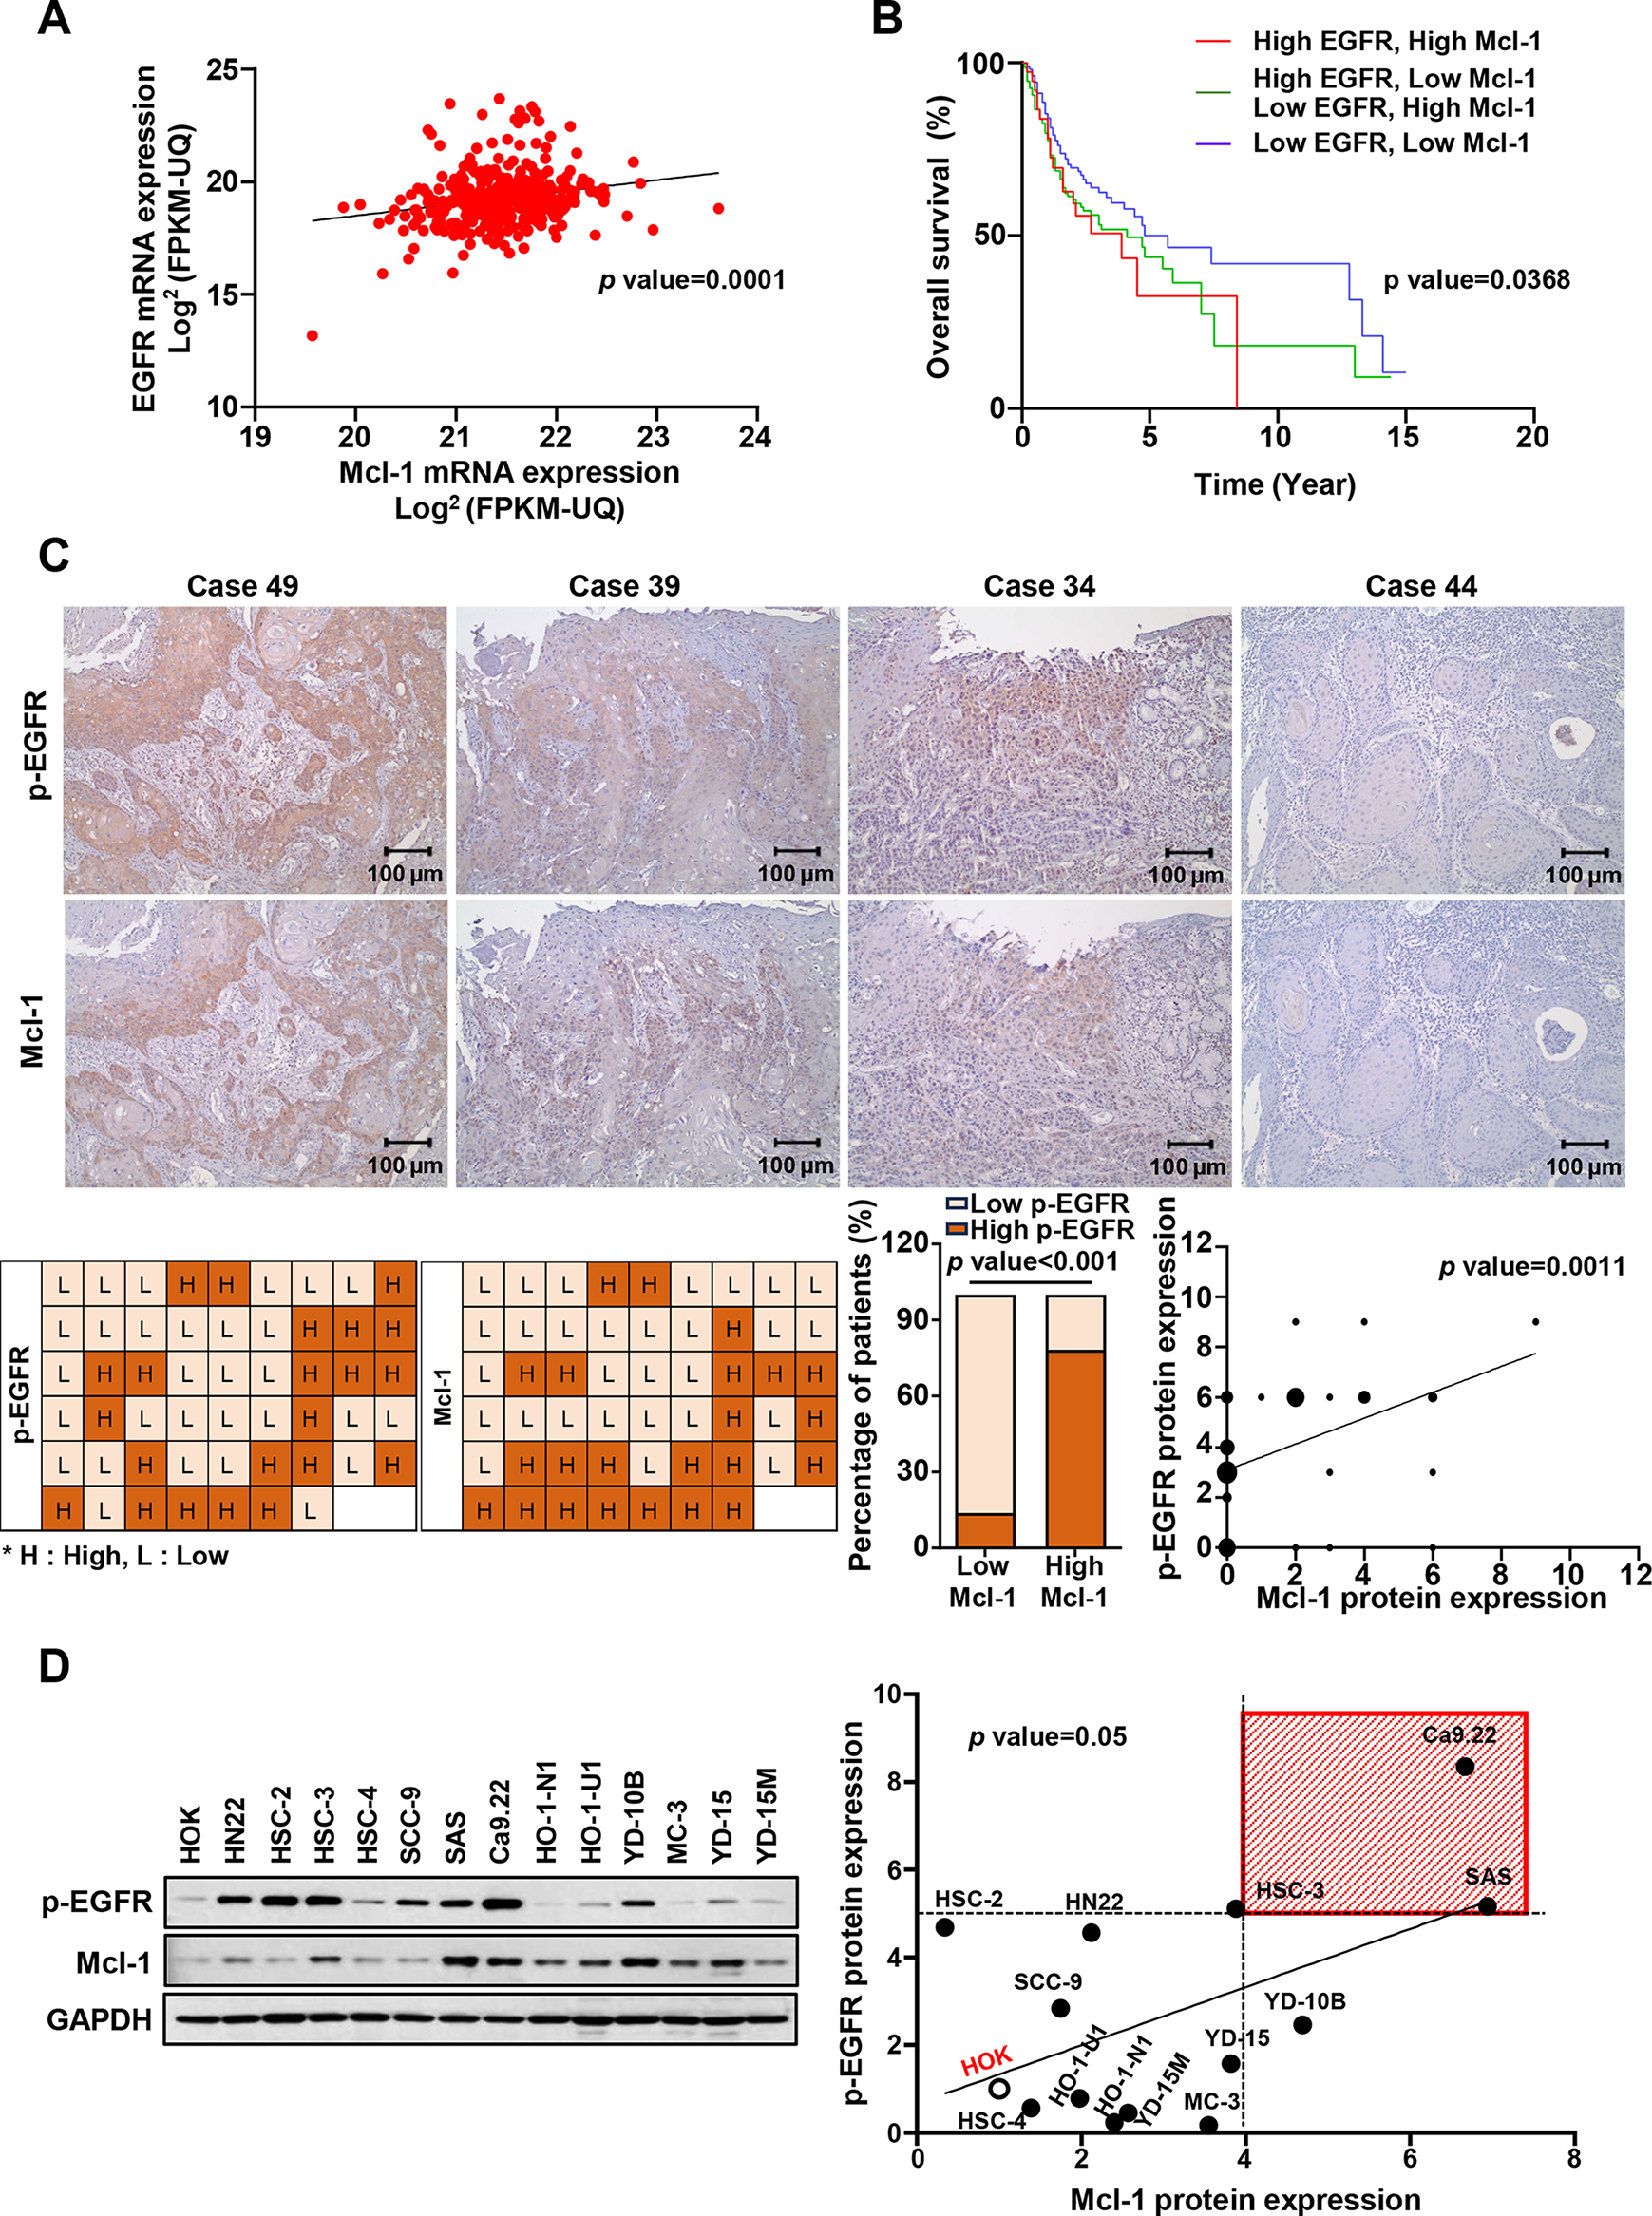
The HNC dataset from TCGA database (https://portal.gdc.cancer.gov/) was utilized to examine the correlation of mRNA expression between EGFR and Mcl-1 in HNC (n = 369). The process of trimming data was done using Jupyter Notebook and Pandas with Python 3.0, and the code is available at https://github.com/kunalchawlaa/TCGA-Oral-Cancer.
5.2 Kaplan–Meier (KM) plotter survival analysis
Using the online survival analysis software KM plotter (http://kmplot.com/analysis), the OS rate of HNC patients was analyzed according to the expression levels of EGFR and Mcl-1.
5.3 Clinical tissue samples
Between 2006 and 2007, the Department of Oral Maxillofacial Surgery at Seoul National University Dental Hospital in Seoul, Republic of Korea, collected 52 tissues from patients who had undergone surgical treatment for oral cancer. These tissues were then examined by immunohistochemistry (IHC). This retrospective study received approval from the Institutional Review Board (IRB) of Seoul National University Dental Hospital (IRB No. ERI20021).
5.4 IHC staining
In the present study, paraffin-embedded tissues from oral cancer patients were sectioned at 4-µm thickness. The paraffin was melted by holding the sections at 60 °C for 1 h, followed by washing with neo-clear and graded ethanol to rehydrate the specimens. For antigen retrieval, the sections were microwaved in an antigen retrieval citrate buffer (pH 6.0) for 10 min, and then treated with a peroxidase blocking reagent (Dako, Carprinteria, CA, USA) for 5 min to inactivate the endogenous peroxidase activity. Sections were incubated overnight at 4 °C in a humidified chamber with a primary antibody against p-EGFR (Cat. No. 3777; 1:100) or Mcl-1 (Cat. No. 39,224; 1:100). The next day, the sections were reacted with REALTM EnVisionTM/horseradish peroxidase (HRP) Rabbit/Mouse (Dako) for 30 min at room temperature (RT), followed by a color reaction with REALTM DAB and Chromogen with Substrate Buffer (Dako) for 30 sc. The sections were then counterstained with hematoxylin, dehydrated, and mounted with a Permount solution (Thermo Fisher Scientific, Waltham, MA, USA).
5.5 Evaluation of IHC staining results
Immunohistochemically stained sections were semi-quantitatively evaluated by two oral pathologists. Tumor cells showing cytoplasmic staining were regarded as positive cells. The intensity of staining (0, negative; 1, weak; 2, moderate; and 3, strong) and percentage of positive cells (0, 0%; 1, 1–9%; 2, 10–49%; 3, 50–100%) were scored. The final immunohistochemical scores were established by multiplying the intensity and percentage scores. The final scores of ≥ 6 and ≥ 2 were classified as high expression and scores of < 6 and < 2 as low expression for p-EGFR and Mcl-1, respectively.
5.6 Cell culture and reagents
The HOK cell line was obtained from Lifeline Cell Technology (Oceanside, CA, USA). The HSC-2, HSC-3, HSC-4, SAS, and Ca9.22 cell lines were kindly provided by Hokkaido University (Hokkaido, Japan). The HN22 and MC-3 cell lines were given by Dankook University (Cheonan, Republic of Korea) and Fourth Military Medical University (Xi’an, China), respectively. The HO-1-N1 and HO-1-U1 cell lines were purchased from the Japanese Collection of Research Bioresources Cell Bank (Osaka, Japan). YD-10B, YD-15, and YD-15 M cell lines were obtained from the Korean Cell Line Bank (Seoul, Republic of Korea). The HOK cell line was grown using the DermaLife K Keratinocyte Medium Complete Kit (Lifeline Cell Technology, Frederick, MD, USA). The HN22, HSC-2, HSC-3, HSC-4, SCC-9, SAS, Ca9.22, HO-1-N1, HO-1-U1, and MC-3 cell lines were maintained in Dulbecco’s modified Eagle’s medium/nutrient mixture F-12 (WELGENE, Gyeongsan, Republic of Korea). The YD-10B, YD-15, and YD-15 M cell lines were cultured in Roswell Park Memorial Institute (RPMI) 1640 medium (WELGENE). The culture media used for all cell lines were supplemented with 10% fetal bovine serum (WELGENE) and 1% penicillin/streptomycin (WELGENE), and the cells were maintained at 37 ºC in a humidified atmosphere with 5% CO2. The cells were rinsed with Dulbecco’s phosphate-buffered saline. Afatinib (BIBW2992), gefitinib (ZD1839), and MHY 1485 were purchased from Selleck Chemicals (Houston, TX, USA), and rapamycin was obtained from Sigma-Aldrich (St. Louis, MA, USA). The chemical compounds were dissolved in dimethyl sulfoxide and aliquoted, then stored at − 20 °C.
5.7 Western blotting
A 1× RIPA lysis buffer (Millipore Corp, Burlington, MA, USA) in combination with phosphatase inhibitor tablets (Thermo Scientific Inc., Rockford, IL, USA) and protease inhibitor cocktails (Roche, Mannheim, Germany) was used to extract total protein from human oral cancer cell lines. Each sample’s protein concentration was determined using a DC Protein Assay Kit (BIO-RAD Laboratories, Madison, WI, USA). An equal amount of protein from each sample was then heated with 5× protein sample buffer at 95 °C for 10 min, separated by SDS-PAGE, and transferred to the immunoblot PVDF membranes (Pall Life Sciences, Portsmouth, Hampshire, England). After blocking with 5% skim milk in Tris-buffered saline with Tween 20 for 1.5 h at RT, the membranes were incubated overnight with the specified primary antibodies at 4 °C. After washing, the membranes were incubated for 2 h at RT with the appropriate secondary antibodies conjugated to HRP. Immunoreactive protein bands were detected using either an x-ray film or the Image Quant LAS 500 system (GE Healthcare Life Sciences, Piscataway, NJ, USA) with a WestGlow™ FEMTO chemiluminescent substrate (BIOMAX, Seoul, Republic of Korea). ImageJ software was used to calculate the protein levels. The following primary antibodies were used in the experiments: rabbit antihuman polyclonal antibodies against cleaved PARP (Cat. No. 9541; 1:1000), cleaved caspase-3 (Cat. No. 9664; 1:1000), phospho-mTOR (Cat. No. 2971; 1:1000), phospho-p70S6 (Cat. No. 9205; 1:1000), Bim (Cat. No. 2819; 1:1000), Mcl-1 (Cat. No. 4572; 1:1000), and rabbit antihuman monoclonal antibodies against phospho-EGFR (Cat. No. 3777; 1:1000), mTOR (Cat. No. 2983; 1:1000), and c-MYC (Cat. No. 5605; 1:1000) that were purchased from Cell Signaling Technology, Inc (Danvers, MA, USA); and rabbit antihuman polyclonal antibody against EGFR (Cat. No. sc-03; 1:1000), goat antihuman polyclonal antibody against t-Bid (Cat. No. 34,325; 1:1000), and mouse antihuman monoclonal antibodies against β-actin (Cat. No. 47,778; 1:3000) and GAPDH (Cat. No. ab9484; 1:3000) that were purchased from Santa Cruz Biotechnology, Inc (Santa Cruz, CA, USA).
5.8 Trypan blue exclusion assay
Cells were dissociated from the culture plate using a 0.25% trypsin-EDTA solution (WELGENE), and then resuspended in 1 mL of PBS. A 0.4% trypan blue (Gibco, Paisley, UK) solution was applied to the cells for staining, and a CytoSMART automatic cell counter (Corning, Tewksbury, MA, USA) was used to determine the number of viable cells in the sample. Only trypan blue-unstained cells were counted as viable.
5.9 Annexin V/propidium iodide (PI) staining
The presence of apoptosis was assessed using the FITC Annexin V apoptosis detection kit (BD Pharmingen, San Jose, CA, USA). The harvested cells were rinsed twice with PBS and then exposed to Annexin V-FITC and PI dyes for 15 min at RT. The stained cells were then examined using a FACS Caliber instrument, and the resulting measurements were calculated using Cell Quest software (BD Biosciences).
5.10 4′-6-Diamidino-2-phenylindole (DAPI) staining
A DAPI solution (Sigma-Aldrich) was used to examine the changes in the nuclear morphology of the apoptotic cells. Cells were seeded onto 60 mm2 plates and treated with 8 µM of afatinib for 24 h. Following the treatment, the cells were collected, washed twice with PBS, and then fixed with 100% methanol RT for 10 min. The cells were then washed again with PBS, seeded onto glass slides coated with a layer of the substance, and stained with a DAPI solution (2 µg/ml). The cell morphology changes were visualized and analyzed using a fluorescence microscope.
5.11 Quantitative real time PCR (qPCR)
The level of Mcl-1 mRNA was quantified through qPCR analysis. After obtaining the target cDNA, PCR was performed using AMPIGENE qPCR Green Mix Hi-Rox (Enzo Life Sciences, Inc, Farmingdale, NY, USA). The qPCR was carried out using the StepOne Plus Real-Time PCR System. The qPCR was carried out using the StepOne Plus Real-Time PCR System (Applied Biosystems, Foster city, CA, USA) and amplification of the target cDNA was achieved using the primers listed below: sense 5’-GTA TCA CAG ACG TTC TCG TAA GG-3’, antisense 5’-CCA CCT TCT AGG TCC TCT ACA T-3’ for MCL-1 and sense 5’- GTG GTC TCC TCT GAC TTC AAC-3’, antisense 5’- CCT GTT GCT GTA GCC AAA TTC-3’ for GAPDH. The MCL-1 and GAPDH amplification was carried out over a total of 40 cycles (for 2 min at 95℃, for 10 s at 95℃, and for 30 s at 60℃). PCR amplification was performed in triplicate for each sample, and the relative expression of Mcl-1 mRNA was determined using the 2-ΔΔCt.
5.12 Construction of Mcl-1 overexpression vector and transient transfection
An open reading frame of the human Mcl-1 gene (NM_021960) was obtained by cDNA amplification using a pair of primers. The primer sequences were as follows: Mcl-1 sense 5′-GAA TTC ATG TTT GGC CTC AAA AGA‐3′ (containing an EcoRI site) and Mcl-1 antisense 5′‐GAA TTC CTA TCT TAT TAG ATA TGC‐3′ (containing an EcoRI site). The PCR product was then ligated into the pGEM®‐T Easy Vector System (Promega, Madison, WI, USA) for cloning. The target genes of interest were successfully inserted into the multiple cloning site of the pcDNA3.1 (+) vector (Invitrogen, Carlsbad, CA, USA). The HSC-3, SAS, and Ca9.22 cell lines were used for the transfection experiments. Cells were transfected with either an empty pcDNA3.1 vector or a pcDNA3.1-Mcl-1 vector construct (0.5 µg) using Lipofectamine 2000 Reagent (Invitrogen) as the transfection agent, according to the manufacturer’s instructions.
5.13 Mitochondrial membrane potential (ΔΨm) assay
The change in ΔΨm was evaluated using a MitoScreen assay kit (BD Pharmingen). After harvesting, the cells were rinsed twice with PBS and then exposed to a JC-1 staining solution for 15 min at 37 °C. The cells were rinsed twice with an 1 × assay buffer, and the JC-1 fluorescence was measured by flow cytometry.
5.14 Nude mouse xenograft assay
Six-week-old male BALB/c-nude mice were obtained from JA BIO, Inc (Suwon, Republic of Korea). The mice used in the study were treated according to the CHA University Institutional Animal Care and Use Committee (IACUC) guidelines (IACUC approval number: 230,040). A fixed number of HSC-3 cells were transplanted subcutaneously into the flanks of the mice. For the tumor-bearing mice, the vehicle control and afatinib (25 and 50 mg/kg/day) were administered orally by gavage five times a week for 21 days starting at approximately 7 days after the start of the experiment (day 0). Tumor volume and body weight of the mice were measured twice a week, and the tumor weight was measured on the day of necropsy. The tumor volume was determined by measuring its diameter along two axes using calipers, and then calculating the volume using the formula V = π/6[(D + d)/2], where D and d are the larger and smaller diameters, respectively.
5.15 Statistical analysis
For in silico studies, a paired or unpaired two-tailed Student’s t-test was used to compare the EGFR and Mcl-1 expression levels between the normal and tumor tissues. Spearman’s rank correlation analysis was used to examine the relationship between the DNA copy number and mRNA expression levels. In vitro studies utilized a two-tailed Student’s t-test to assess the significance of the differences between two experimental groups, and a one-way analysis of variance was performed for multiple comparisons using Tukey’s post hoc test. Nonparametric Mann–Whitney tests were used to analyze non-normally distributed datasets in the in vivo studies. The association between the immunohistochemical expression of Mcl-1 and p-EGFR in oral cancer tissue samples was analyzed using Pearson’s chi-square test. Data analysis was performed with GraphPad Prism version 8.4 and evaluated with SPSS 25 (SPSS, Chicago, IL, USA). All experiments were conducted independently in triplicate. The results with P < 0.05 were considered statistically significant.

留言 (0)