
記住我


This retrospective study included 85,885 patients registered in the national Medical Care Monitoring Center (MCMC) system and admitted from 02/20/2020 to 12/19/2022 to hospitals affiliated with Golestan University of Medical Sciences, Iran.
The MCMC system is run by Iran’s Ministry of Health and Medical Education, operating in all medical science universities as the most complete system for registering outpatient and inpatient cases of COVID-19. This system records patients' information, including personal characteristics such as age, gender, city of residence, being a treatment staff, history of underlying diseases, signs and symptoms, disease outcome, and the date of occurrence. Patients registered in this system include definite cases (with a positive polymerase chain reaction test or positive lung computed tomography scan) or probable cases of COVID-19 (diagnosed clinically by a physician).
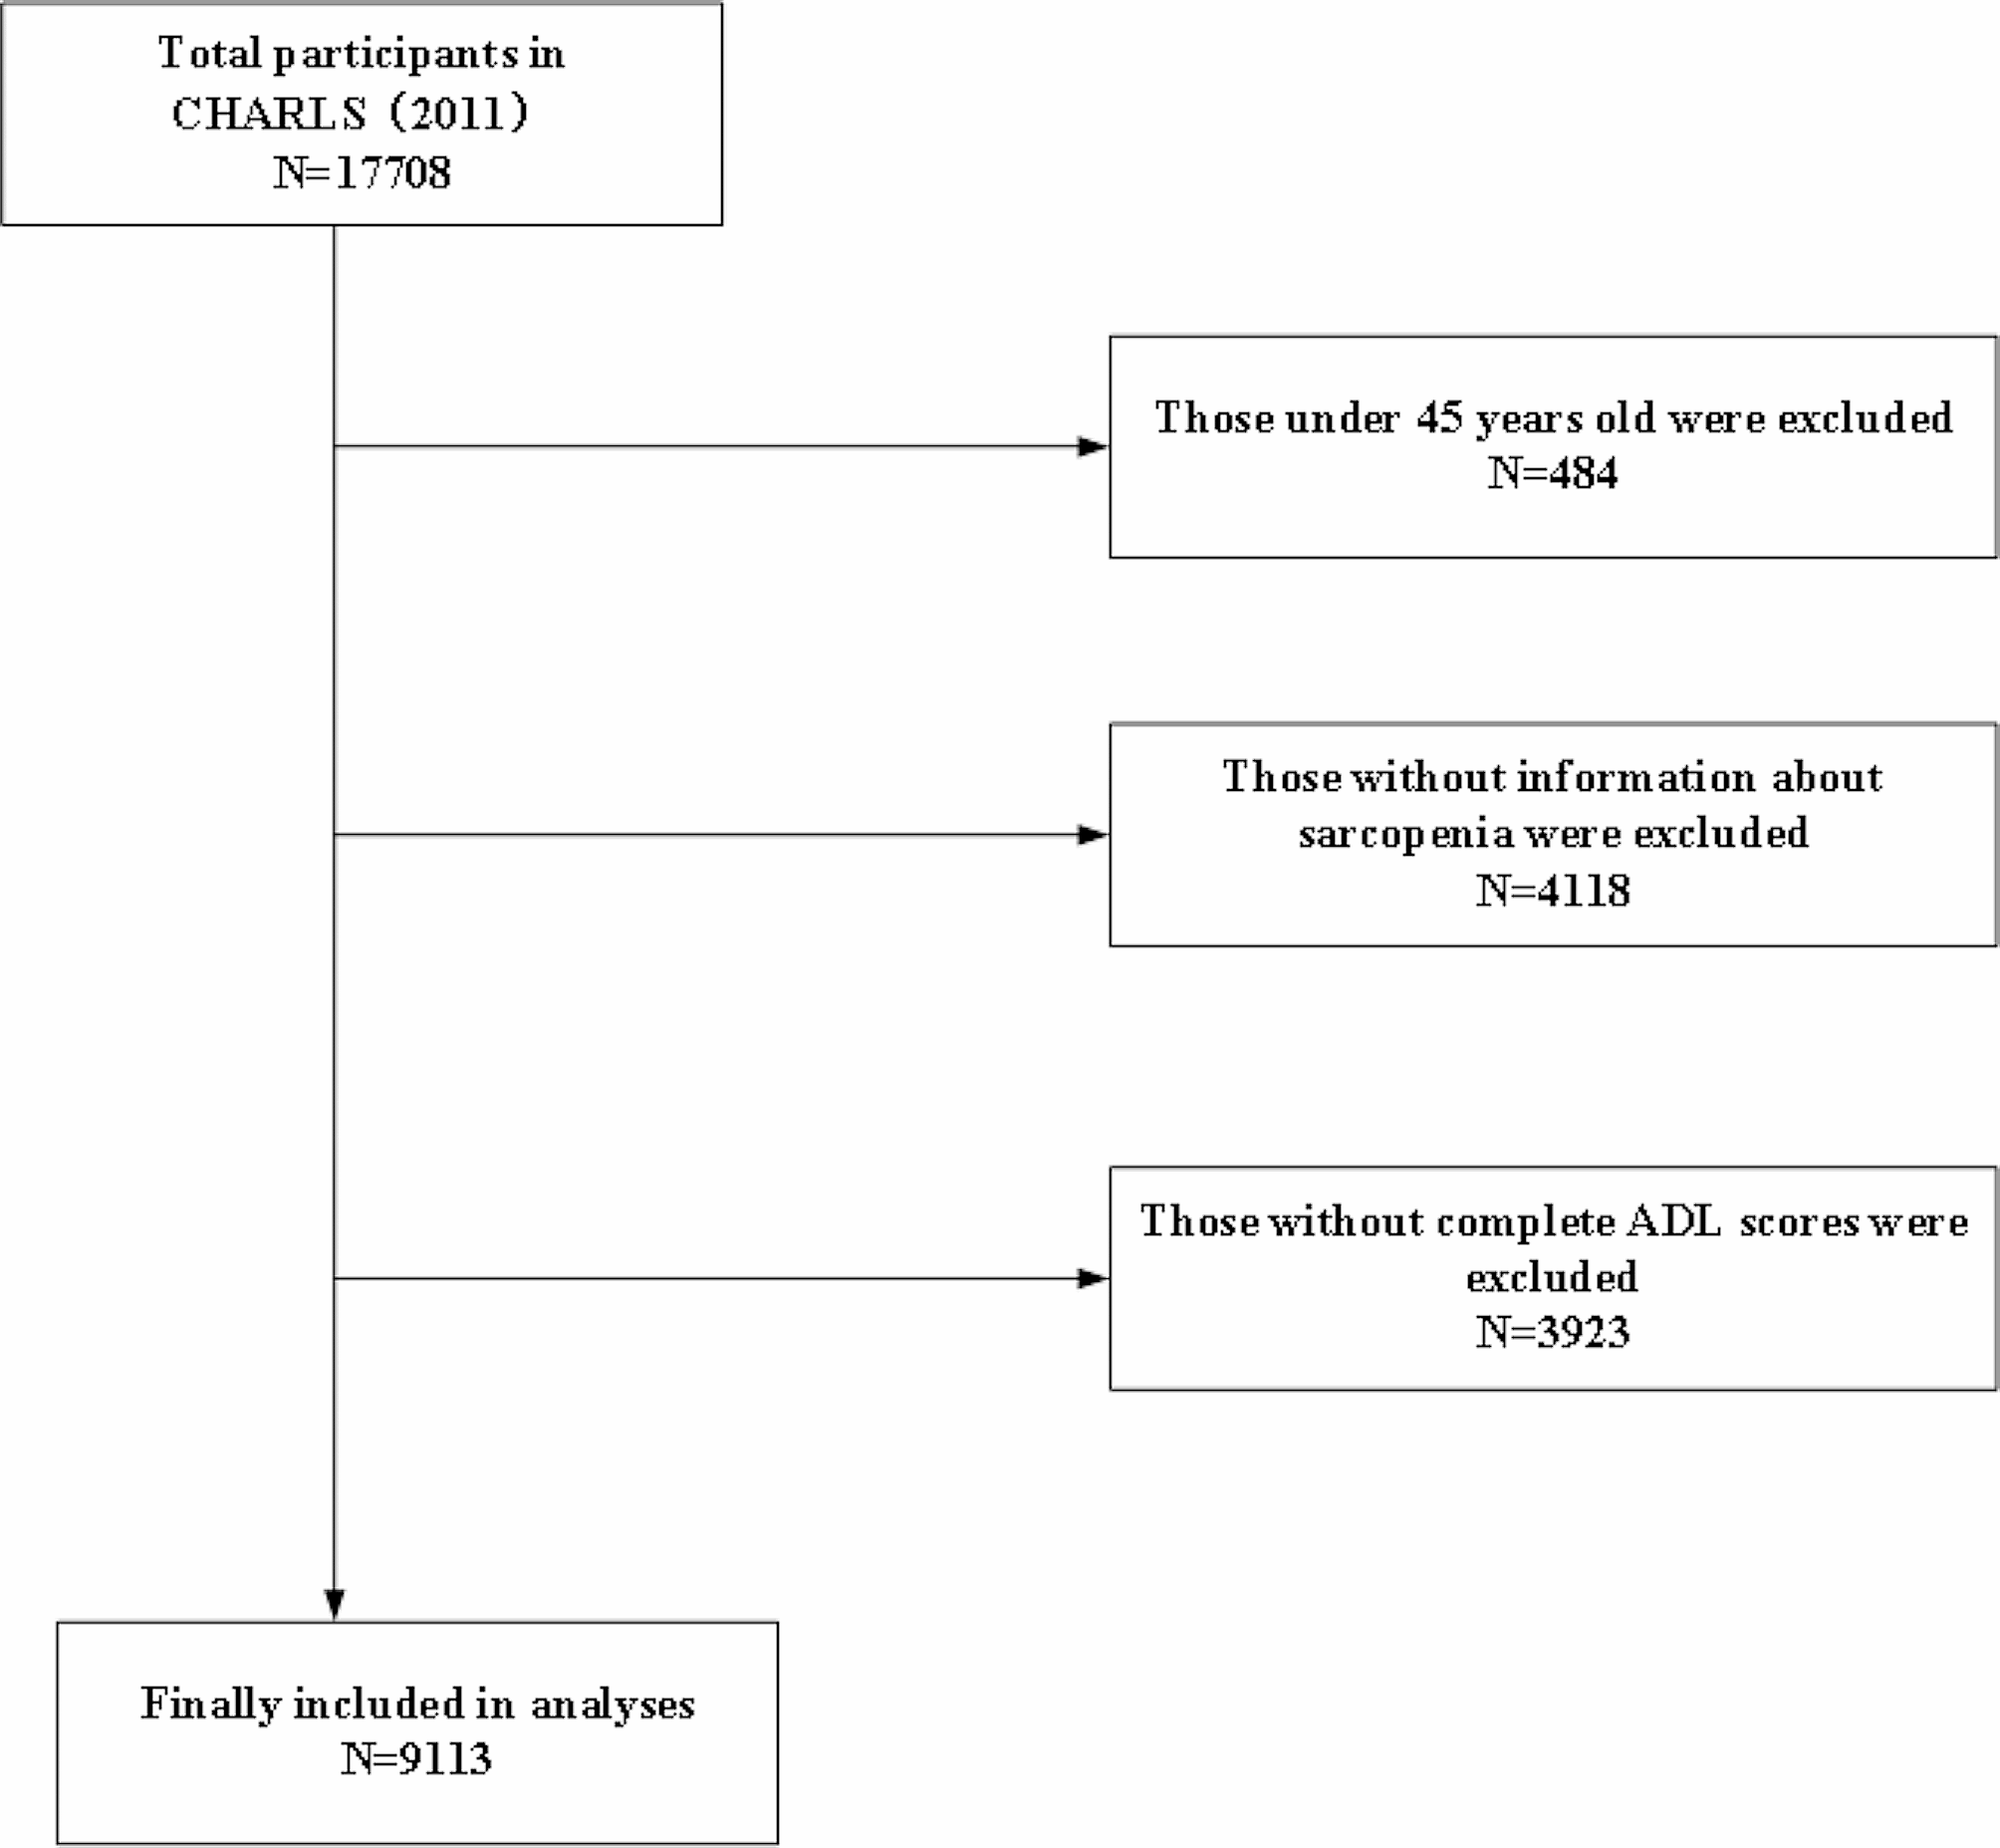
After extracting the data in the investigated period (85,855 people), we refined the data to remove outpatients. We also excluded hospitalized patients who had no date of discharge/death, had missing individual data, or had been transferred to other medical centers excluded from the coverage of Golestan University of Medical Sciences. Finally, the data of 68,983 people were analyzed (Fig. 1).
Fig. 1
Flowchart of the process of sampling hospitalized patients with COVID-19 in the Golestan province
Patient survival timeBased on the date of admission, the date of death (failure) or discharge from the hospital (censor) was calculated in terms of days. In this study, the survival time was measured and recorded as the length of hospitalization of patients in the hospital, i.e., the time from the start of hospitalization to the time of discharge (as the length of hospitalization) or the time of death.
Epidemic risk status (ERS)The official risk assessment method announced by the Ministry of Health and the National COVID-19 Management Committee was used to determine the ERS. This method classifies the epidemic into four ERS levels based on the adjusted incidence rate (AIR):
$$AIR=\frac_ +( _- _) }*\text}*\text$$
\(_\): The number of hospitalized severe acute respiratory illness (SARI) cases with positive COVID-19 test results.
\(_\): Number of hospitalized SARI cases whose COVID-19 test results are negative.
\(_\): Number of hospitalized SARI cases whose COVID-19 test results have not been recorded.
\(\text\): City population
t: The length of the target time period in terms of days.
α: The impact coefficient of negative or uncertain cases. This coefficient is considered due to the false negative probability of the molecular test.
The following formula was used to calculate the risk score based on the AIR:
$$Score=}_+\updelta *\text( 0, }_-\frac}_ +}_})$$
\(}_\): Adjusted incidence rate for the last week.
\(}_\): Adjusted incidence rate for the week prior to the last week.
\(}_\): Adjusted incidence rate for the week two weeks prior to the last week.
In the above formula, the AIR increase in the last week compared to the previous 14-day period is calculated to determine the increasing or decreasing trend of the disease’s incidence. If the trend is decreasing or constant, only \(}_\) is used. If the trend is increasing, the increment is added to \(}_\) by taking into account the delta coefficient.
Finally, based on the ERS index, cities are classified according to the following criteria:
Very high risk (red): ERS score > 4 AND increasing trend
High risk (orange): ERS score 2–4 or ERS score > 4 AND decreasing trend
Moderate risk (yellow): ERS score of 1–2
Low risk (blue): ERS score < 1
For each of the registerd patients, ERS level in the first day of hospital admission is considered as the base of comparisons.
Other variables (covariates)Based on the age classification of COVID-19 deaths recorded by the Centers for Disease Control and Prevention (CDC), the age of the individuals was classified into eight groups: 0–17 years, 18–29 years, 30–39 years, 40–49 years, 50–64 years, 65–74 years, 75–84 years, and ≥ 85 years [16]. Individuals were classified as having an underlying disease if they had at least one of the following: heart disease, diabetes, chronic kidney disease, asthma or other chronic lung diseases, chronic neurological disorders, hypertension, blood disorder, chronic liver disease, cancer, HIV/AIDS, acquired or congenital immunodeficiency, other chronic diseases, or pregnancy. Otherwise, the person was classified as having no underlying diseases.
The clinical spectrum of COVID-19 was classified based on the American National Institutes of Health’s Guidelines for the Treatment of COVID-19 [17]:
Moderate illness: Patients with clinical or imaging evidence of lower respiratory disease and an arterial oxygen level > 94%.
Severe illness: People with arterial oxygen level < 94%, respiratory rate > 30 times per minute, opacities covering > 50% of the lungs on imaging, and requiring oxygen therapy.
Critical illness: People hospitalized in the intensive care unit or intubated (respiratory failure, septic shock, or multiple organ failure).
Statistical analysisFindings are reported using frequencies and percentages for all variables. The overall survival rate was evaluated using the Kaplan–Meier method, and the assumption of proportional hazards based on the Schoenfeld scale. Also, the comparison of survival of patients in different subgroups and the correlation of ERS with death/survival was assessed using the log-rank test and univariate and multivariate Cox modeling. All analyses were performed using SPSS 26 and Stata 17 software.
留言 (0)