
記住我

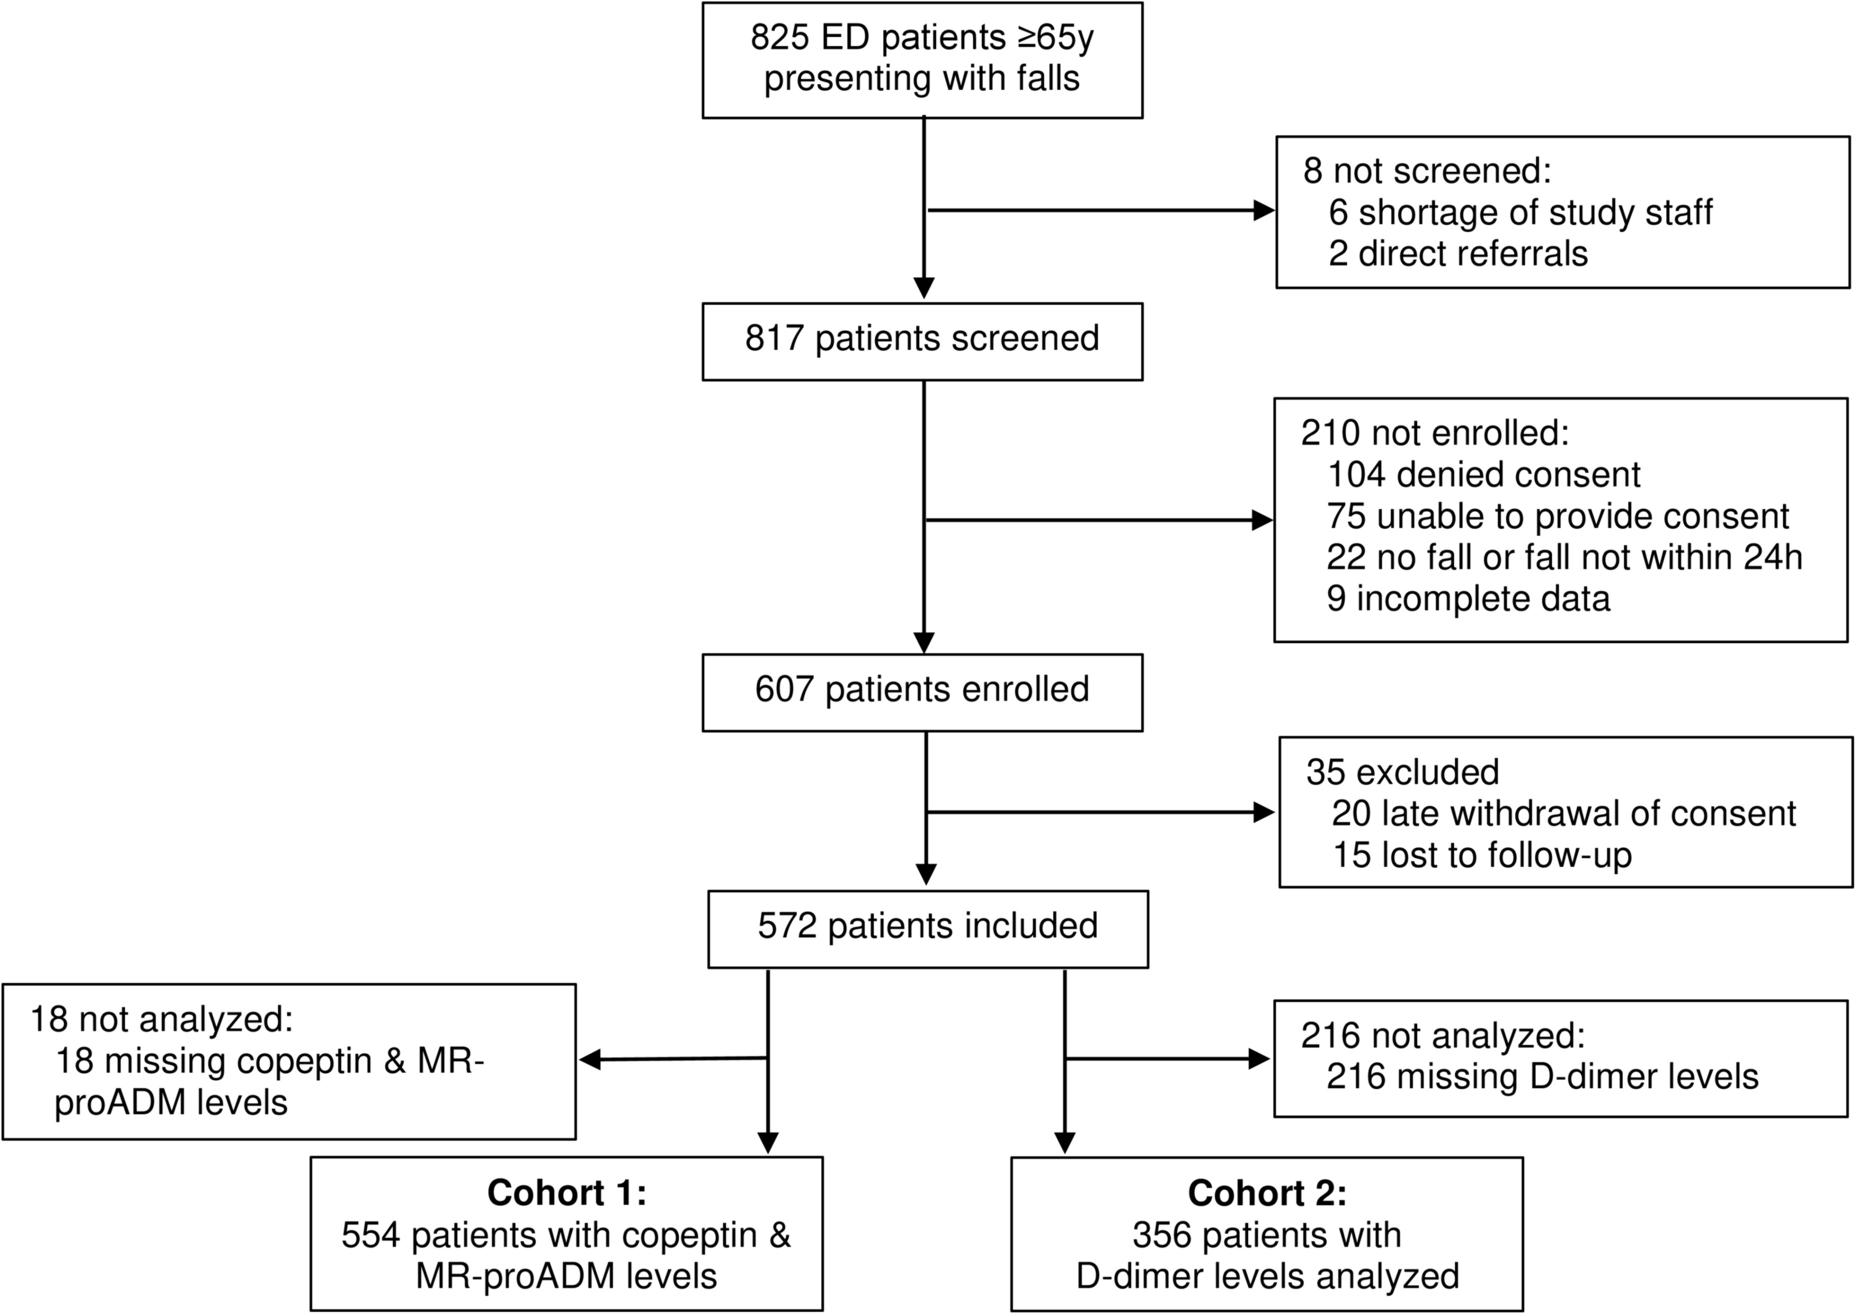

We included 572 patients with complete data in this analysis (Fig. 1). Median age was 83 years [IQR 77, 89], 67.7% of all patients were female, and 77.4% of patients were admitted as inpatients.
Fig. 1
Flow chart of the study population
At 30-day follow-up, 18 (3.1%) of all included patients had died. Thirty-one (5.4%) died within 90 days and forty-three (7.5%) within 180 days. At the 365-day follow-up, 77 (13.5%) patients had died, while 495 (86.5%) survived. Details of the 18 patients that died within 30 days are shown in Supplemental Table 3.
Non-survivors were older (median 89 vs. 83 years) and had a lower median ADL index (4 vs. 5) compared to patients who survived 30 days (Table 1).
Table 1 Baseline characteristics and biomarker levels for the study population, separated by 30-day mortalityAround half (47.4%) of patients were classified as injurious fall, while around a quarter of patients were classified as acute medical condition (26.5%) and as non-injurious fall (26.1%). These rates were comparable compared to patients who survived 30 days (injurious falls: 47.8%, acute medical conditions: 25.5%, non-injurious falls: 26.6%) but differed significantly for non-survivors, where acute medical conditions accounted for the majority (55.6%) of cases, while injurious falls (37.5%) and non-injurious falls (12.5%) accounted for a smaller part.
In 554 patients, MR-proADM as well as copeptin levels were available (cohort 1), whereas D-dimer measurement was available in 356 patients (cohort 2). Three hundred forty-six cases were included in both cohort 1 and cohort 2 (Fig. 1). A comparison of the cohorts regarding baseline characteristics can be found in the Supplemental Table 1.
Cohort 1Age and sex distribution as well as overall mortality in cohort 1 were comparable with the complete cohort. Median age was 83.5 years [IQR 77, 89], 67.7% of patients were female and 78% were admitted as inpatients.
At 30-day follow-up, 18 (3.2%) patients had died. Thirty-one (5.6%) died within 90 days and forty-three (7.8%) within 180 days. At the 365-day follow-up, 76 (13.7%) patients had died, while 478 (86.3%) survived. For more details, see Kaplan–Meier curves in Supplemental Figs. 1 and 2.
Based on our predefined cutoffs, 341 (61.6%) patients in cohort 1 had elevated MR-proADM, and 352 (63.5%) had elevated copeptin levels. Median copeptin levels were generally lower in females (17.6 vs. 27.3 pmol/L, p = < 0.001), and there were less females with copeptin levels above the cutoff (57.6% vs. 76%, p = < 0.001), while there was no difference in MR-proADM levels (0.84 vs. 0.9 nmol/L, p = 0.23 and 60.5% vs. 63.7%, p = 0.51).
Patients with MR-proADM levels above 0.75 nmol/L compared to patients with non-elevated MR-proADM levels were older (85 vs. 80 years, p = < 0.001) and had a higher mortality rate within 30 days (5 vs. 0.5% p = 0.008). Patients with elevated copeptin levels were older (85 vs. 81 years, p = < 0.001) and less likely to be female (61.4 vs. 78.7% p = < 0.001). There was no significantly higher mortality rate within 30 days between the groups with and without copeptin elevation (Supplemental Table 2).
Both, patients with elevated MR-proADM levels, and patients with elevated copeptin levels were more likely to be admitted as inpatients, but neither difference was statistically significant (MR-proADM: 80.6 vs. 73.6%, p = 0.059. Copeptin: 80.7 vs. 73.3%, p = 0.055).
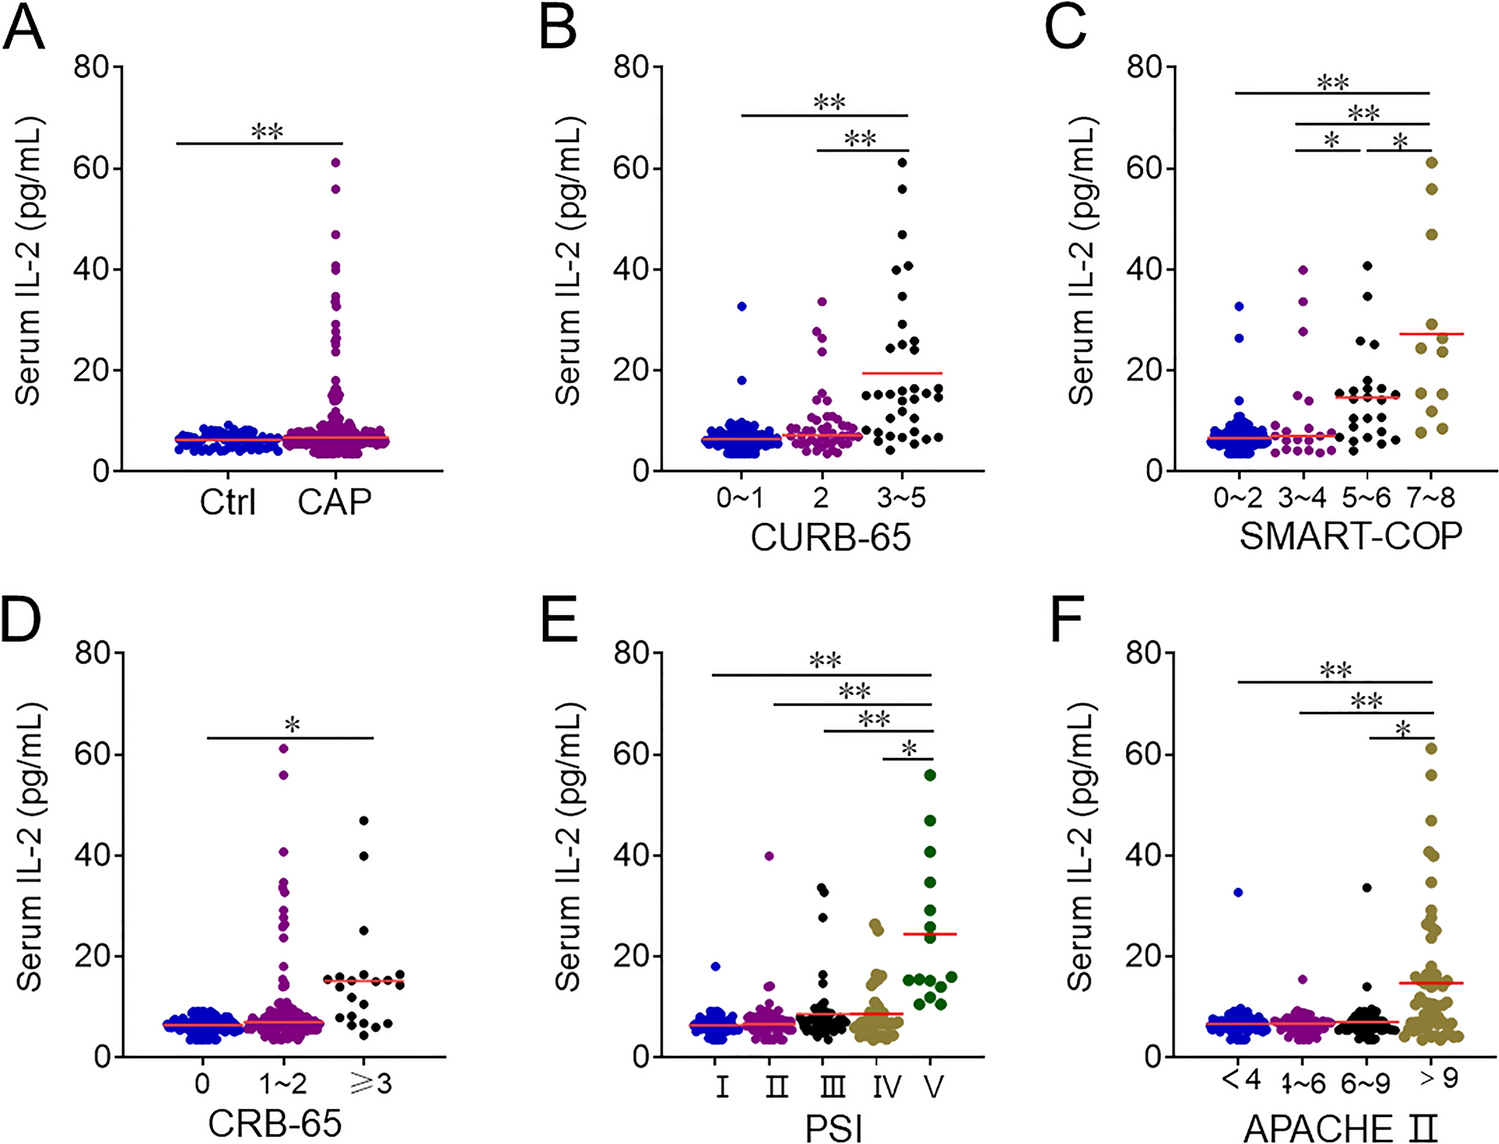
In cohort 1, the levels of all biomarkers were significantly higher in non-survivors, as illustrated in Table 1, Fig. 2, and Supplemental Table 2.
Fig. 2
Baseline biomarkers grouped by mortality after 30 days
In cohort 1, 94.4% of patients who died within 30 days and 93.5% of patients who died within 90 days had a MR-proADM level above the predefined cutoff.
Seventy-eight percent of patients who died within 30 days and 74.2% of patients who died within 90 days had a copeptin level above the predefined cutoff.
The predetermined MR-proADM cutoff showed high sensitivity (0.94, 95% CI 0.73–1.0) and low negative likelihood ratio (0.14, 95% CI 0.02–0.95), but low specificity (0.4, 95% CI 0.35–0.44) for mortality within 30 days.
The predetermined copeptin cutoff showed a sensitivity of 0.78 (95%CI: 0.52–0.94), a specificity of 0.37 (95% CI 0.33–0.41), and a negative likelihood ratio of 0.6 (95% CI 0.25–1.44) for mortality within 30 days (Table 2).
Table 2 Sensitivity, specificity, and likelihood ratios for mortality within 30 daysFor elevated MR-pro-ADM levels, the odds ratio of dying within 30 days estimated with univariate logistic regression increased 11.12-fold (95% CI 2.26–201.2) compared to normal levels. After adjusting for age, sex, and ADL level at baseline, the odds ratio was 7.65 (95% CI 1.5–138.94) (Table 3).
Table 3 Logistic regression analyses for different elevated biomarkers to predict death within 30 days after presentationOdds ratio of dying within a year estimated with univariate logistic regression increased 2.63-fold (95%CI 1.15–4.84) for elevated MR-pro-ADM levels. After adjusting for age, sex, and ADL Index at baseline, the odds ratio for mortality was 1.9 (95% CI 1.05–3.55).
For elevated copeptin levels, the odds ratio of dying within 30 days estimated with univariate logistic regression increased 2.05-fold (95% CI 0.72–7.31) compared to normal levels. After adjusting for age, sex and ADL level at baseline the odds ratio for mortality was 1.0 (95% CI 1.0–1.01).
Odds ratio of dying within a year estimated with univariate logistic regression increased 1.38-fold (95% CI 0.83–2.37) for elevated copeptin levels. After adjusting for age, sex, and ADL Index at baseline, the odds ratio for mortality was 0.97 (95% CI 0.56–1.72).
Adjusting for covariates resulted in change of odds ratio for dying within 30 days for both biomarkers; thus, AUC was only displayed for multivariate logistic regression (Table 3 and Fig. 3).
Cohort 2Age and sex distribution as well as overall mortality in cohort 2 were comparable with the complete cohort. Median age was 83 years [IQR 78, 89], 66.3% of patients were female and 78.4% were admitted as inpatients. Eleven (3.1%) patients had died at 30-day follow-up, eighteen (5.1%) died within 90 days, and twenty-five (7%) within 180 days. At the 365-day follow-up, 43 (12.1%) patients had died, while 313 (87.9%) survived. For more details, see Kaplan–Meier curves in Supplemental Figs. 3 and 4.
In cohort 2, there were 321 (90.2%) patients with D-dimer levels above the usual cutoff (< 0.5 µg/mL), and 281 (78.9%) with D-Dimers above the age-adjusted cutoff (patient’s age /100 µg/mL) (Table 1).
Median D-dimer levels were higher in females (2.34 vs. 1.73 µg/mL, p = 0.017), and there were more females with D-dimer levels above the age-adjusted cutoff (82.6% vs. 71.7%, p = 0.02), but not above the usual cutoff (91.9% vs. 86.7%, p = < 0.132).
Patients with elevated D-dimer levels (cutoff > 0.5) were older (84 vs. 76 years, p < 0.001), more likely to be admitted as inpatients (80.1 vs. 62.9%, p = 0.029), and had higher mortality rate within 30 days (3.4% vs. 0) compared to patients with non-elevated D-dimer levels (Supplemental Table 2).
In cohort 2, the levels of all three biomarkers were significantly higher in non-survivors, as illustrated in Table 1, Fig. 2, and Supplemental Table 2.
In cohort 2, none of the 11 patients who died within 30 days and the 18 patients who died within 90 days had a D-dimer below the regular, or age-adjusted cutoff.
The regular D-dimer cutoff showed high sensitivity (1.0 95% CI 0.72–1.0) and low negative likelihood ratio (0.0, 95% CI 0.0–2.47), but low specificity (0.10, 95% CI 0.07–0.14). The age-adjusted cutoff shows a higher specificity (0.22, 95% CI 0.18–0.26) without loss of sensitivity (Table 2).
For elevated D-dimer levels, the univariate logistic regression shows an increased odds ratio for mortality within 30 days both for common threshold (OR 2.63 (95% CI 0.33–340.5)) as well as for age-adjusted threshold (OR 6.55 (95% CI 0.84–844.62)). After adjusting for age, sex, and ADL Index at baseline, the odds ratio for mortality within 30 days is 1.2 for common threshold (95% CI 0.12–163.39) and 3.08 for age-adjusted threshold (95% CI 0.36–402.4) (Table 3).
Odds ratio of dying within a year estimated with univariate logistic regression shows an increased odds ratio for elevated D-dimer levels both for common threshold (OR 1.93 (95% CI 0.61–9.71)) as well as for age-adjusted threshold (OR 2.52 (95% CI 1.01–8.02)). After adjusting for age, sex, and ADL Index at baseline, the odds ratio was 1.26 for common threshold (95% CI 0.37–6.54) and 1.98 for age-adjusted threshold (95% CI 0.76–6.46) (Fig. 3).
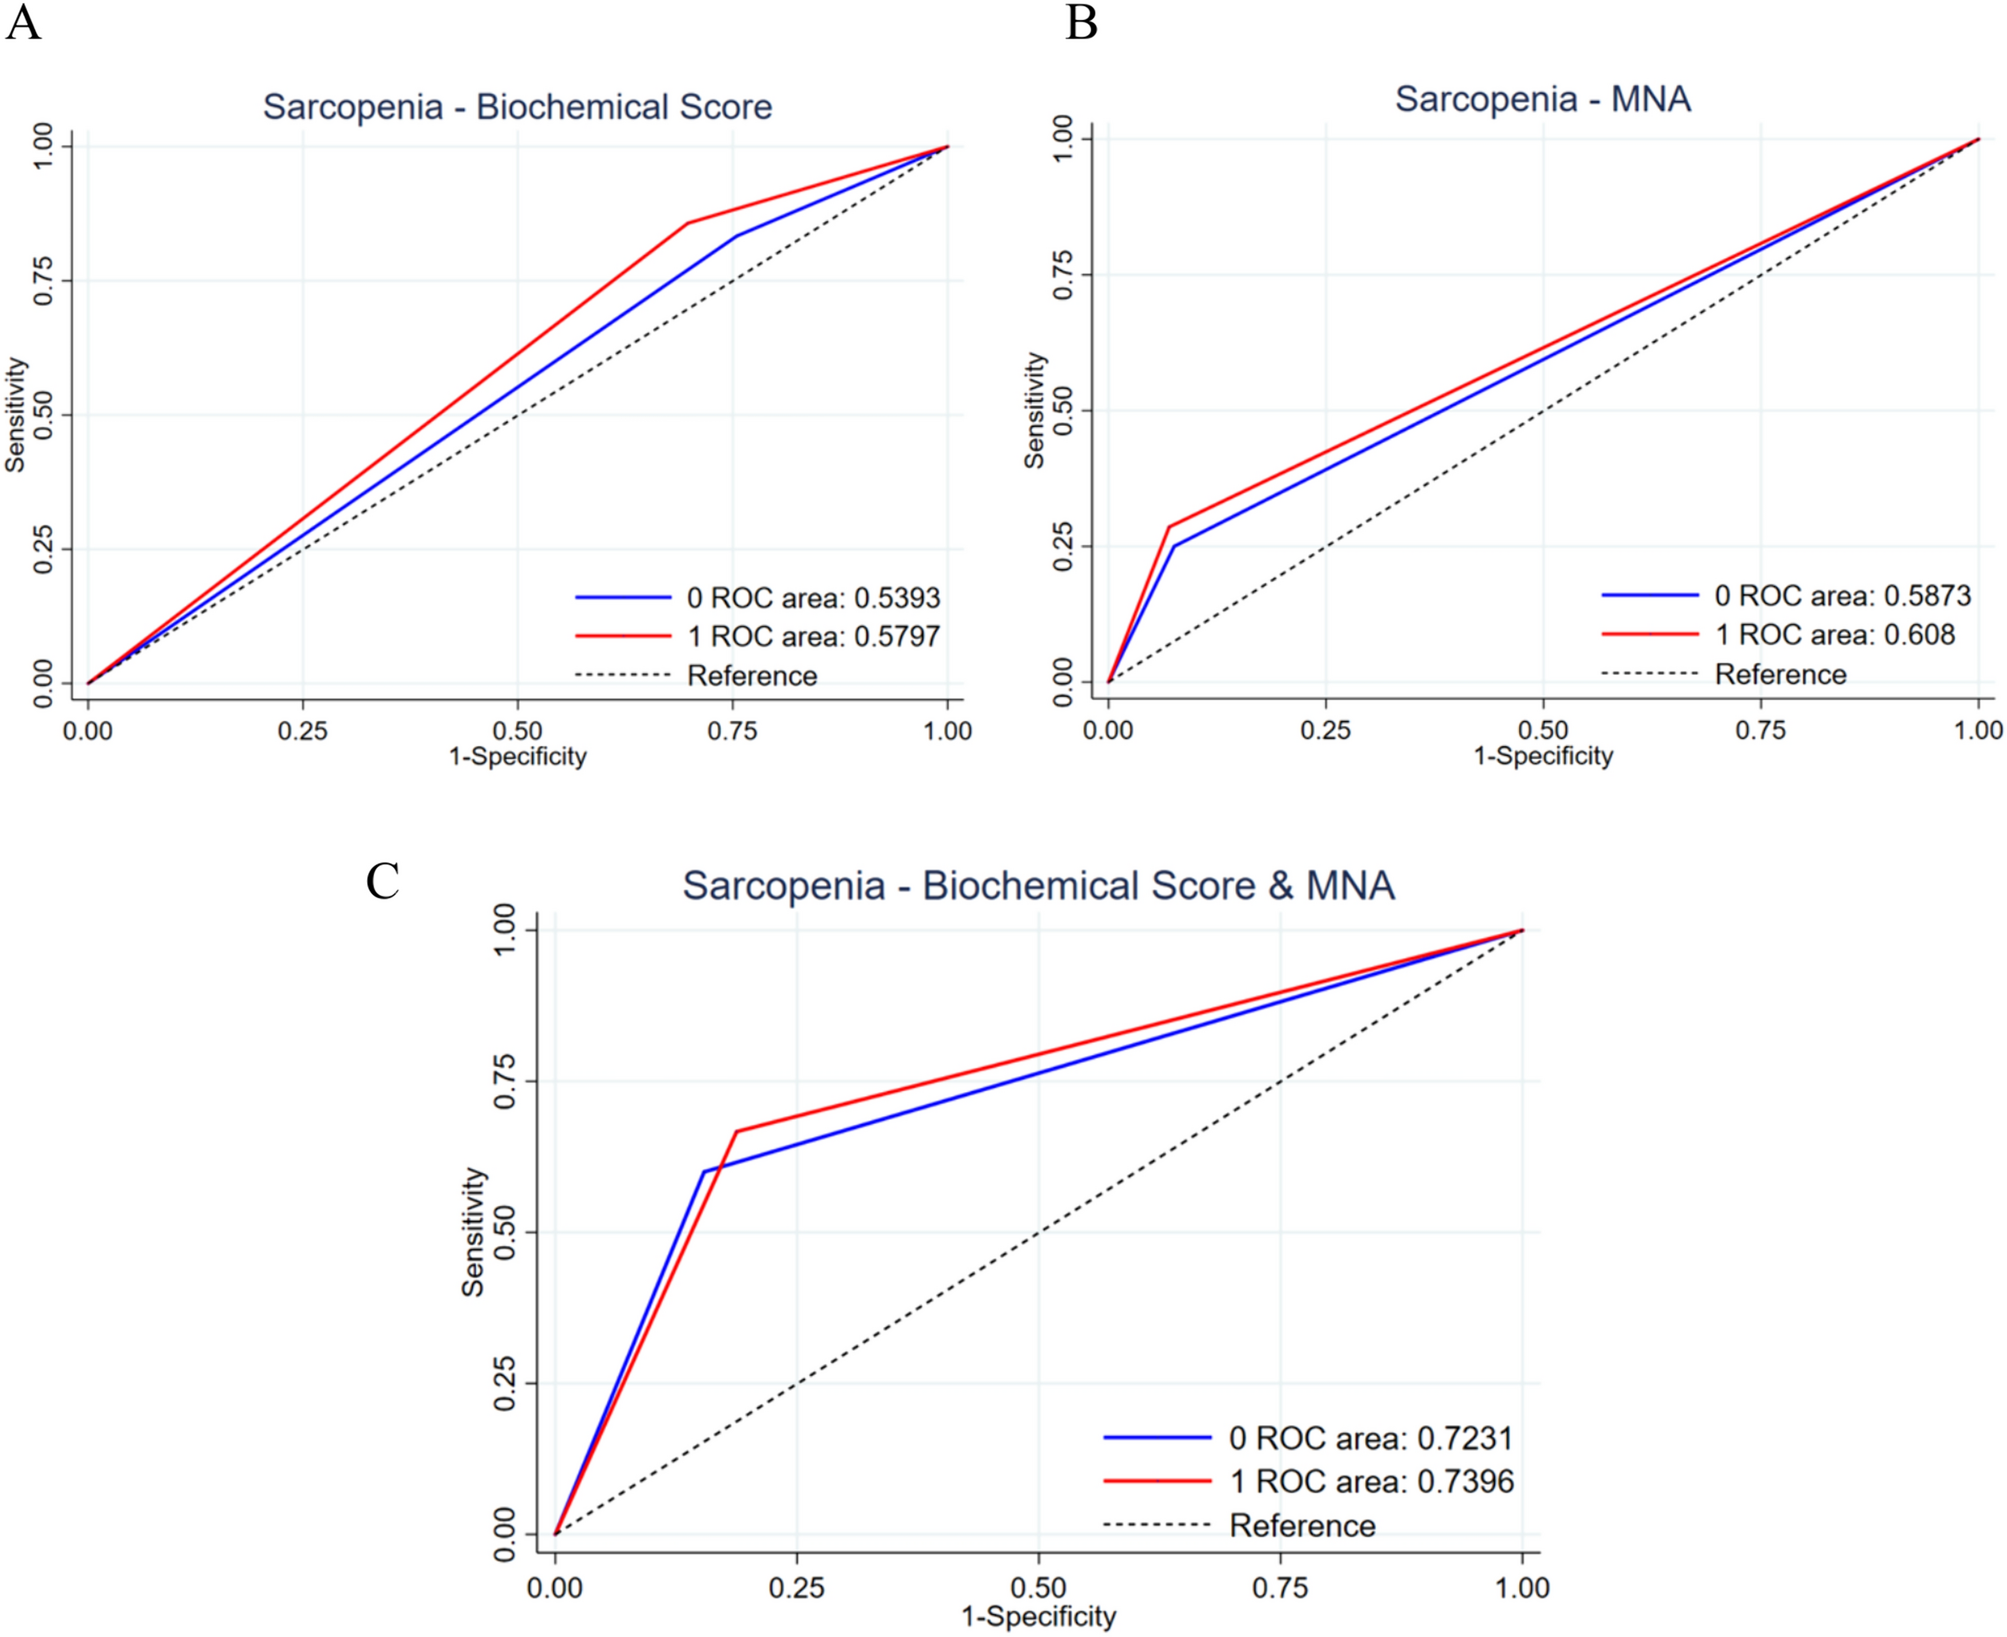
Fig. 3
ROC curves for mortality after 30 days predicted by D-dimer, copeptin, and MR-proADM levels, each adjusted for age, gender, and Katz-ADL index against a baseline of these covariates
The correlation between all variables used in the regression analyses is shown in Supplemental Fig. 5.
留言 (0)