
記住我
Linear regression was performed on the resulting data for relationships between time spent on the CBL, IRAT performance, TRAT performance, and exam performance. Analysis on the distribution of residuals, the difference between actual and predicted observations, was done to validate model performance on the data. All analysis was carried out in R, with RStudio serving as the integrated development environment.
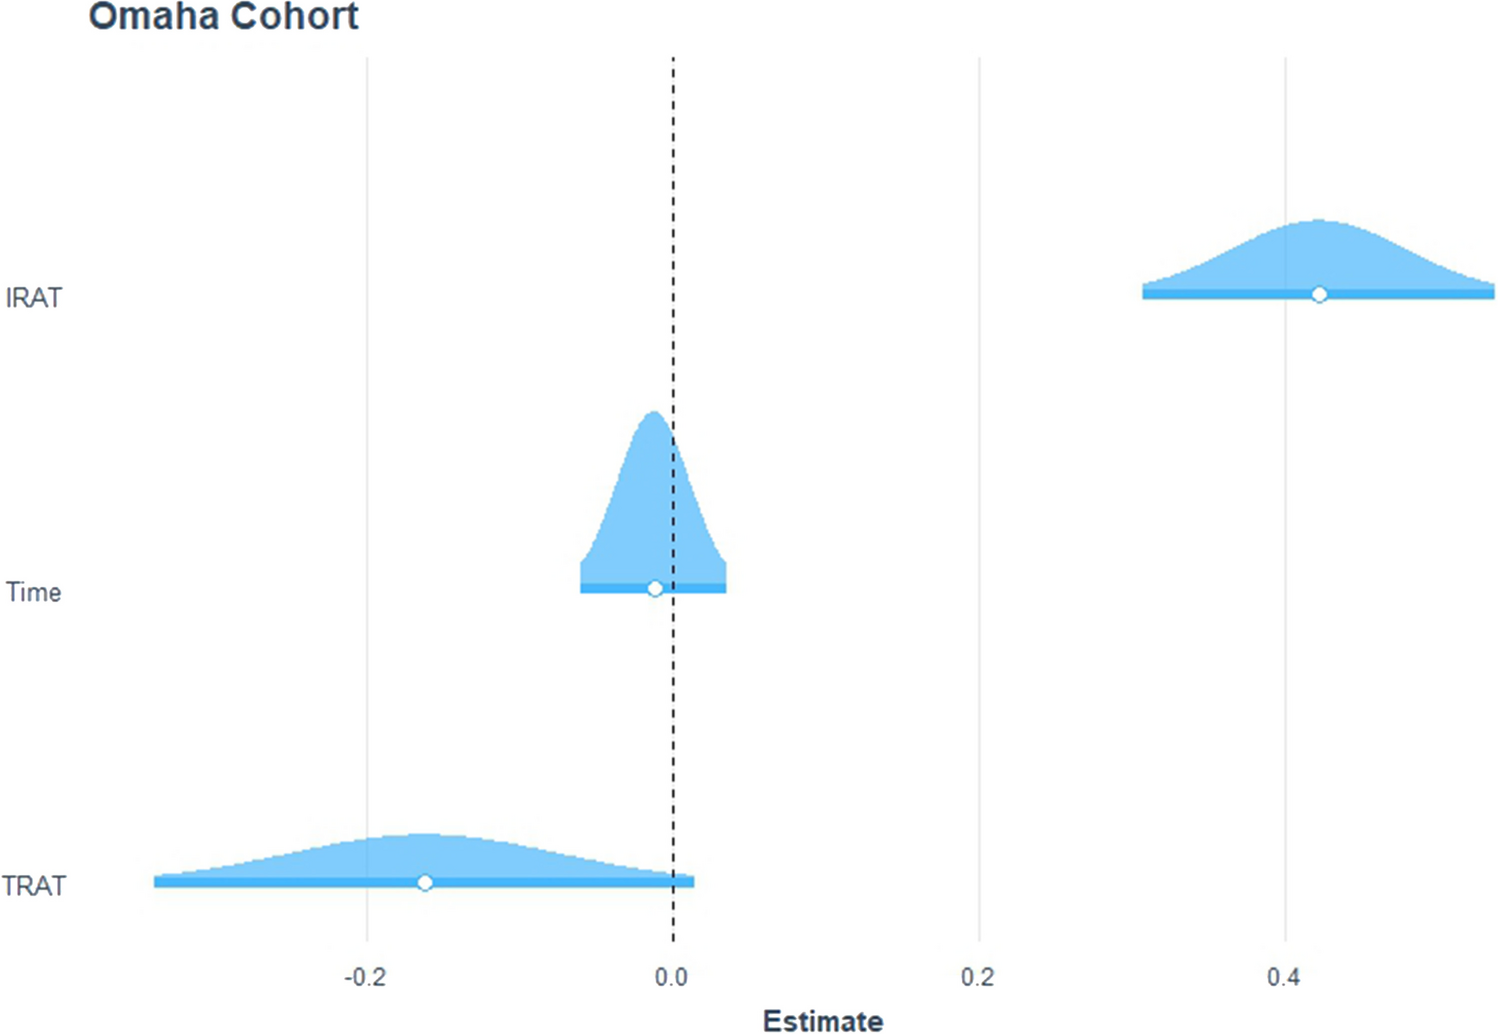
Omaha ResultsThere was a significant relationship between IRAT and exam performance, controlling for time and TRAT scores, with exam performance as the dependent variable (adj. R2 = 0.42, F(6, 73) = 10.3, p = 0.00). The coefficient from this model was β = 0.40, indicating that a 1 standard deviation increase in IRAT score would lead to an approximately 0.40 standard deviation increase in exam score (Fig. 1). Predictions of these exam performances resulted in a distribution of residuals with a rightward skew, indicating a higher-than-observed estimation by the model for exam scores based on IRAT scores and controlling for time and TRAT scores (Fig. 2). This data supports previous research showing a strong correlation between TBL performance and final exam performance when compared to other learning methods [1, 2].
Fig. 1
Distribution of estimated effect sizes from the chosen model
Fig. 2
Approximate normal distribution of residuals for the chosen model, with the rightward skew indicated by the points above the trend line on the lower left and below the trend line on the upper right portion of the graph
There was not a significant relationship between time and exam performance (adj. R2 = 0.00, F(1, 78) = 1.02, p = 0.317). There was not a significant relationship between average time and average IRAT performance (adj. R2 = 0.00, F(1, 78) = 1.07, p = 0.30). There was not a significant relationship between average time and average TRAT performance (adj. R2 = 0.00, F(1, 78) = 13.12, p = 0.71). This indicates that exam performance, average IRAT performance, and average TRAT performance cannot be predicted by the average time spent on the case.
Phoenix ResultsThere was a significant relationship between average IRAT and average exam performance, controlling for time and mean TRAT scores, with exam as the dependent variable (adj. R2 = 0.33, F(3, 70) = 13.12, p < 0.01). The coefficient from the model was β = 0.18, indicating that a 1 standard deviation increase in mean IRAT score would lead to an approximately 0.18 standard deviation increase in mean exam score (Fig. 3). Predictions of these exam performances resulted in a non-normal distribution of residuals, indicating that not all patterns within the data between mean IRAT scores and mean exam scores, when controlling for time and mean TRAT performance, were captured by the model. Figure 4 also indicates that there may exist outliers in the tail end of the residual distribution.
Fig. 3
Distribution of estimated effects sizes from the chosen model
Fig. 4
Non-normal distribution of residuals for the chosen model, shown by small systematic deviations near center of distribution. An outlier exists in the rightward tail of the distribution
There was not a significant relationship between average time and exam performance (adj. R2 = 0.00, F(1, 72) = 0.46, p = 0.50). There was not a significant relationship between IRAT average performance and average time (adj. R2 = 0.00, F(1, 105) = 0.46, p = 0.78). There was a significant relationship between TRAT average performance and average time (adj. R2 = 0.03, F(1, 105) = 4.25, p = 0.04). However, a low coefficient of determination indicates that very little variation in average TRAT scores can be explained by average time. These results indicate that exam performance and average IRAT and TRAT performance cannot be predicted by average time spent on the case.
Similar results were found in Omaha and Phoenix with respect to average IRAT performance being significantly related to exam performance, with a larger effect on exam performance on the Omaha campus. Average TRAT performance was not significantly related to average time in Omaha, but it was in Phoenix albeit a low coefficient of determination. There was not a significant relationship between IRAT results and average time on either campus.
Though previous research has found a relationship between TBL participation and IRAT scores, participation was defined as the amount of time a student spoke during the activity [2]. Given CUSOM’s use of CBL as pre-work for TBL, we considered time spent in CBL as an alternative variable that may be comparable to participation in the classical TBL model. Though student participation and time spent in CBL cannot be directly equated, it is assumed that the longer a group spends completing CBL, the greater the amount of participation of the students in the group. Therefore, we expected to see a relationship between performance and time spent in CBL. However, our data demonstrated no relationship between time spent on CBL and individual performance on TBL and exams. Therefore, it cannot be assumed that case time will act as a strong predictor of assessment performance.
Faculty and educators at CUSOM have made efforts to improve the quality and experience of the CBL’s, often focusing on the time and experience of the CBL. This research indicates that increasing time spent in the CBL may not have an impact on students. Our data suggests that there is no correlation between time spent completing CBL and performance on IRAT and exam questions. Though a relationship was found between time spent completing CBL and performance on TRAT at the Phoenix campus, it explains very little of the variation in TRAT scores. This would indicate that setting protocols relating to time may not provide any direct benefit to student academic performance. Future research should consider the time students spend studying outside of CBL and TBL. It is possible that students who move through the CBL at a faster pace spend more time individually studying as preparation for TBL and, therefore, perform just as well as groups who engaged in more discussion throughout CBL. Future research could help to refine the understanding of the relationship between time and performance.
This study was conducted at a single institution. While this limits generalizability, this research also provides a framework for future research in this area. Some case times were missing from the data; z-score mean imputation was used to counter this issue. Results are limited to the group time submitted in the CBL, and it is possible that some individuals would have spent more or less time engaged with the material. There are many other aspects to CBL and TBL that may also influence performance, which could not be studied in this particular study, including but not limited to, student background knowledge, English as a second language, student participation in both CBL and TBL, and preferred learning method.
Overall, our findings suggest that there is a relationship between performance on TBL and exam performance. Our data supports previous literature indicating better course performance stemming from these active learning methods [1, 2, 9]. We found no statistical relationship for time spent on CBL and related assessment performance, which may provide valuable feedback to medical educators on the use of CBL and TBL in preclinical medical education.
留言 (0)