
記住我


Gregarious desert locusts, Schistocerca gregaria (Forskal), were reared under crowded conditions as described previously [14, 49]. In brief, the animals were kept in metal cages (50 × 50 × 50 cm) with a light cycle of 12L:12D. The temperature was 34 °C during the day and 27 °C at night. The locusts were fed with fresh wheat seedlings and oat flakes.
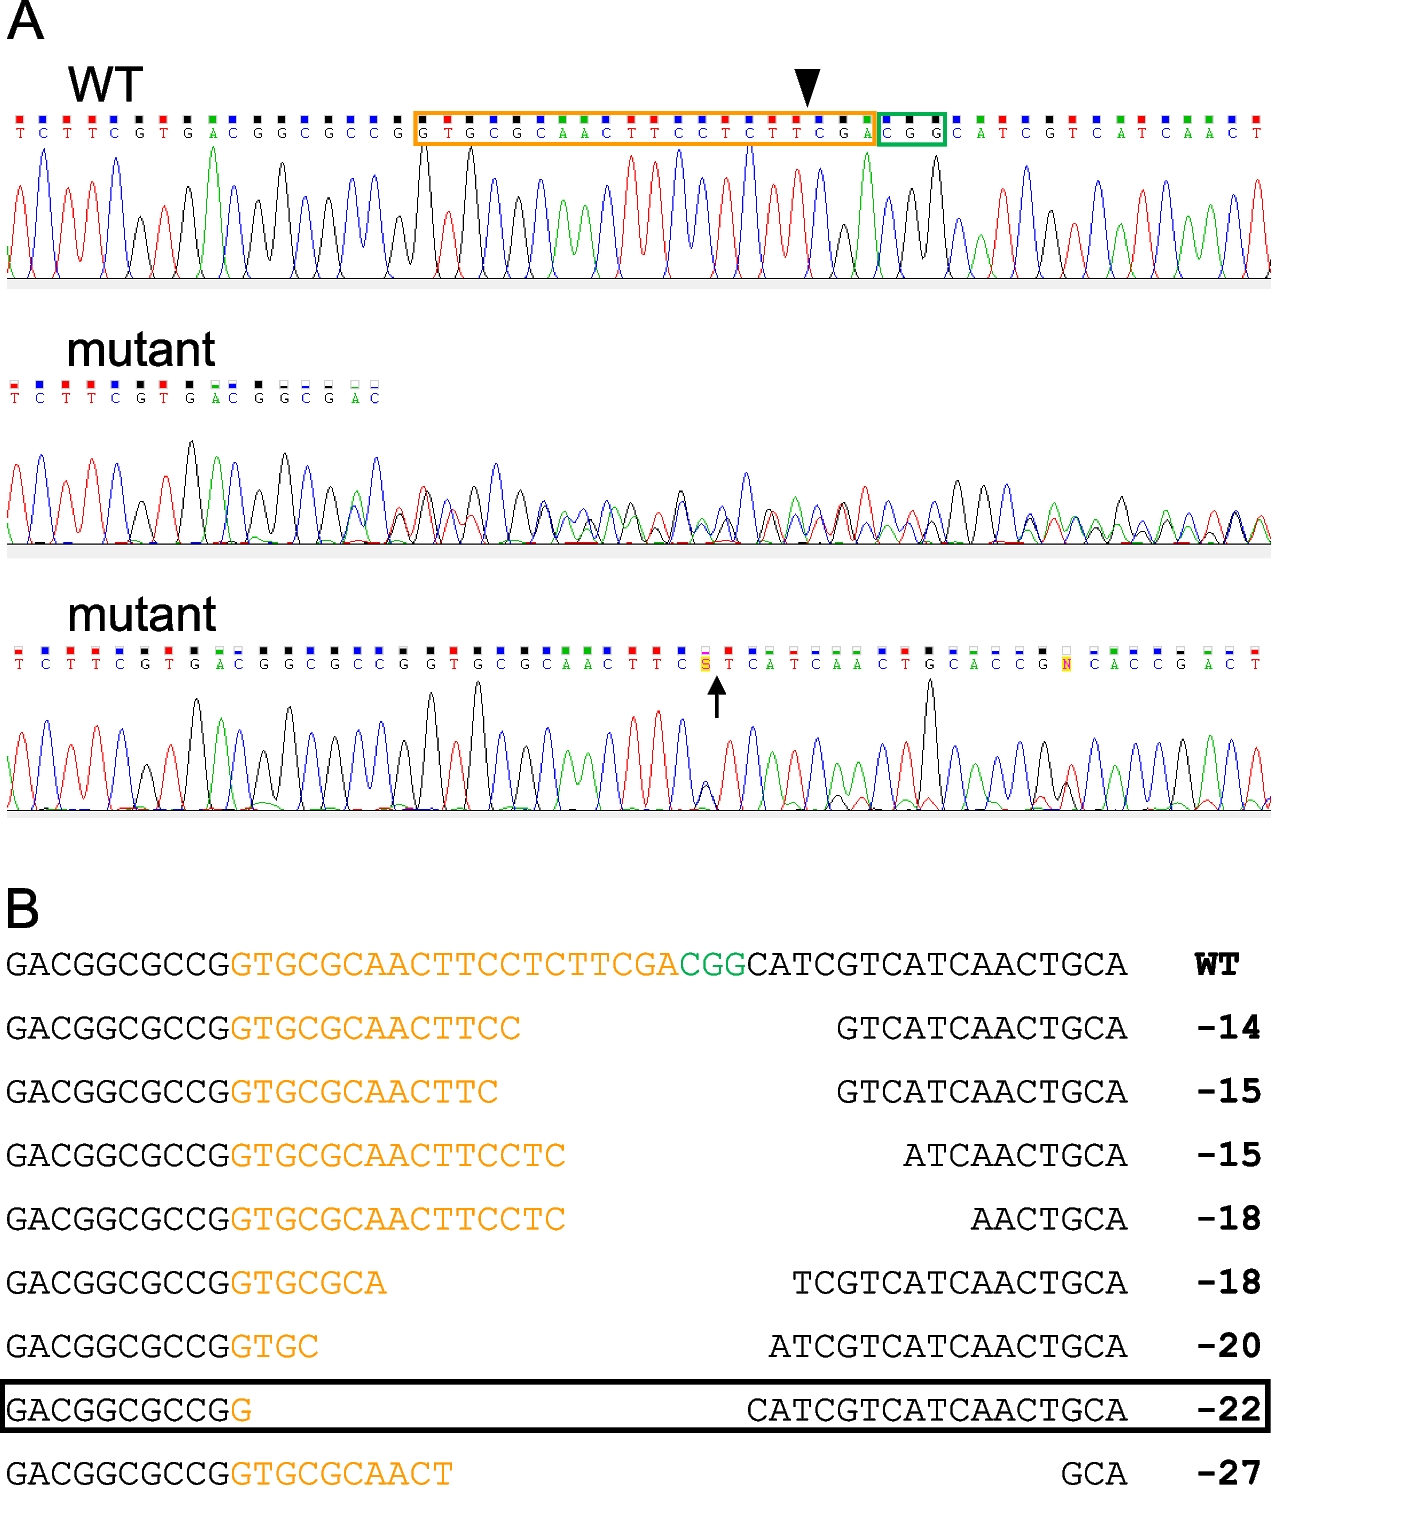
Design of guide RNAEmploying a draft genome of S. gregaria [69] available via ORCAE (http://bioinformatics.psb.ugent.be/blast/moderated/?project=orcae_Schgr), the nucleotide sequence encoding the S. gregaria SNMP1 protein (GenBank/NCBI: KU659599.1 and XM_049985376.1) was used as a query for a BLAST analysis (program: blastn; database: Schgr_genome). This bioinformatic approach revealed that the coding sequence of S. gregaria SNMP1 is derived from nine exons in total. A fragment of 20 nucleotides (5′-GTGCGCAACTTCCTCTTCGA) situated directly upstream of a (potential) PAM site (5′-CGG) in exon 4 was chosen as guide RNA (Additional file 1: Fig. S1). This selected sequence motif was submitted to the Sigma-Aldrich/Merck custom CRISPR service (Merck, Darmstadt, Germany) for synthesis of a single-guide RNA that includes both the guide RNA and a Cas nuclease-recruiting sequence (tracrRNA); the latter sequence was provided by the manufacturer. With the guide RNA sequence used for CRISPR/Cas-mediated generation of mutants, we screened the genome of S. gregaria for potential off-target sites utilizing the Cas-OFFinder tool (http://www.rgenome.net/cas-offinder/), an algorithm for identifying off-target sites of Cas9 RNA-guided endonucleases [70]. With this program, no off-target sites were found in the reference genome of S. gregaria (submitted GenBank assembly/NCBI: GCA_023897955.2) when no or only one mismatch was allowed. Considering up to three mismatches, three possible off-target sites were detected in the genome of the desert locust. Importantly, they were all located outside of annotated genes.
Generation of mutant locustsAdult male and female desert locusts were kept together, and the females were allowed to lay their eggs in plastic cups (about 10 cm high) filled with humid sand. When locusts were observed to lay eggs, the eggs were immediately taken out of the sand and cleaned with Ringer solution (9.82 g/l NaCl; 0.48 g/l KCl; 0.19 g/l NaH2PO4; 0.25 g/l NaHCO3; 0.73 g/l MgCl2; 0.32 g/l CaCl2; pH 6.5). Eggs were isolated and placed on a filter paper (MN 640 we ashless; Macherey–Nagel, Düren, Germany) covering an agarose plate [1% agarose (Genaxxon Bioscience, Ulm, Germany) dissolved in deionized water]. Next, lyophilized Cas9 enzyme (Sigma-Aldrich, St. Louis, MO, USA) was reconstituted as recommended by the manufacturer and diluted with the supplied dilution buffer to a final concentration of 400 ng/µl. The single-guide RNA was reconstituted and diluted in deionized H2O to achieve a final concentration of 150 ng/µl. Subsequently, 50 µl of the Cas9 solution was mixed with 50 µl of the single-guide RNA-containing solution before this mixture was injected into eggs (not later than 30 min after laying) using a Femtojet electronic microinjector (Eppendorf, Hamburg, Germany) and glass capillaries. For preparing the capillaries, capillary tubes (3–000-203-G/X, 1.14 mm outer diameter × 3.5 inches length; Drummond Scientific, Broomall, PA, USA) and a horizontal Pul-1 micropipette puller (World Precision Instruments, Sarasota, FL, USA) were utilized (settings: 4 for “delay” and 9 for “heat”). For injection, the capillary was filled with a few microliters of the solution containing Cas9 and the single-guide RNA. Injection was carried out for 0.1 s with an injection pressure (pi) of 600–700 hPa and a compensation pressure (pc) of 60–70 hPa. Subsequently, injected eggs were placed on a filter paper covering a 1% agarose plate. The plate was covered with a lid and kept in an incubator at 30 °C until hatching. Approximately 14 days after injection, nymphs hatched from the eggs and grew into adults (generation G0).
To screen for mutations in exon 4 of the SNMP1 gene, genomic DNA was prepared from the distal part of the wings of adults of generation G0. The tissue was cut into small pieces and incubated for 30 min at 95 °C and 350 rpm in 45 µl of 50 mM NaOH using a thermomixer (Eppendorf). After adding 5 µl of 1 M Tris–HCl (pH 8.5), the supernatant containing the genomic DNA was transferred into a new reaction tube and stored at 4 °C. For subsequent PCR amplification, a forward primer (5′-CTGCTGACCCTGGAGCGCGACAAG) and a reverse primer (5′-TCGCCCTCGCGCTTGAGCTCCTTG) were utilized, matching to the 5′ and the 3′ end of exon 4 of the SNMP1 gene, respectively (all oligonucleotide primers used in this study for PCR amplification were ordered from Biomers.net, Ulm, Germany). PCR reactions were prepared using 39.5 μl H2O, 5 μl 10 × Titanium Taq PCR Buffer (Takara Bio, Saint-Germain-en-Laye, France), 1 μl 10 mM 2'-deoxynucleoside 5'-triphosphate (dNTP) solution mix (New England Biolabs, Ipswich, MA, USA), 0.5 μl 100 μM forward primer, 0.5 μl 100 μM reverse primer, 3 μl genomic DNA, and 0.5 μl 50 × Titanium Taq DNA polymerase (Takara Bio). Thermocycling conditions were 1 min at 97 °C succeeded by 35 cycles at 97 °C for 30 s and 3 min at 68 °C. The final cycle was followed by a 3-min incubation at 68 °C. Next, PCR products were visualized using agarose gel electrophoresis and ethidium bromide staining. Amplicons with the expected size of ~ 200 bp were purified using the Monarch DNA gel extraction kit according to the instructions of the manufacturer (New England Biolabs) and sent to Microsynth (Balgach, Switzerland) for Sanger sequencing. If sequencing led to an electropherogram not identical to WT controls (Fig. 1A), the relevant animals of the G0 generation were considered potential mutants for SNMP1 and were allowed to mate individually with a WT conspecific of the opposite sex. Animals of the resulting G1 generation were analyzed for mutations as described above. Purified PCR products from the G1 generation were cloned into the pGEM-T easy plasmid (Promega, Madison, WI, USA) and subjected to sequencing and detailed sequence analysis. Heterozygous G1 individuals carrying a given 22-bp deletion in exon 4 of the SNMP1 gene (Fig. 1B) were mated with each other to obtain a G2 generation. Animals of the G2 generation homozygous for the above-described 22-bp deletion were identified by PCR with genomic DNA and the aforementioned primers followed by direct sequencing of the PCR product; such individuals were used to establish the homozygous SNMP1−/− line.
ImmunohistochemistryWith a few modifications, immunohistochemical experiments were conducted as described recently [49, 71]. Antennae were surgically removed from adult male S. gregaria of the WT and the SNMP1−/− line and frozen onto a specimen chuck at − 57 °C in Tissue-Tek O.C.T. Compound (Sakura Finetek, Alphen aan den Rijn, The Netherlands) on the cryobar of a Cryostar NX50 cryostat (Thermo Fisher Scientific, Waltham, MA, USA). Longitudinal antennal sections (12 μm thick) were prepared with the cryostat at a chamber temperature of − 25 °C (temperature of the object head: − 10 °C). Antennal sections were immediately thaw-mounted on Epredia SuperFrost Plus adhesion slides (Thermo Fisher Scientific) and stored at − 25 °C until they were encircled with a colorless ROTI Liquid Barrier Marker (Carl Roth, Karlsruhe, Germany). For fixation, sections were incubated in 4% paraformaldehyde dissolved in PBS (0.85% NaCl; 1.4 mM KH2PO4; 8 mM Na2HPO4; pH 7.4) supplemented with 0.1% Triton X-100 at 4 °C for 22 min. Next, sections were washed at room temperature twice in PBS for 5 min and in PBS supplemented with 0.01% Tween 20 for 5 min. Subsequently, sections were rinsed in 50 mM NH4Cl (dissolved in PBS) for 5 min and in PBS for 5 min. Following a 30-min incubation at room temperature in blocking solution (10% normal goat serum and 0.5% Triton-X100 in PBS), the sections were incubated overnight at 4 °C (in a humid box) with a primary antibody raised in rabbit against the extracellular domain of SNMP1 from S. gregaria [49]. For this incubation, the antibody against SNMP1 was diluted 1:500 in blocking solution. After washing the slides three times for 5 min with PBS, secondary detection was carried out for 1 h at room temperature (in a humid box) with a goat anti-rabbit AF488-conjugated secondary antibody (Jackson ImmunoResearch, Ely, United Kingdom) diluted 1:1000 in PBS. The solution containing the secondary antibody was supplemented with 2 µg/ml of the nuclear stain DAPI (4′,6-diamidino-2-phenylindole). Finally, the slides were washed three times for 5 min in PBS and then mounted in Mowiol solution (20 g Mowiol 4–88, 80 ml PBS, 40 ml glycerol, 2.4 g propylgallat).
Immunohistochemical staining experiments were analyzed with a Leica DMi8 microscope (Leica Microsystems, Wetzlar, Germany). Images were processed using the LAS X software (Leica Microsystems).
Western blotAntennae of WT and SNMP1−/− adults were frozen in liquid nitrogen and homogenized using a mortar and a pestle cooled down with liquid nitrogen. The homogenates were mixed in fresh reaction tubes with four times the volume of lysis buffer. Prior to use, 100 ml of lysis buffer (50 mM Tris–HCl pH 7.4; 150 mM NaCl; 1 mM EDTA; 1% Triton X-100; 5% glycerol) was supplemented with one tablet of SigmaFAST protease inhibitor cocktail (Merck). The samples were then incubated on an overhead shaker at 4 °C for 5 h, followed by centrifugation at 5000 g and 4 °C for 10 min. The supernatant was used for sodium dodecyl sulfate–polyacrylamide gel electrophoresis (SDS-PAGE) and subsequent Western blot analysis. To this end, an aliquot containing 10 µg (or 5 or 15 µg) of the extracted total protein was mixed with an appropriate volume of 5 × sample buffer (0.3 M Tris pH 6.8; 50% glycerol; 0.02% bromophenol blue; 2.5% SDS; 10% β-mercaptoethanol), heated for 5 min at 90 °C and loaded on a lane of a 12% polyacrylamide gel (supplemented with 0.1% SDS). Electrophoresis of two identically loaded gels was run in parallel before one of them was stained with Coomassie blue (upper panel in Additional file 9: Fig. S8), while the proteins in the other gel were electroblotted for 1 h at 200 mA onto a methanol-treated PVDF membrane (Carl Roth) soaked in transfer buffer (25 mM Tris; 192 mM glycine; 20% methanol) using a semi-dry blotting device. Subsequently, the membrane was treated for 1 h with 7% milk powder in TBST (100 mM Tris; 150 mM NaCl; pH 7.5; 0.05% Tween 20) prior to overnight incubation at 4 °C in the SNMP1 antibody diluted 1:1000 in TBST supplemented with 3.5% milk powder. After washing the membrane three times for 10 min in TBST, it was incubated for 1 h at room temperature in alkaline phosphatase-conjugated goat anti-rabbit antibody (Thermo Fisher Scientific) diluted 1:10,000 in TBST with 3.5% milk powder. Next, the membrane was washed three times for 10 min in TBST and twice for 10 min in substrate buffer (100 mM Tris–HCl pH 9.5; 100 mM NaCl; 5 mM MgCl2). Finally, the membrane was incubated for 2 h in substrate buffer containing 25 µg/ml nitro blue tetrazolium (NBT) and 50 µg/ml 5-brom-4-chlor-3-indolyl phosphate (BCIP) (lower panel in Additional file 9: Fig. S8). The color reaction was stopped by a 5-min incubation in H2O.
RNA isolation and cDNA synthesisTwenty antennae from adult (female or male) WT or SNMP1−/− locusts were dissected and immediately frozen in liquid nitrogen. The tissue was homogenized on ice in 1 ml Trizol reagent (Thermo Fisher Scientific) for 8 min with a Dounce homogenizer, a Teflon pestle, and a stirring unit. Extraction of total RNA using Trizol reagent was conducted according to the manufacturer’s protocol. Total RNA was finally resuspended in 20 µl H2O, and the concentration of RNA was determined using an Epoch microplate spectrophotometer (BioTek, Winooski, VT, USA). To eliminate contaminating genomic DNA, 18 µl of the RNA-containing solution were mixed with 2 µl of 10 × DNase I reaction buffer and 1 µl of RNase-free DNase I (New England Biolabs) and incubated for 30 min at 37 °C.
For the isolation of poly(A)+ RNA from total RNA, magnetic Dynabeads coupled with Oligo(dT)25 (Thermo Fisher Scientific) were used in conjunction with a MagneSphere magnetic separation stand (Promega). Before extracting poly(A)+ RNA with Dynabeads, the beads were washed. To this end, depending on the amount of total RNA, a given amount of Dynabeads were washed as recommended by the supplier (Thermo Fisher Scientific): for 75 µg of total RNA, 100 µl of Dynabeads was used for washing. Finally, the washed beads were resuspended in a total of 20 µl of binding buffer (20 mM Tris–HCl pH 7.5; 1 M LiCl; 2 mM EDTA). The 21 µl of total RNA treated with DNAse I were heated to 65 °C for 2 min and placed on ice immediately. Next, 20 µl of washed and resuspended Dynabeads was added before the mixture was rotated for 5 min at room temperature. The tube was placed on the magnetic stand for 30 s, and the supernatant was transferred to a novel tube (tube A) on ice. Dynabeads with bound poly(A)+ RNA were washed twice using wash buffer B (10 mM Tris–HCl pH 7.5; 0.15 M LiCl; 1 mM EDTA). After removing wash buffer B, the beads were resuspended in 10 μl H2O and incubated at 65 °C for 2 min. Subsequently, the tube was directly placed on the magnetic stand for 30 s, and the supernatant containing the poly(A)+ RNA was quickly transferred to a new tube (tube B) on ice. The beads were then resuspended in the solution from tube A before being rotated for 5 min at room temperature. The tube was placed on the magnetic stand for 30 s, and the supernatant was discarded. The Dynabeads were again washed twice with wash buffer B and resuspended in 10 μl H2O. Following a 2-min incubation at 65 °C, the supernatant was taken using the magnetic stand and quickly transferred to tube B. The concentration of the isolated poly(A)+ RNA in tube B was determined with an Epoch microplate spectrophotometer.
First-strand cDNA synthesis was conducted with 100 ng of poly(A)+ RNA supplemented with 1 µl 100 µM Oligo(dT)20 primer, 2 µl 10 mM dNTP solution mix (New England Biolabs), and H2O to a final volume of 27 µl. Following 5 min at 65 °C, the samples were placed on ice, and 8 µl 5 × SSIV buffer (Thermo Fisher Scientific), 2 μl 100 mM 1,4-dithiothreitol (DTT; Thermo Fisher Scientific), 2 µl RNaseOUT recombinant ribonuclease inhibitor (Thermo Fisher Scientific), and 1 µl Superscript IV reverse transcriptase (Thermo Fisher Scientific) were added. Synthesis of cDNA was carried out at 52 °C for 50 min, followed by 10 min at 80 °C.
Reverse transcription PCRTo analyze SNMP1-encoding nucleotide sequences in antennal cDNA of adult WT and SNMP1−/− animals, the forward primer 5′-TACAAGCAGAAGGTGAAGCTGCGG (matching exon 3 of the SNMP1 gene) and the reverse primer 5′-TCCGCCTTGCGCTCCCAGTTCGCG (matching exon 6 of the gene encoding SNMP1) were used. PCR reactions were prepared utilizing 42 μl H2O, 5 μl 10 × Titanium Taq PCR buffer, 1 μl 10 mM dNTP solution mix, 0.5 μl 100 μM forward primer, 0.5 μl 100 μM reverse primer, 1 μl antennal cDNA, and 0.5 μl 50 × Titanium Taq DNA polymerase. Thermocycling conditions were identical to those described above for the PCR amplification of genomic DNA. An aliquot of the PCR product was analyzed by gel electrophoresis, and the rest was purified using the Monarch PCR & DNA cleanup kit as recommended by the manufacturer (New England Biolabs). The purified amplicon was finally eluted with 20 µl of H2O and sent for sequencing to Microsynth.
Quantitative PCRTo amplify sequences coding for SNMP1 in quantitative PCR reactions, the forward primer 5′-CTCGCACTGGAGGAGAAGTACGTG and the reverse primer 5′-GGAGTGTCCAGGGCTAGTATCTG were used, resulting in a PCR fragment of 256 bp. For the amplification of the housekeeping gene GAPDH (GenBank: KU251430.1) that served as reference gene, the forward primer 5′-ATTGTTGAAGGTCTGATGACAACAG and the reverse primer 5′-TCCAGTTGATGCTGGAATAATGTTC were applied, leading to an amplicon of 230 bp. GAPDH is a useful reference gene for the normalization of expression in tissue from adult S. gregaria [53].
PCR reactions were conducted in a 10-μl reaction volume with 5 µl of Powerup SYBR green master mix (Thermo Fisher Scientific) and 3 µl of the cDNA template to which sense and antisense primers as well as H2O were added. Reactions were run in duplicate on a Quantstudio 3 real-time PCR system (Thermo Fisher Scientific) utilizing the following thermal cycling profile: 50 °C (for 2 min), 95 °C (for 2 min), followed by 40 steps of 95 °C for 15 s, 57 °C for 15 s, and 72 °C for 1 min. Subsequently, melting curve analyses were performed by running samples with the dissociation protocol (95 °C for 1 min, 60 °C for 1 min, and 95 °C for 15 s) to assess that quantitative PCR assays have only produced a single amplicon and that primer dimers have not been formed. In all quantitative PCR experiments, negative controls (H20 was added instead of cDNA) were routinely run, and in these samples, no amplification of the fluorescence signal was observed. Raw data were recorded and analyzed with the Quantstudio design and analysis software v1.5.1 (Thermo Fisher Scientific) and were exported to Microsoft Excel for further evaluation.
In initial experiments with serial (10 ×) dilutions of antennal cDNA, standard curves for the gene transcripts were generated. Using different primer concentrations, it turned out that for SNMP1 and GAPDH, a 200 nM concentration of the sense and the antisense primer led to optimal values for PCR efficiency (E) and the coefficient of determination (R2).
Based on the CT values determined in quantitative PCR experiments, ∆CT values (∆CT = CTSNMP1 − CTGAPDH; [72]) and gene expression fold changes (relative expression) were calculated. For determining the relative expression, the method established by Pfaffl [54] was used since it provides efficiency correction. Two-tailed p-values for ∆CT and the relative expression were calculated with GraphPad Software (San Diego, CA, USA) using an unpaired t-test (https://www.graphpad.com/quickcalcs/ttest1/). For the relative expression, the determined values were compared to 1 (i.e., no change in expression).
Measuring the length of antennaeThe right antennae of 10 randomly selected adult males of both the WT and the SNMP1−/− strain were cut off directly at the base of the antenna and the length was determined. The statistical analysis was performed using a two-sided Wilcoxon rank-sum test (https://www.statskingdom.com/170median_mann_whitney.html).
Preparation of pipettes for stimulation in EAG experimentsPAN (purity 98%; Sigma-Aldrich) was dissolved in different concentrations in the solvent n-hexane (purity 95%; Applichem, Darmstadt, Germany). Linalool (LIN) (purity 97%; order number: L2602; Sigma-Aldrich) was diluted in dimethyl sulfoxide (DMSO; purity ≥ 99.5%; Sigma-Aldrich). In order to apply defined chemical stimuli in EAG experiments, the tip of glass Pasteur pipettes (150 mm; Neolab Migge, Heidelberg, Germany) was sealed with Parafilm M (Sigma-Aldrich) before inserting a round Whatman 40 filter paper (Sigma-Aldrich) on which 10 µl of the PAN- or LIN-containing solution or the solvent was pipetted. Thus, filter papers were loaded with 1, 20, 50, 75, or 100 µg of PAN or 1, 50, or 100 µg of LIN. After letting the solvent evaporate for 1 min, pipettes were sealed at their end with Parafilm M (Sigma-Aldrich).
EAG recordingsFor the EAG recordings, the measurements were carried out with technical equipment from Syntech (Kirchzarten, Germany) following the manufacturer’s recommendations (https://www.ockenfels-syntech.com/wp-content/uploads/EAGpract_man_fin) with slight modifications. In brief, the electrode holders were equipped with a 0.5-mm (diameter) silver electrode wire (order number: 265586; Sigma-Aldrich) chlorinated in 0.01 N HCl at 4.5 V directly before use. For preparing glass micropipettes, capillary tubes (GB150T-8P; Science Products, Hofheim, Germany) were pulled using the horizontal Pul-1 micropipette puller (settings: 1 for “delay” and 1 for “heat”), and the capillary tip was trimmed with scissors to an inner diameter that allowed insertion of the antennal base or tip. Glass micropipettes were filled with Schistocerca saline (9.82 g/l NaCl; 0.48 g/l KCl; 0.73 g/l MgCl2*6H20; 0.47 g/l CaCl2*6H2O; 0.95 g/l NaH2P04*2H2O; 0.18 g/l NaHCO3; pH 7.2 with NaOH; after [73]), assembled with the electrode holders and then with a Syntech micromanipulator and a Syntech EAG combi probe. The EAG combi probe was connected to the Syntech data acquisition controller IDAC-232, which was interconnected with a computer.
The right antenna of mature male locusts was excised and inserted between two glass micropipette electrodes. Using a Syntech CS-01 stimulus controller unit and a glassware humidifier, a continuous and humidified airstream of 7 ml/s was directed towards the antenna through a mixing tube, with the end of the tube placed 0.5 cm from the center of the antenna. For antennal stimulation, the Parafilm sealing was removed from a glass Pasteur pipette containing a round filter paper loaded with PAN or LIN solution or the solvent. The pipette tip was immediately inserted into a hole of the mixing tube to apply a 500-ms single puff into the airstream using the CS-01 stimulus controller. Each antenna was stimulated in a first series consecutively with the solvent and the different amounts of PAN or LIN in intervals of 1 min. In a second series, this procedure was repeated with the same antenna. The order of PAN or LIN stimuli was varied between different antennae. The antennal EAG responses were recorded using the Syntech EAG software. Raw data were exported to Microsoft Excel for further analysis. For each antenna, the measured value for the amplitude evoked by the solvent was subtracted from the amplitude values induced by the different PAN or LIN amounts. With the resulting values, for each amount of PAN or LIN, the mean was calculated based on the two technical replications. To analyze statistical significance, two-tailed p-values were determined with an unpaired t-test (https://www.graphpad.com/quickcalcs/ttest1/).
Preparation of pipettes for stimulation in recordings with single sensillaPAN was diluted in DMSO in different dilutions (1:10, 1:100, or 1:1000). Ten microliters of diluted PAN was loaded on a round piece of filter paper (~ 1 cm2) that was inserted in a glass Pasteur pipette. For stimulation with only the solvent, 10 µl of DMSO was applied to the filter paper.
SSR experimentsIn essence, SSR were conducted as recently described for migratory locusts [11]. Mature male desert locusts were inserted into 5-ml pipette tips, the point of which had previously been cut off to allow the head and the antennae to protrude out of the tips. Dental wax was used to immobilize the abdomen and the head of locusts in the tip as well as for attaching the tip, the head (the dorsal side downwards), and the antennae to a glass coverslip. Electrolytically sharpened tungsten wires served as electrodes, with the reference electrode inserted into the eye. Upon inspection with a microscope (BX51WI; Olympus, Shinjuku, Japan), the recording electrode was inserted into the base of a basiconic sensillum. Extracellular electrical signals were recorded, amplified (Syntech Universal AC/DC Probe; Syntech), sampled (96,000 samples/s), and band-pass filtered (300 to 3000 Hz with 50/60-Hz suppression) via a Syntech IDAC-4 acquisition controller connected to a computer. Spikes were extracted using version 3.7 of AutoSpike software (Syntech). For the detection of spikes with the AutoSpike software, the default settings of the program were used (detection time of 0.5 to 3 ms and a minimum amplitude of 10). Only spikes that were detected using these parameters were considered for further analysis.
Stimuli (PAN or the solvent DMSO) were delivered by inserting the tip of the pipette into a humidified and constant airstream flowing at 800 ml/min through an 8-mm inner diameter stainless steel tube ending 1 cm from the antenna. A 0.5-s single puff was applied into the airstream using a CS-55 stimulus controller (Syntech). Neuronal responses from basiconic OSNs were recorded for 10 s, starting 3 s prior to the stimulation period of 0.5 s. Basiconic sensilla were stimulated with DMSO and subsequently with PAN. For the calculation of PAN-elicited responses, only the spike rates 0.55 s before and 0.55 s after the onset of stimulation were considered. To calculate the PAN-induced spike rate, the spike rate before PAN stimulation (0.55 -s window) was first subtracted from the spike rate after PAN stimulation (0.55 -s window). Next, the DMSO-induced spike rate was determined by subtracting the spike rate before DMSO stimulation (0.55 -s window) from the spike rate after DMSO stimulation (0.55 -s window). Finally, the corrected PAN-induced spike rate was calculated by subtracting the DMSO-evoked spike rate from the PAN-induced spike rate. These corrected responses were multiplied by 1.81 to obtain the number of spikes per second. With the resulting values, the mean was calculated for each PAN concentration tested. To analyze statistical significance, two-tailed p-values were determined with an unpaired t-test (https://www.graphpad.com/quickcalcs/ttest1/).
Preparation for functional calcium imaging of PNsCalcium imaging was conducted following a recently established protocol and analysis pipeline to assess the responses of PNs in the AL upon odorant exposure [74]. In brief, PNs from sexually mature SNMP1−/− and WT male locusts were retrogradely loaded with a dextran-conjugated calcium indicator (Cal-520-Dextran Conjugate MW 10,000; Biomol, Hamburg, Germany). For the procedure, a frontal incision was made between the compound eyes of an anesthetized and restrained locust to expose the brain around the injection site. Next, a crystal of the calcium indicator was injected into the medial calyx of the mushroom bodies using a glass capillary, and the head capsule was sealed with a drop of eicosane (Sigma-Aldrich) to prevent desiccation. After 12 h of incubation at 15 °C in a humid chamber, dye-injected specimens were prepared for imaging by removing the eicosane and by gently relocating the antennae ventrally to expose the AL. Finally, the recording site was covered with a translucent silicone (Kwik-Sil; World Precision Instruments).
Functional confocal imaging and stimulation with odorantsFunctional imaging was conducted with a laser scanning confocal microscope (LSM 510; Carl Zeiss Microscopy, Oberkochen, Germany) equipped with a Chameleon Ultra Ti:sapphire two-photon laser (Coherent, Santa Clara, CA, USA) and a water immersion objective (W Plan-Apochromat 20 × /1,0 DIC VIS-IR; Carl Zeiss Microscopy). Optical sections of the AL, centered around the layer harboring most of the somata of the PNs (approximately 35 µm beneath the surface of the AL), were acquired at 1 frame per second (fps) with a spatial resolution of 0.77 μm/px (x, y) and a full-width half maximum of 25 μm (z). For odorant stimulation, the ipsilateral antenna of tested preparations was placed inside the outlet (Teflon tube with an inner diameter of 0.87 mm) of a custom-built olfactometer [75]. The olfactometer controlled valves that diverted the flow to either a vial containing 200 μl of a diluted odorant or to clean air. Each individual was tested with PAN and LIN (both in mineral oil at dilutions of 1:10 and 1:100) and with the solvent (mineral oil) in a pseudo-random order. Stimulus pulses were 2 s long, and consecutive stimuli were separated by 2-min intervals. Odorants were prepared daily before the experiments and checked for consistency by a photoionization detector (Mini-PID model 200A; Aurora Scientific, Aurora, Ontario, Canada).
Analysis of functional imaging dataAcquired imaging sequences (3D stack of images x–y-time) were processed and analyzed via a custom-written Matlab code (R2023a; The MathWorks, Natick, MA, USA), as previously described [74]. In brief, after preprocessing to reduce photon noise, motion, and bleaching corrections, stacks of the same stimulus set were prepared for analysis. Data were filtered by a 3-frame box-shaped kernel in the temporal domain, and the relative change in fluorescence (ΔF/F0 = (F − F0)/F0) was calculated with F0 being the mean pre-stimulus baseline activity during the 4 s prior to the stimulus. Finally, the response to the solvent was subtracted from each stack. Using a customized iterative segmentation algorithm (CalciSeg; https://github.com/YannickGuenzel/CalciSeg; [74]), we automatically segmented the AL of each preparation into regions of activity representing individual PNs (regions where activity changes similarly over time and across stimuli). Upon successful completion of the procedure, all valid regions (PNs) were automatically classified as 'responding' or 'non-responding' to each stimulus using Otsu's method for each mean intensity projection [76]. For statistical analyses of calcium imaging experiments, p-values were determined either by a paired two-sided Wilcoxon signed rank test using the signrank function of the Matlab software or by an unpaired two-sided Wilcoxon rank-sum test utilizing the ranksum function of the Matlab software.
Re-pairing and mate choice assaysBehavioral experiments were performed similar to previously published protocols [13] using sexually mature locusts in small observation cages (10 × 10 × 20 cm). Experiments were conducted between noon and 6 pm.
In re-pairing assays, a pair of WT or SNMP1−/− locusts was placed in a cage. For the experimental group, pairs were separated before 1 µl of 10% PAN [v/v in dichloromethane (CH2Cl2); Applichem] was applied to the pronotum of the females. Females of the control group were also segregated but received no treatment. After reunification, the re-pairing status was monitored every 30 min. Observations were terminated after 120 min. Similarly, a further control experiment using only pairs of WT locusts was conducted to assess potential effects of the solvent CH2Cl2 on re-pairing. In the latter approach, females were either painted with 1 µl CH2Cl2 or left untreated. For re-pairing assays, the percentage of couples that re-paired was determined. To calculate p-values (both tails), absolute numbers (i.e., raw numbers) of re-paired and unpaired couples were used in a Fisher's exact test (https://quantpsy.org/fisher/fisher.htm).
In mate choice assays, to a pair of WT or SNMP1−/− locusts, another female (♀2) from a second pair of the same genotype was added. The original female (♀1) was treated with 1 µl of 1% or 10% PAN (v/v in CH2Cl2) and then returned to the cage. The second female (♀2) remained untreated; only its wings were slightly clipped to distinguish it from the original female. Assays were run until the male paired with one of the two females. If no pairing occurred within 30 min, the observations were terminated to prevent the experiments from being affected by the evaporation (i.e., decrease in concentration) of PAN. The p-values were calculated utilizing a calculator for a chi-square goodness of fit test (https://www.socscistatistics.com/tests/goodnessoffit/default2.aspx). In this test, the absolute numbers (raw numbers) of males choosing either ♀1 or ♀2 were used. For the expected values, half of the total number of tested males was taken.
留言 (0)