
記住我

Insufficient reduction of (postprandial) blood glucose levels is strongly associated with the pathogenesis of obesity and chronic metabolic disorders such as type 2 diabetes mellitus and cardiovascular diseases (Blaak et al., 2012). High postprandial glucose levels are known to cause microvascular dysfunction (Aroda and Eckel, 2022), and are also a prevailing risk factor for cardiovascular mortality even in the healthy population (European Diabetes Epidemiology Group, 1999). This may in part be due to the enhanced postprandial insulin levels in response to impaired glucose tolerance (Pyörälä et al., 1998; Shen et al., 2022), emphasising the importance of preventing increased postprandial glucose levels and subsequent progressive development of prediabetic phenotypes. Interestingly, lowering postprandial glucose peaks seems to be the more relevant target than lowering average blood glucose levels/HbA1c with regard to cardiovascular disease prevention (Hanssen et al., 2020).
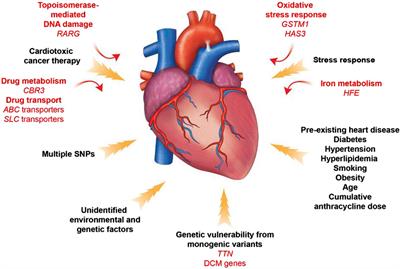
The blood glucose concentration is dependent on the postprandial absorption rate of glucose, the endogenous production of glucose, the uptake of glucose by the liver and peripheral tissues as well as the disposal of glucose (Wu et al., 2020). Among these, gastrointestinal responses to meal ingestion (i.e., gastric emptying, intestinal digestion and absorption, and the secretion of gastrointestinal hormones) are key determinants of postprandial glucose levels. In order to improve glycemic control, different strategies can be employed. These comprise lifestyle interventions such as the modulation of physical activity and diet, but also the prescription of (oral) hypoglycemic medications (Pasmans et al., 2022). Plant-based medications which are assumed to have benefits in availability, side effects, and financial issues over conventional (oral) antihyperglycemic drugs (Salehi et al., 2019), might be a promising and effective strategy as well. In this context, it should be emphasized that plant extracts are a complex mixture of putative bioactive compounds, that have the potential to act at multiple targets simultaneously, including various enzymes or transporters involved in the regulation of glucose homeostasis. Figure 1 summarizes the most important mechanisms by which plant extracts or plant-derived molecules may affect postprandial blood glucose levels.
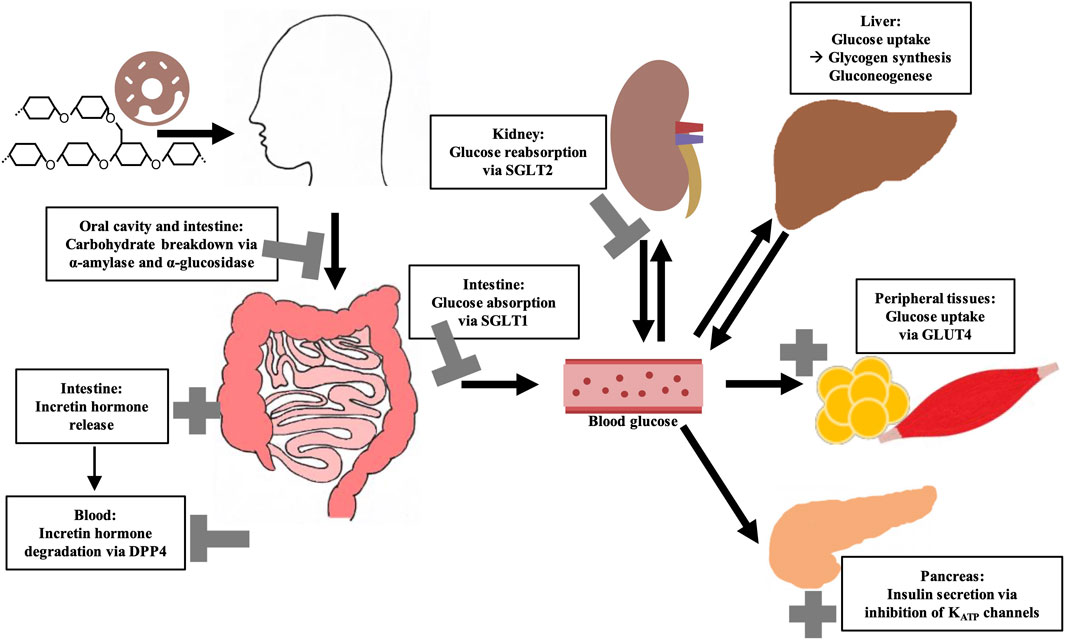
Figure 1. Overview of key regulatory elements of (postprandial) blood glucose regulation and their possible modulation by bioactive compounds from plant extracts. Sodium-dependent glucose transporter (SGLT); Glucose transporter 4 (GLUT4); Dipeptidyl peptidase 4 (DPP4).
Among the most frequently studied putative antihyperglycemic plant species are Morus alba L., Cinnamomum zeylanicum J. Presl, Trigonella foenum-graecum L., Phaseolus vulgaris L., Zingiber officinale Rosc., and Panax ginseng C.A.Meyer as recently summarized. On the one hand, this is due to the fact that the bioactive lead substances are identified here, such as phaseolamine from P. vulgaris, ginsenosides from P. ginseng or shogaol and gingerol from Z. officinale. On the other hand, these plant species are readily available, low cost and generally considered safe (Przeor, 2022). Interestingly, a combined formulation of M. alba, P. vulgaris and green coffee extract showed high potential to lower postprandial blood glucose and insulin concentrations in randomized, double-blind, placebo-controlled, cross-over experiments, which is attributed to the impact of bioactive compounds in the extracts on different regulatory pathways of glucose homeostasis (Adamska-Patruno et al., 2018). Figure 2 gives the structure of selected plant-derived compounds that are highly recognized for their putative antihyperglycemic effects, namely, 6-shogaol (Yi et al., 2019), berberine (Utami et al., 2023), eugenol (Srinivasan et al., 2014), 1-deoxynojirimycin (Ramappa et al., 2020), myricetin (Imran et al., 2021), and chlorogenic acid (Zuñiga et al., 2018).
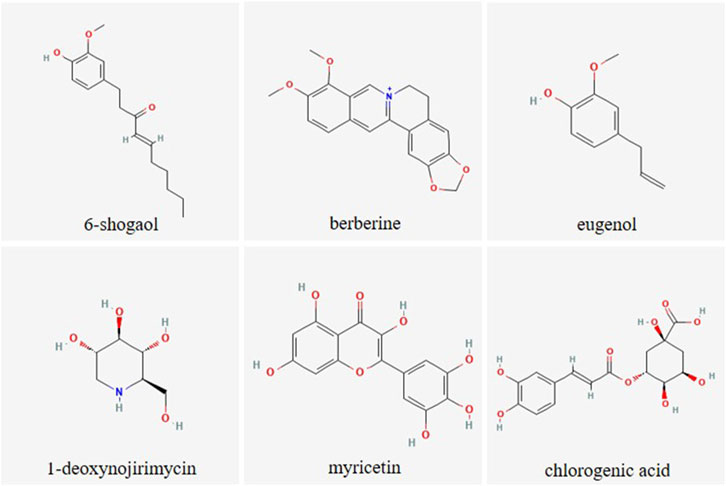
Figure 2. Chemical structure of selected plant-derived compounds with putative antihyperglycemic activity. The structures of 6-shogaol (PubChem CID: 5281794), berberine (PubChem CID: 2353), eugenol (PubChem CID: 3314), 1-deoxynojirimycin (PubChem CID: 29435), myricetin (PubChem CID: 5281672) and chlorogenic acid (PubChem CID: 1794427) were taken from PubChem (Kim et al., 2023)
However, there is a great effort in research to discover novel antihyperglycemic plants and their related bioactive compounds and to decipher their mechanisms of action, with the overall intention to identify even more potent plant-based compounds or combination of these. Collections of plant extracts, commonly established by biotechnology companies and academic research institutes, are a tremendous help when a large number of plant extracts should be screened (Onur et al., 2013; Potterat and Hamburger, 2014; Wilson et al., 2020). For example, the screening library established by the US National Cancer Institute is one of the most relevant with over 230,000 extracts (McCloud, 2010; Thornburg et al., 2018). The largest French extract library of the Institut de Chimie des Substances Naturelles contains approximately 14,000 extracts (Marinetti, 2018). Extracts from 4,000 different plant species can be purchased from the company PhytoPharmacon (PhytoPharmacon, n. d.). The German “Plant Extract Collection Kiel in Schleswig-Holstein” (PECKISH) is a screening library with over 4,500 extracts, which is distinguished by its open accessibility (Onur et al., 2013). In this context, well documented, extensive plant extract libraries can be used to generate tailored sub-libraries selecting extracts with specific properties, e.g., extracts based on plants from the same region, plant family or plant part. In this regard, the targeted use of plant root extracts derived from such libraries might be of particular interest. In general, the extensive use of plant roots and rhizomes is frequently described in the traditional medicine of various cultures worldwide (Bais et al., 2001), as for example, by traditional healers (called “root doctors”) in Angola (Novotna et al., 2020). Despite this, as indicated by reviews concerning antihyperglycemic activity of medicinal plant extracts, underground plant material is not as widely studied compared to the aerial parts (Bailey and Day, 1989; Arumugam et al., 2013; Mamun-or-Rashid et al., 2014; Ardalani et al., 2021; Kifle et al., 2022). At this point, it should be noted that the occurrence and concentration of bioactive compounds within a plant species can vary greatly depending on the plant part. For example, leaves apparently have the highest content of flavonoids (Hao et al., 2023) although these are also present in the roots. However, additional bioactive compounds, such as phenols, alkaloids, phytosteroids, saponins, tannins, terpenoids, anthraquinones, and cardiac glycosides, which are abundant in roots, make these plant parts particularly interesting (Ardalani et al., 2021). Moreover, roots are one of the most important plant organs for accumulating these active components (Li et al., 2020). A root-specific metabolism leads to uniquely synthesized compounds in the root system, which are generally considered to have great potential for pharmacological applications, such as forskolin (diterpenoid) or the shikonins (group of naphthoquinones) (Bais et al., 2001; Ardalani et al., 2021).
However, easy-to-use methods are crucial enabling plant (root derived) extracts to be screened for multiple targets. In addition, alternative in-vivo models capable of replacing classical rodent studies, while being without ethical concerns and less time-consuming, are becoming increasingly important.
In the first part of this review, major regulatory elements of glucose homeostasis that might be modulated by plant extracts are outlined. The currently used antihyperglycemic drugs are considered in context of these molecular targets. In the second part, a comprehensive methodological toolbox including in-vitro and in-vivo assays related to the regulatory elements is presented that enables screening and verification of plant (root) extracts and bioactive compounds with respect to their antihyperglycemic properties. The assays described herein cover well known standard methods (e.g., spectrophotometric determination of α-amylase and α-glucosidase activity) but also less common methods such as patch-clamp measurements for KATP channels. Likewise, the in-vivo assays presented, using hen’s eggs and Drosophila melanogaster (D. melanogaster) as model organisms, are not yet widely used in the context of blood glucose regulation. Advantages and limitations of the different methods are discussed. In particular, this extensive collection of assays could facilitate the systematic investigation of novel plant material for future research and further decipher their mechanisms of action. Finally, root extracts (which could be particularly interesting for research in the future, but have not yet received widespread attention) targeting the aforementioned glucose homeostasis pathways are summarized in particular.
2 Key regulatory elements of glucose homeostasis2.1 Dietary carbohydrate digestionThe diet usually contains a mixture of mono-, di- and polysaccharides such as glucose, sucrose and starch. Within the digestive tract, complex carbohydrates are initially converted into monosaccharides before they are absorbed and lead to a postprandial elevation of blood glucose level. The first step of dietary starch breakdown is accomplished by the enzyme α-amylase, which is predominantly secreted by salivary glands and the pancreas (Zakowski and Bruns, 1985). As a member of endoenzymes, α-amylase degrades complex starch molecules into oligosaccharides of 6 - 8 glucose units by catalysing the hydrolysis of internal α-1,4 glycosidic bonds (Sales et al., 2012). Since neither terminal glucose groups nor α-1,6 glycosidic bonds can be cleaved by this enzyme (Whitcomb and Lowe, 2007), both linear and branched products are generated that have to be broken down by further degrading enzymes. α-Glucosidases, located on the brush border membrane of the small intestine, catalyses the hydrolysis of α-1,4 and α-1,6 glycosidic bonds of α-amylase degradation products and also of dietary disaccharides via an exo-mechanism thereby releasing α-glucose from the non-reducing end of the substrate which can be absorbed by enterocytes (Chiba, 1997) (Figure 3). Interestingly, about 80% of starch can be broken down into glucose by α-glucosidase without the involvement of α-amylase (Lin et al., 2010; Lin et al., 2012). As these, enzyme actions, which can be considered as a rate-limiting step in carbohydrate digestion, are relatively easy to access pharmacologically due to their location within the gastrointestinal tract, both α-amylase and α-glucosidase are favoured targets of antihyperglycemic medications.
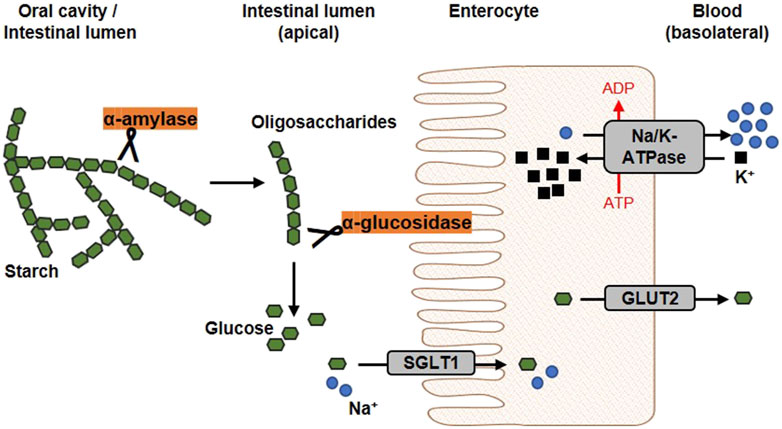
Figure 3. Schematic overview of glucose release and transport. In the oral cavity and the gut, the enzyme α-amylase, secreted by salivary glands and the pancreas, catalyses the hydrolysis of internal α-1,4-glycosidic bonds in dietary starch molecules. In the intestinal lumen, the resulting oligosaccharides are further broken down by the membrane-bound α-glucosidase. The α-glucosidase catalyses the hydrolysis of terminal α-glycosidic bonds thus releases glucose. At the apical membrane of enterocytes, one molecule glucose and two sodium ions are co-transported into the cell via the sodium-dependent glucose transporter 1 (SGLT1). Glucose is transported into the circulation on the basolateral side via passive diffusion through the Glucose transporter 2 (GLUT2). The driving force of the intestinal glucose uptake is a sodium gradient established under energy consumption by the Na+/K+-ATPase, which transported sodium basolaterally out of the cell (modified from (Koepsell, 2020; Barber et al., 2021). Used under CC BY 4.0: https://creativecommons.org/licenses/by/4.0/.
Acarbose, a pseudo-oligosaccharide of microbial origin derived from cultures of the soil bacteria Actinoplanes sp., is a well-known α-amylase and α-glucosidase inhibitor (Wehmeier and Piepersberg, 2004). Acarbose is composed of an unsaturated cyclitol, an amino-deoxyhexose and a maltose moiety and is recognized as a substrate by hydrolase enzymes involved in di- and polysaccharide digestion (Wehmeier, 2003; Tsunoda et al., 2022). However, the nitrogen linkage between the cyclitol (non-reducing end) and the deoxyhexose cannot be cleaved by these enzymes (Li et al., 2005; Tsunoda et al., 2022). Moreover, acarbose has an increased binding affinity for α-glucosidase compared to dietary saccharides (Rosak and Mertes, 2012). Acarbose is reported as a competitive inhibitor for α-glucosidase and a mixed non-competitive inhibitor for α-amylase (Kim et al., 1999). Other α-glucosidase inhibitors to be named are miglitol and voglibose. However, all these inhibitors are limited by their relatively high production cost, for example, due to complex biosynthesis for acarbose (Zhao Q. et al., 2017), and gastrointestinal (GI) adverse effects such as flatulence, abdominal discomfort and diarrhea caused by fermentation of carbohydrates by gut bacteria (Krentz and Bailey, 2005).
2.2 Glucose absorption through sodium-dependent glucose transportersCellular uptake of glucose from diet or blood is mediated by integral transport proteins. Depending on the transport mechanism, glucose transporters are classified into two families: (i) the facilitative glucose transporters (GLUTs) using a diffusion gradient and (ii) the sodium-dependent glucose co-transporters (SGLTs) through which glucose is actively transported by a Na+-electrochemical gradient (Bell et al., 1990; Wood and Trayhurn, 2003). Various isoforms of GLUTs and SGLTs have been identified showing different tissue distribution patterns (Wright et al., 2011; Mueckler and Thorens, 2013). The predominant glucose transporters in the intestine enabling dietary glucose (and galactose) uptake into circulation are SGLT1 and GLUT2 (Gorboulev et al., 2012). In Figure 3, the generally accepted mechanism of intestinal glucose absorption is depicted. SGLT1 is localized in the brush-border membrane of enterocytes, with its expression upregulated by dietary sugar (Margolskee et al., 2007; Song et al., 2016). Along with sodium, glucose is taken up into epithelial cells via SGLT1, whereas GLUT2 mediates its release into circulation on the basolateral side following the concentration gradient. Apparently, suppression of the SGLT1 transport protein can attenuate postprandial glucose peaks.
Much attention is currently also being given to another isoform of the SGLT family, namely, SGLT2 (Song et al., 2016). This low-affinity, high-capacity glucose transporter accounts for approximately 90% of renal glucose reabsorption, while the remaining 10% are reabsorbed by the high-affinity, low-capacity transporter SGLT1 (Kanai et al., 1994). SGLT2 inhibitors (e.g., gliflozins) have the potential not only to improve glycemic control by increasing glucose excretion in the urine (Chao and Henry, 2010; Scheen, 2015), but are also reported to have cardiovascular benefits (Zelniker et al., 2019). However, even if SGLT2 is completely blocked, glucose reabsorption in the kidney is partially maintained by SGLT1, indicating the prospective potential of dual SGLT1/2 inhibitors (Powell et al., 2013).
Phlorizin, a glycoside of the dihydrochalcone phloretin, was first isolated from the bark of the apple tree in 1835. This natural compound turned out to be the first non-selective inhibitor of both SGLT isoforms with a competitive mode of action (Ehrenkranz et al., 2005). However, phlorizin entails disadvantages e.g., poor water solubility, low oral bioavailability (Crespy et al., 2001) and rapid degradation (Tian et al., 2021), but the structure of phlorizin has been served as a template for (synthetic) SGLT inhibitors, which comprise individual SGLT2 and SGLT1 inhibitors as well as dual SGLT1/2 blockers (Dominguez Rieg and Rieg, 2019). Nevertheless, the discovery of novel natural SGLT inhibitors is becoming increasingly important (Oranje et al., 2019).
2.3 The incretin systemThe presence of dietary carbohydrates triggers a group of intestinal hormones known as the incretin system. An important step in the discovery of the incretin system was made in 1964 when it was shown for the first time that oral glucose provided a more potent insulin response compared with intravenous glucose stimulus (Elrick et al., 1964; McIntyre et al., 1964; Rehfeld, 2018). Nowadays it is known that this phenomenon is mainly due to two gut-derived hormones: glucose-dependent insulinotropic polypeptide (GIP) and glucagon-like peptide-1 (GLP-1) (Drucker and Nauck, 2006; Rehfeld, 2018). While the plasma level of incretin hormones is low in the fasting state, it increases within minutes after meal ingestion (Drucker and Nauck, 2006). Subsequently, GIP and GLP-1 stimulate insulin secretion form the pancreas by binding to their receptors GIPR and GLP-1R (Mayendraraj et al., 2022). Thus, incretin hormones play a particularly important role in postprandial glucose regulation being responsible for approximately 70% of insulin secretion after eating (Gallwitz, 2019). Other incretin effects have also been described, such as decelerated gastric emptying or reduced appetite (Drucker and Nauck, 2006). Interestingly, modulation of the incretin effect has proven to be a remarkably effective strategy for the management of obesity, as recently demonstrated by the therapeutic use of semaglutide (Chao et al., 2023).
The incretin system represents an excellent target for the modulation of glucose homeostasis (Holst et al., 2009) via two different strategies. On the one hand, GLP-1 receptor agonists bind to the GLP-1R stimulating pancreatic insulin secretion, thereby improving postprandial glucose levels (Meier, 2012; Gilbert and Pratley, 2020). On the other hand, GIP and GLP-1 are substrates for the enzyme dipeptidyl peptidase 4 (DPP4), whose cleavage activity leads to their rapid degradation (Figure 4) (Mentlein et al., 1993). Hence, inhibitors of regulatory DPP4 can be used to prolong the circulating half-life of incretin hormones (Gilbert and Pratley, 2020).
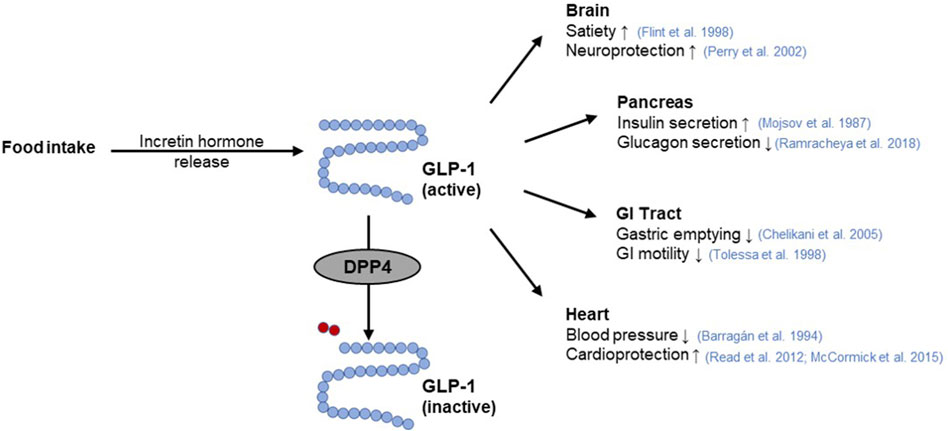
Figure 4. GLP-1 function and its interaction with DPP4. The incretin hormone glucagon-like peptide-1 (GLP-1) is released from intestinal cells as a response to nutrient intake. Subsequently, GLP-1 elicits pleiotropic effects on the target organs such as the pancreas (Mojsov et al., 1987; Ramracheya et al., 2018), brain (Flint et al., 1998; Perry et al., 2002), gastrointestinal (GI) tract (Tolessa et al., 1998; Chelikani et al., 2005), or heart (Barragán et al., 1994; Read et al., 2012; McCormick et al., 2015). Rapid inactivation of GLP-1 occurs by cleavage of a terminal dipeptide by the enzyme dipeptidyl peptidase 4 (DPP4) (modified from (Saraiva and Sposito, 2014; Razavi et al., 2022)). Used under CC BY 4.0: https://creativecommons.org/licenses/by/4.0/.
Several GLP-1 receptor agonists e.g., exenatide, lixisenatide, liraglutide or albiglutide as well as DPP4 inhibitors, known as gliptins such as sitagliptin, vildagliptin, linagliptin, saxagliptin or allogliptin are established as a class of oral hypoglycemic medications (Meier, 2012; Gallwitz, 2019; Gilbert and Pratley, 2020). Since there is evidence that SGLT1 inhibition increases plasma GLP-1 concentrations (Powell et al., 2013; Oguma et al., 2015; Io et al., 2019), combined use of SGLT1 and DPP4 inhibitors may be a particularly potent strategy for improved glycemic control (Zambrowicz et al., 2013). However, both GLP-1 receptor agonists and DPP4 inhibitors are associated with adverse effects. While DPP4 inhibitors are mainly associated with headache, nasal pharyngitis, and upper respiratory tract infections, GLP-1 receptor agonists are reported to contribute to gastrointestinal complaints (Gilbert and Pratley, 2020).
2.4 Pancreatic β-cell KATP channel activityInsulin is considered the major blood glucose-lowering hormone. It is produced and stored in the β-cells of the pancreas until its release, which is in part triggered by glucose entry into the cells and subsequent alterations in the activity of ion channels (Ashcroft et al., 1984; Ashcroft and Rorsman, 1989), with the inwardly rectifying K+ channel Kir6.2 (KCNJ11) and its accessory subunit SUR1 (ABCC8) playing a particularly central role (Gloyn et al., 2004; Hattersley and Ashcroft, 2005; Flanagan et al., 2009; Rubio-Cabezas et al., 2012). Together, Kir6.2 and SUR1 form in a 4:4 stoichiometry the KATP channel in pancreatic β-cells, which functions as a metabolic sensor (Ashcroft and Rorsman, 2013). At elevated blood glucose levels, the increasing glucose uptake by β-cells results in a high intracellular ATP:ADP ratio. This leads to an inhibition of the ATP-sensitive KATP channels, which in turn provokes a membrane depolarization and a subsequent opening of voltage-gated Ca2+ channels. The accompanying increase of intracellular Ca2+ levels then elicits increased insulin secretion (Figure 5).
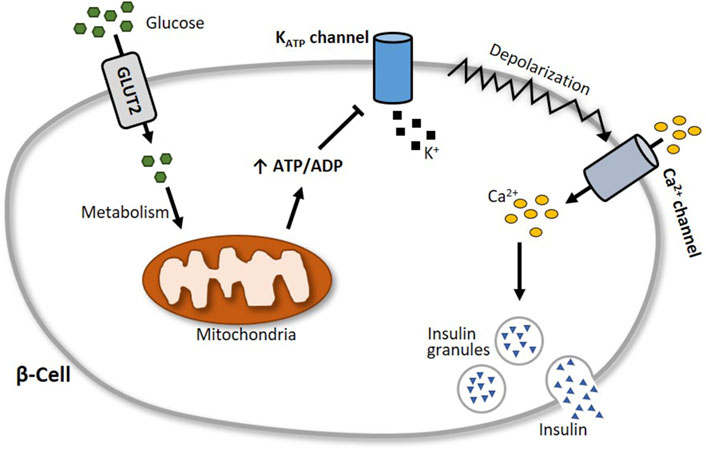
Figure 5. Schematic illustration of glucose-stimulated insulin secretion. At elevated blood glucose levels, more glucose is transported via glucose transporter 2 (GLUT2) into pancreatic β-cells. Subsequent glucose metabolism results in an augmented generation of ATP, which closes the ATP-sensitive KATP channel Kir6.2. This leads to a depolarization of the cell membrane and an opening of voltage-gated Ca2+ channels, followed by an influx of calcium into the cell. The increase of intracellular Ca2+ levels then triggers the exocytosis of insulin granules.
Because of its prominent role in insulin secretion, the pancreatic β-cell KATP channel is a suitable target for modulating blood glucose regulation. Sulfonylureas such as glibenclamide and tolbutamide, for example, bind to SUR1 and inhibit the KATP channels, thereby increasing insulin secretion. Due to its opposite effect, the KATP channel activator diazoxide is used to counteract hypoglycemia. In general, sulfonylureas can be grouped into two generations of oral blood glucose-lowering medication. As the first-generation sulfonylureas are associated with a considerably higher risk of hypoglycemia and cardiovascular issues, these drugs have been replaced by improved (prolonged-release) second-generation sulfonylureas, which are associated with a lower risk of these adverse effects (Sola et al., 2015).
2.5 Glucose absorption by peripheral tissuesInsulin acts on three key target tissues to reduce blood glucose: liver, muscle and adipose tissue (Wilcox, 2005; Petersen and Shulman, 2018). While it suppresses endogenous glucose production and concurrently stimulates glycogen synthesis in the liver, insulin signaling promotes glucose uptake and metabolism in muscle and adipose tissue (Stadlbauer et al., 2020). Approximately 80% of postprandial rise in blood glucose levels is decreased by muscle tissue (Merz and Thurmond, 2020). The principal transporter responsible for glucose absorption by peripheral tissues is GLUT4, thus a key protein in whole-body glucose regulation (Huang and Czech, 2007). Since GLUT4 belongs to the facilitative glucose transporters, glucose is taken up into skeletal myocytes and adipocytes by passive diffusion following a concentration gradient (Satoh, 2014). The regulation of GLUT4-mediated glucose transport occurs primarily via its intracellular localization (Govers, 2014). In unstimulated (basal) cells, GLUT4 is retained in intracellular storage vesicles, while an increase of blood glucose level and subsequent insulin secretion triggers the translocation of GLUT4 to the plasma membrane (Govers, 2014; Lanzerstorfer et al., 2014). This process is mediated by the insulin signalling cascade (Kanai et al., 1993) illustrated in Figure 6. In brief, upon insulin binding, the tyrosine kinase activity of the insulin receptor phosphorylates the insulin receptor substrate protein (IRS), which in turn triggers the activation of phosphoinositide 3-kinase (PI3K) and the subsequent formation of phosphatidylinositol (3,4,5)-trisphosphate (PIP3) in the plasma membrane. PIP3 then recruits the protein kinase B (Akt) to the cell membrane, where Akt is phosphorylated and thereby activated by phosphoinositide-dependent kinase (PDK) 1/2 (Alessi et al., 1997; Stokoe et al., 1997; Dangelmaier et al., 2014). Active Akt suppresses the Akt substrate 160 (AS160) via phosphorylation, resulting in GTP loading of Ras-associated binding (Rab) proteins responsible for the initiation of GLUT4 translocation (Mîinea et al., 2005; Tan et al., 2012). Although PI3K/Akt is the generally recognized major signalling pathway leading to GLUT4 translocation, PI3K independent signals are also known to stimulate this trafficking event. In particular, the activation of the Rho family member GTPase TC10 via Cbl associated protein (CAP)/Cbl pathway, turned out to be a relevant factor for insulin-stimulated translocation of GLUT4 (Chiang et al., 2001; Watson et al., 2001; Chang et al., 2007).
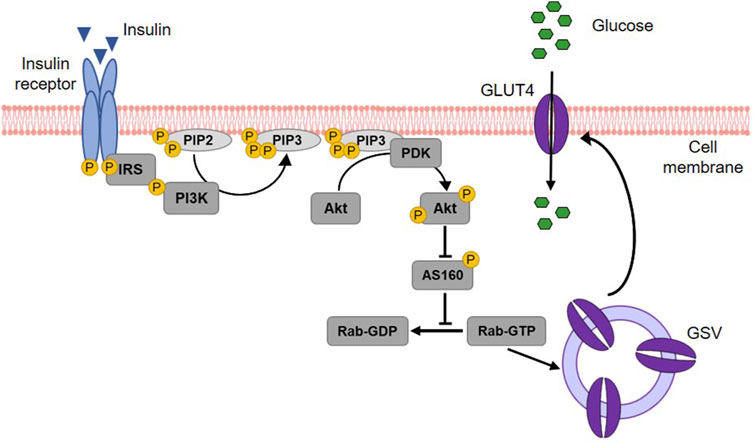
Figure 6. Insulin-stimulated GLUT4 translocation via the PI3K/Akt signalling cascade. Upon binding, insulin activates its receptor, which then phosphorylates and binds the insulin receptor substrate (IRS) protein. IRS binding recruits phosphoinositide 3-kinase (PI3K) to the cell membrane. PI3K phosphorylates membrane-bound phosphatidylinositol (4,5)-bisphosphate (PIP2) leading to the generation of phosphatidylinositol (3,4,5)-triphosphate (PIP3). This results in the recruitment of protein kinase B (Akt) to the membrane of the cell and the activation of phosphoinositide-dependent kinase (PDK) 1/2, which in turn phosphorylates Akt. Activated Akt subsequently phosphorylates the Akt substrate of 160 kDa (AS160), which thereby loses its GTPase activity. Consequently, Ras-associated binding (Rab) protein is activated as the hydrolysis of its bound GTP is prevented. Rab activation is responsible for the fusion of GLUT4 storage vesicles (GSV) with the cell membrane and thus for GLUT4 translocation. When integrated into the plasma membrane, GLUT4 finally enables the uptake of glucose into the cell (modified from (Thorn et al., 2013; Lankatillake et al., 2019; Heckmann et al., 2022). Used under CC BY 4.0: https://creativecommons.org/licenses/by/4.0/.
3 Methodological toolbox to study glucose homeostasis modulating properties of plant extracts3.1 In-vitro assays3.1.1 Enzyme assays for α-amylase, α-glucosidase and DPP4The enzyme activity of α-amylase is mainly determined in two ways: with a disc diffusion method and spectrophotometrically. The disc assay is a method used for over 70 years to determine α-amylase activity (Goodman, 1950). It is based on α-amylase diffusing from a filter paper (disc) into a starch-containing agar gel, where it degrades the polysaccharide. Accordingly, a clear zone appears around the filter disc indicating the diffusion radius and the activity of the α-amylase when the undegraded starch in the plate is stained with iodine. The clear zone diameter can be determined, with the size of the diameter depending on the α-amylase concentration/activity (Briggs, 1962) (Figure 7). Thus, the disc assay is also applicable to study inhibition of the enzyme, e.g., by plant extracts. To this end, the α-amylase solution is mixed with the extract (preferably in various concentrations) before the filter discs are soaked (Correia et al., 2004). By comparing the diameter of the clear zone of a control sample (only enzyme solution) with those of the clear zone where the extract was added, the inhibition of α-amylase can be calculated. The assay is simple to perform and does not require expensive materials or equipment. In order to save material, downscaling of the protocol might be advantageous for screening approaches, thereby using 4 filter discs per agar-starch plate. A major advantage of this method is that the usually intense staining of plant extracts, which often interferes with the photometer-based assays discussed below, has no influence. However, due to its rather high inaccuracy, the disc assay is only suitable for general assessment of α-amylase inhibition by plant extracts.
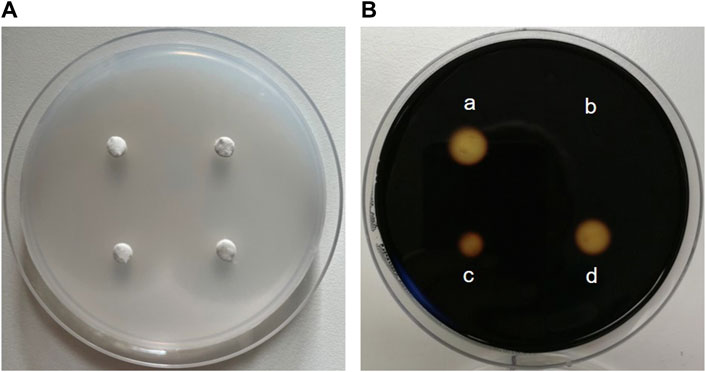
Figure 7. The disc assay for measuring inhibition of α-amylase activity. (A) Four “discs” made of filter paper with a diameter of 0.5 cm are placed on a Petri dish filled with medium (composed of 1% agar-agar and 1% starch). First, α-amylase (sourced from porcine pancreas) is added to solutions containing decreasing concentrations of an extract and pre-incubated, before the filter discs are soaked with the reaction mixture. The Petri plate is incubated at 37 °C for at least 8 h until the filter discs are removed. (B) Iodide-staining enables the calculation of the inhibition of enzyme activity. For this, the clear zone diameter of the control filter disc soaked with α-amylase alone (a) is compared with clear zone diameters of filter discs soaked with a solution of the extract and α-amylase (b, c and d). The stronger the inhibition of enzyme activity by the extract, the smaller the clear zone diameter.
A comprehensive protocol for spectrophotometrically determining α-amylase inhibition by plant extracts was developed by Apostolidis et al., 2006. After a porcine pancreatic α-amylase solution is pre-incubated with the plant extract, a solution of soluble starch is added as a substrate. The reaction incubated at 25 °C is stopped after 10 min by the addition of a colour reagent consisting of 3,5-dinitrosalicylic acid and sodium potassium tartrate and a 5 min incubation at 100 °C. The aromatic substance dinitrosalicylic acid reacts with the reducing sugars produced during starch degradation (Keharom et al., 2016). After cooling to room temperature, the absorbance of the reaction mixture, which reflects the α-amylase activity, can be measured at a wavelength of 540 nm (Apostolidis et al., 2006).
To determine the inhibition of α-glucosidase by plant extracts, a spectrophotometric assay is commonly used (Lankatillake et al., 2021). For this purpose, the enzyme is pre-incubated with the extract, followed by the addition of the chromogenic substrate p-nitrophenyl-α-D-glucopyranoside. The reaction incubated at 37 °C is terminated by the addition of a basic Na2CO3 stop solution, which also intensifies the yellow colour of the product p-nitrophenol. The α-glucosidase activity is proportional to the amount of p-nitrophenol released by the enzymatic reaction, the absorbance of which can be recorded spectrophotometrically at 405 nm (Lankatillake et al., 2021). For screening purposes, this assay can be easily performed in 96-well plate format, enabling a large number of samples to be run simultaneously.
Commercially available DPP4 inhibitor screening kits are suitable for high-throughput screening of putative DPP4 inhibitors. It can be performed in black 96-well microtiter plates according to the manufacturer’s instructions. The measurement is based on the cleavage of the substrate Gly-Pro-7-amido-4-methylcoumarin hydrobromide with yield of the fluorescence product 7-amido-4-methylcoumarin by active DPP4 enzyme (Kęska and Stadnik, 2022). The fluorescence signal (excitation/emission: 360/465 nm), which is proportional to the enzymatic activity present, can be measured over time.
For all assays, the percentage inhibition of the enzyme by an extract compared to a control can be determined. When performing the assay with suitable ascending extract concentrations, the half-maximal inhibitory concentration (IC50) (Aykul and Martinez-Hackert, 2016), can be calculated e.g., by using online IC50 calculator tools.
3.1.2 Cell culture-based ussing chamber assay for sodium-dependent glucose transportThe activity of the SGLT1 transporter can be determined in cellular monolayers by employing the Ussing chamber. The Ussing chamber, developed by Hans Ussing in the 1950s (Larsen, 2002; Thomson et al., 2019), is a laboratory device that enables the measurement of substance fluxes such as ions, nutrients or drugs through epithelial tissues. The device (Figure 8) consists of two liquid-filled half-chambers separated by an epithelial tissue into an apical (mucosal) and basolateral (serosal) side, with substance flow between the two compartments via the epithelium. The liquid, a physiological buffer, is kept at a constant temperature of 37 °C and is continuously oxygenated with carbogen, a 95/5 (v/v) mixture of O2 and CO2. Moreover, by using identical electrolyte solutions of the same volume on both sides, there are no osmotic and electrochemical gradients either (Clarke, 2009). An inner pair of electrodes enables the measurement of the transepithelial potential difference between the apical and basolateral sides. Via an outer pair of electrodes, a short-circuit current (ISC) can be applied, which clamps this potential difference to 0 mV and reflects the actual active transepithelial ion transport (Clarke, 2009; He et al., 2013). This ISC is recorded over time to monitor changes in transepithelial ion transport.
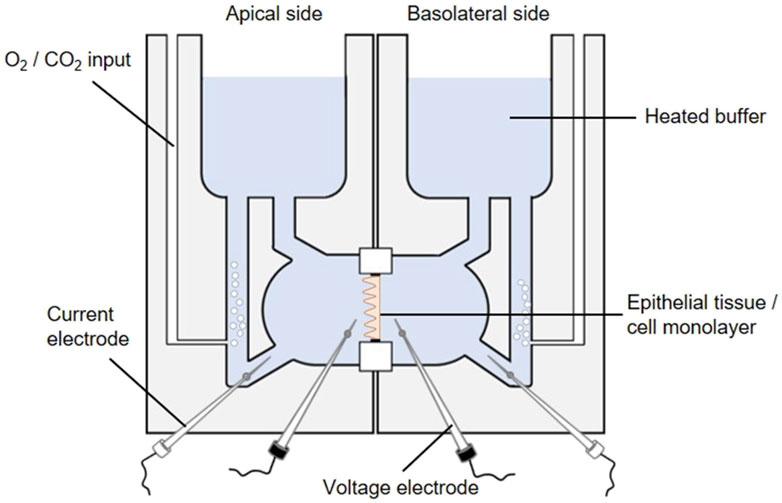
Figure 8. The Ussing chamber system. One Ussing chamber unit consists of two half-chambers, representing the apical and basolateral side, separated by a slider mounting an epithelial tissue or a cell monolayer. Both half-chambers are filled with equal volumes of the same 37 °C heated physiological salt solution. The solutions are oxygenated by carbogen gas while the temperature is maintained constant, so each side faces the same conditions. The transepithelial potential difference is continuously monitored through voltage electrodes (inner black electrodes). By using an automatic voltage clamp, the short-circuit current (ISC) is measured through current electrodes (outer white electrodes).
Different sliders available for an Ussing chamber system enables the variable use of epithelial tissues as well as Snapwell cell culture inserts comprising a permeable membrane supported by a detachable ring (Yeste et al., 2018). The intestine is one of the most intensively studied tissues in Ussing chambers in terms of gastrointestinal barrier function, permeability and nutrient absorption (He et al., 2013). Particularly, the active sodium and glucose co-transport via SGLT1 has mostly been studied by using animal tissue (Clarke, 2009; Schloesser et al., 2017; Klinger and Breves, 2018; Pallauf et al., 2019; Klinger, 2020). However, mounting Caco-2 (a human colorectal adenocarcinoma cell line) monolayers in Ussing chambers (Zheng et al., 2012; Steffansen et al., 2017) represent an intriguing alternative (Darling et al., 2020) to study plant extracts or compounds targeting the SGLT1-mediated glucose transport. Based on its properties, Caco-2 cells are a suitable in-vitro model for transport studies. Initiated by confluence, Caco-2 cells are starting to polarize and differentiate while developing an enterocyte-like phenotype, e.g., by forming a brush border and expressing specific brush border membrane enzymes (Hidalgo et al., 1989) and transporters for e.g., bile acids, amino acids and sugars including SGLT1 (van Breemen and Li, 2005). It should be pointed out that different Caco-2 clones exist distinguished by drastic differences in the expression of SGLT1. The highest SGLT1 expression is reported to be exhibited by the PD7 clone (Mahraoui et al., 1994).
For transport studies, Caco-2 cells are typically cultured for 21 days prior to use, as they have usually reached a fully differentiated state at this point (Darling et al., 2020). It has been proven effective to use the mucosal medium without serum supplementation after 7 days of cultivation, thereby simulating a more physiological condition and promoting the polarization process (Ferruzza et al., 2012). However, measurement of the transepithelial electrical resistance (TEER) as a marker of barrier tightness of a cellular monolayer is a suitable method to confirm the differentiation state of Caco-2 cells (Grasset et al., 1984).
Prior to Ussing chamber experiments the chambers are sealed with a blank slide and filled with the physiological buffer which is heated and oxygenated. Subsequently, adjustments are made to correct the offset potential between voltage-sensing electrodes and the fluid resistance. To start Ussing chamber experiments, the Snapwell inserts with the differentiated cell monolayer are transferred to Ussing chamber slides, before they are mounted into the prepared Ussing chamber. After refilling both half-chambers with the 37 °C physiological buffer, 10 mM glucose is added basolaterally as an energy substrate while 10 mM mannitol is added apically for osmotic reasons. The transepithelial potential difference is continuously recorded via Ag-AgCl electrodes and salt bridges (consisting of agar melted in the buffer used) (Clarke, 2009). Subsequently, the ISC is measured via automatic voltage clamp (Clarke, 2009; Schloesser et al., 2017; Pallauf et al., 2019). By adding glucose to the mucosal side of the chamber (with simultaneous addition of mannitol to the serosal side) the sodium-coupled glucose transport is stimulated as indicated by elevated ISC values. To determine SGLT1 inhibitory activity of plant extracts, they are added to both sides of the Ussing chamber and the reduction of the glucose-induced ISC value is determined.
In general, it should be kept in mind that, although Ussing chamber studies provide an excellent opportunity to make accurate and rapid measurements of substance fluxes in a physiological context, the complexity of the physiological system is still not being mimicked to its full extent (He et al., 2013).
3.1.3 Patch-clamp measurements for KATP channelsThe potassium transport activity of the inwardly rectifying K+ channel Kir6.2, which is crucial for insulin secretion by pancreatic β-cells, can be determined by the patch-clamp technique. In the early 1950s, the concept of ion channels with conductances selective for different ions was proven by the fundamental work of Alan Hodgkin and Andrew Huxley (Hodgkin and Huxley, 1952b; 1952a). Thirty years later, the first genes coding for ion channels were identified and since then more than 400 ion channel genes have been cloned (Giraudat et al., 1982; Noda et al., 1982; Imbrici et al., 2016). In parallel, the patch-clamp technique has been developed (Hamill et al., 1981), which made it possible to examine the properties of the various ion channels after heterologous expression in a feasible expression system and to uncover their influence on cell physiology and thus also on physiology of the body.
Figure 9A depicts a typical set-up used for patch-clamp measurements. It is basically built around an inverse microscope placed on an anti-vibration table and surrounded by a Faraday cage. The heart of the setup is a preamplifier (probe or headstage) on which the patch pipette is mounted. The technique is based on the formation of a very tight contact of a glass pipette with the cell membrane (giga seal; Figure 9B). After the formation of the giga seal, the cell-attached configuration is achieved (Figure 9C), allowing the ion channels inside the patch to be measured without disturbing the intracellular milieu. Accordingly, the modulation of the channels by intracellular signal cascades can be evaluated. Starting from the cell-attached configuration, there are two possibilities to conduct measurements. One is to remove the membrane patch under the pipette by gentle suction obtaining the whole cell configuration. Here, all channels of the cytoplasma membrane contribute to the measurement, resulting in the largest currents being recorded. The cell is now filled with the defined pipette solution and the extracellular condition can be changed simply e.g., by adding drugs such as ion channel modulators and ligands of membrane receptors. The whole cell configuration is the standard configuration used when measuring the influence of modulators such as plant extracts on ion channel function. The second possibility is to withdraw the pipette from the cell-attached configuration. This leads to the inside-out configuration, where free access to the inside of the membrane is obtained. Consequently, the influence of pharmaka, changes in intracellular pH, fatty acids etc. can be measured in this configuration. From the whole cell configuration, you can also reach the outside-out configuration to investigate the channel without the intracellular milieu.
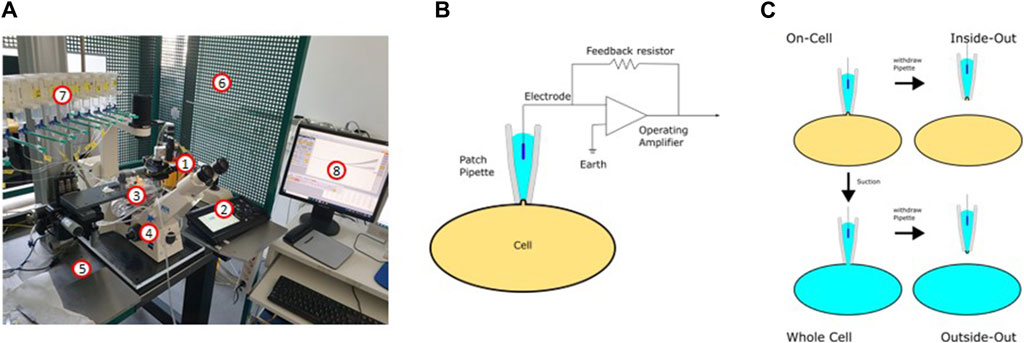
Figure 9. The patch-clamp technique. (A) Setup used for the patch-clamp measurements (1: headstage; 2: micromanipulator; 3: bath chamber; 4: microscope; 5: anti-vibration table; 6: Faraday cage; 7: application system; 8: software). (B) Electric circuit of the patch-clamp technique. (C) Different configurations of the patch-clamp technique.
The patch-clamp technique can be used in two different modes: In the current clamp mode, the actual current seen by the cell can be either clamped to a certain value or no current at all is injected to the cell. In this mode, the potential between the intra- and extracellular milieu is measured. If the modulation of a channel leads to its opening or closing, this can be recorded as a change in the membrane potential or, in the case of excitable cells, as the generation of an action potential. In the current clamp mode, for example, the inhibition of inwardly rectifying K+ channels is noticeable as depolarization of the membrane, resembling the inhibition of the KATP channel in pancreatic β-cells after ATP elevation (Ashcroft and Rorsman, 2013). The second mode is the voltage-clamp mode. Here, the voltage is clamped to a certain value and the ionic current flowing through the membrane is measured as the counter current required to maintain the set voltage. Using the patch-clamp technique in combination with the preparation of slices of the organ of interest, every cell type in the body is available for electrophysiological measurements. Pharmacological investigations of ion channels are mainly done in the voltage clamp mode.
Most commonly used for the heterologous expression of ion channels are oocytes from Xenopus laevis, HEK293 cells, CHO cells or COS7 cells. These cell types have in common a relatively low background expression of endogenous ion channel genes. This allows the measurement of the respective channels without interfering endogenous currents. Following standard transfection protocols, plasmids for co-expression of Kir6.2 and SUR1 (e.g., available from Addgene; www.addgene.org/) are introduced into the cells and K+ channel function can be examined after 24 h already. The sulfonylurea drug glibenclamide is a suitable positive control having an IC50 value of about 1 µM (Houtman et al., 2021).
3.1.4 Total internal reflection fluorescence microscopy for quantification of GLUT4 translocationThe determination of GLUT4 translocation by total internal reflection fluorescence (TIRF) microscopy has been established as an excellent method for identifying drugs and plant extracts that can enhance GLUT4 translocation independently of insulin (Lanzerstorfer et al., 2014; Stadlbauer et al., 2016; Stadlbauer et al., 2020) (Figure 10). TIRF microscopy enables detection of fluorophores such as green fluorescent protein (GFP) located close to the interface between two media such as cover glass and sample and is characterized by extremely high sensitivity (Stadlbauer et al., 2020). Moreover, TIRF microscopy has been proven in several studies to be a suitable technique for screening approaches (Lanzerstorfer et al., 2014; Stadlbauer et al., 2016; Haselgrübler et al., 2018a; Stadlbauer et al., 2021). Nevertheless, it should be recognized that there are additional suitable methods for quantifying GLUT4 translocation, including microscopy-based approaches as well as biochemical and spectrometric approaches, as recently comprehensively reviewed (Heckmann et al., 2022).
留言 (0)