
記住我


Ultrasound-guided punctures were performed in a pig liver, from which recordings were subsequently evaluated quantitatively and qualitatively.
Porcine Model and Sonographic PrerequisitesA single male Swedish pig weighing 34 kg was included in this study. The pig was first put under deep anesthesia and prepared (and, ultimately, euthanized) according to the protocol in Online Resource 1. Thereafter, an incision was made in the skin of the right flank, and a thoracic catheter (diameter 10.7 mm/32 Fr; length 40 cm) with an included metal trocar (Vygon, Ecouen, France) was inserted intercostally into the liver under ultrasound guidance to simulate an anechoic target lesion (see Fig. 1). The center point of the catheter had an average depth (min–max) of 4.8 cm (4.1–5.6 cm). The catheter was filled with saline and clamped to prevent air artifacts.
Fig. 1
The porcine model. A 10.7 mm/32 F thoracic catheter was inserted into the liver under ultrasound guidance. The catheter (seen in the lower part of the picture) was subsequently filled with saline and clamped
A Siemens ACUSON Sequoia unit (Siemens Medical Solutions, Inc., Mountain View, CA, USA), equipped with a 5C1 curved transducer, was used for US scanning. A guide for 18G needles (Verza, CIVCO Medical Instruments Co., Inc., IA, USA) set at an angle of three (61°) was used, together with its corresponding guiding lines. Imaging and recording were performed in split-screen imaging mode with a CEUS mode image on the left (low-frequency setting) and a low MI B-mode image on the right (mid-frequency setting), at a rate of nine frames per second. The maximum depth was set to 9 cm.
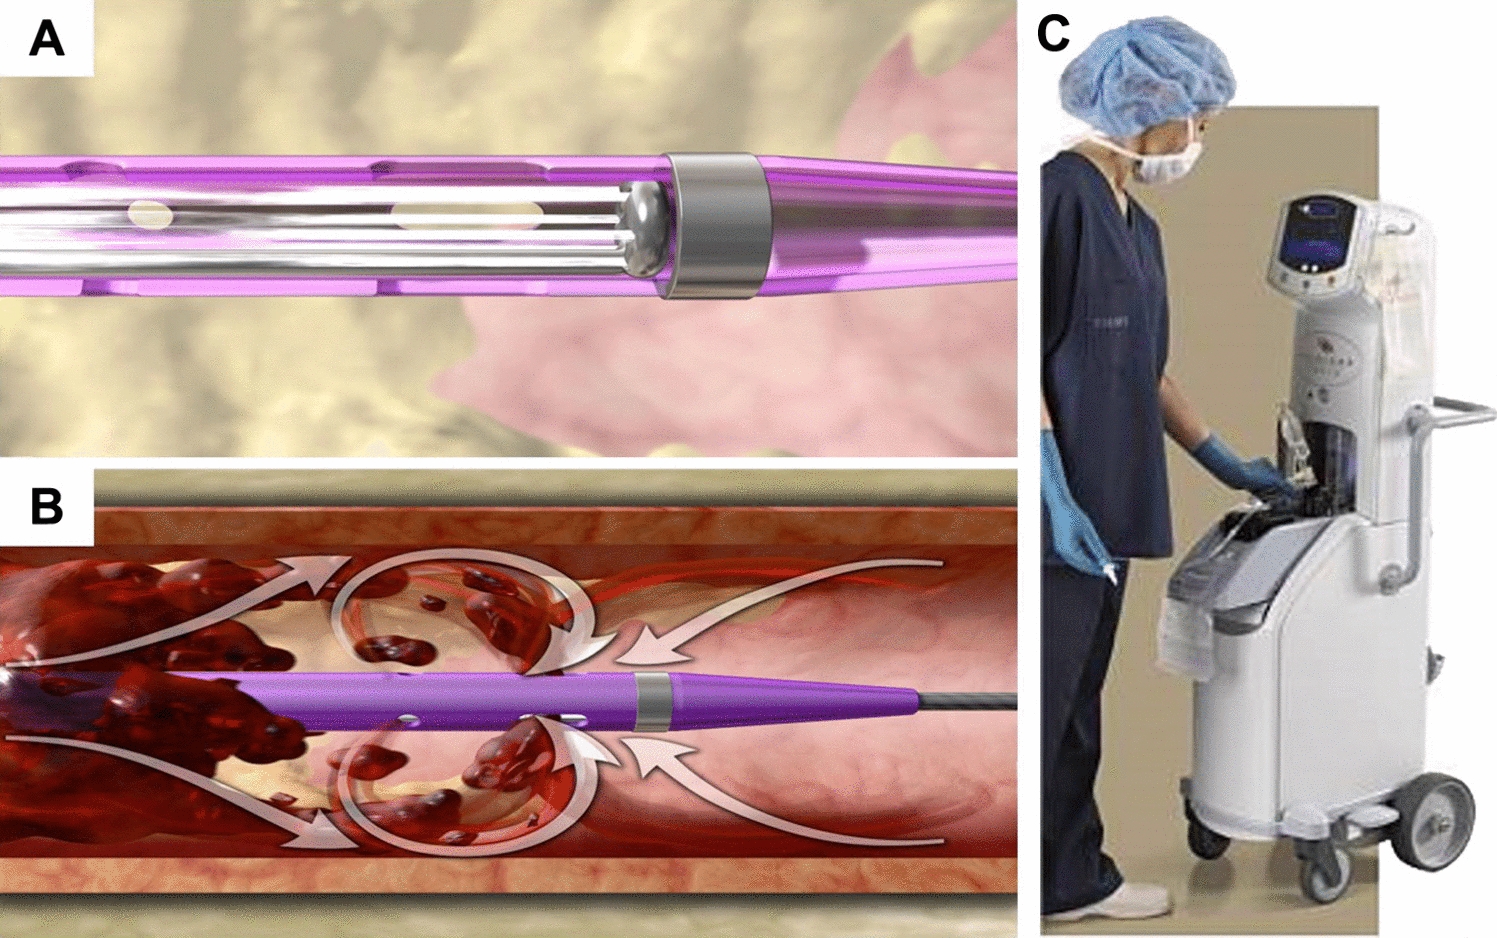
Biopsy Needle Priming and Puncture ProcedureBioPince Ultra Full Core biopsy instruments 18G × 20 cm (Argon Medical Devices, Inc., TX, USA) were primed with 0.6 mL of the USCA sulfur hexafluoride (SonoVue; Bracco SpA, Milan, Italy) using a 1 mL syringe, as described and depicted in detail in our previous paper [10]. After priming and without delay, each biopsy needle was inserted into the liver while aiming at the perpendicularly located thoracic catheter, as illustrated in Fig. 2. The needles were considered to be in the desired end position once the tip reached the target, and a slight movement of the catheter was detected. This was to ensure that a proper delineation of the needle tip could be made when processing the image, regardless of its visibility. Each recording captured the needle insertion and approximately 5 s with the needle in the end position. After complete needle extraction, the biopsy instruments were fired off outside the pig and primed again before the next puncture.
Fig. 2
Example of an observation. Top row: image in split-screen mode of a biopsy needle primed with ultrasound contrast agent in its end position reaching the catheter. Bottom row: same image with 1 (blue rectangle with diameter of 3.5 mm): ROI delineating the needle in its entirety; 2 (red square with a side of 3.5 mm): the needle tip; 3 (yellow polygon): area outside ROIs (background) and T (white dashed circle): catheter simulating target lesion
Under ventilator-induced apnea, a total of 60 punctures were performed in ten sets non-blinded by the same operator. Each set included three pairs of punctures, with each pair consisting of a primed needle and a non-primed control. Before initiating each pair of punctures, 1.2 mL of the USCA sulfur hexafluoride was administrated via a peripheral venous catheter in an auricular vein, followed by flushing with 10 mL of 0.9% saline. The USCA dosage was chosen based on the pig’s weight and aligned with the standard dosage given to pediatric patients in our clinic. The first puncture in each pair was performed as soon as the homogeneous contrast uptake could be seen in the liver and the second as soon as possible thereafter. In every other set, the punctures were performed with either the primed needle or the control first, to prevent bias-related to the background intensity decreasing over time. A new entry point and a new primed instrument were used for each new set of punctures.
Quantitative EvaluationTo quantitatively evaluate the needle visibility, the contrast-to-noise ratio (CNR), originally proposed by Patterson and Foster as the contrast-to-speckle ratio, was calculated for each needle in its entirety and each needle tip in both CEUS mode and B-mode, respectively, using:
$$} = \frac}} - \mu_}} } \right|}}}}^} + \sigma_}}^} } }}$$
with μi representing the average signal intensity (SI) inside the region of interest (ROI), μo: average SI outside the ROI, σi2 the SI variance inside the ROI, and σo2 the SI variance outside the ROI [12, 13]. ROIs were defined for the needles in their entirety (a rectangle) and the needle tips (a square). This was achieved through a combined assessment of the CEUS mode and B-mode images, supported by observing the movements of the needles during insertion, along with those of the thoracic drain upon needle tip contact. The area outside the ROIs was delineated by a polygon representing a segment of the liver parenchyma at the same depth as the intrahepatic course of the biopsy needle. The analysis focused on the image frames capturing each needle tip in its end position touching the thoracic drain (that is, not the insertion phase of the recordings). Examples can be found in Figs. 2 and 3, and all observations are presented in Online Resource 2. The ROI delineation process was carried out in a non-blinded manner.
Fig. 3
Example of a pair of punctures (third pair of the fifth set) with needles in their end positions adjacent to the thoracic drain. Yellow boxes represent the two regions of interest and the background, as described in detail in Fig. 2. The pair was chosen to represent a contrast-to-noise ratio near the median in contrast-specific imaging mode for the needle in its entirety of the ultrasound contrast agent primed needles
Qualitative EvaluationThe recordings (including both the needle insertion and approximately 5 s in the end position) were evaluated in a blinded manner by three radiologists with 9, 15, and 26 years of experience, respectively, including multiyear familiarity with ultrasound-guided punctures. Matching pairs of videos (one primed and one control) were randomly presented side by side via a web interface (all videos are available in Online Resource 3). For both the needles in their entirety and the needle tips, the visibility in CEUS mode and B-mode was evaluated on a Likert scale (1: poor; 2: fair; 3: good; 4: very good; and 5: excellent). The radiologists answered the following two questions in their assessment:
1.The needle in its entirety:
2.The needle tip:
Image Processing and StatisticsThe recordings were processed using the application ImageJ version 1.54 g (Wayne Rasband, National Institute of Health, Bethesda, MD, USA). For statistical analyses and rendering of charts, R version 4.3.2 (R Foundation for Statistical Computing, Vienna, Austria) was used. All statistical tests were two-tailed and performed at a significance level of 0.05.
In the quantitative evaluation, the mean CNRs for each puncture were calculated, and medians were derived. A Wilcoxon signed-rank test was used to test the differences in CNRs between the primed and non-primed needles.
For the qualitative evaluation, the results of the Likert scale gradings were illustrated descriptively as jitter plots. Contingency tables (2 × 2) were created to combine the frequencies for the four possible combinations of questions 1 and 2. The primary outcome variable was formed by aggregating the assessors’ weighted assessments by the majority. Comparisons of the frequency of (1) primed biopsy needles with superior visibility independently of clinical relevance and (2) primed biopsy needles with clinically relevant superior visibility were performed using an exact binominal test (hypothesized probability of success of 0.5).
The variations in CNRs and Likert scale visibility for the needles in their entirety across the first, second, and third orders of priming were presented as jitter plots and analyzed with a Friedman test. If the outcome was statistically significant, it was supplemented with a Wilcoxon signed-rank test to compare the priming orders. It was deemed unlikely that needle tip visibility would be affected by repeated priming, which is why evaluation of these was waived.
留言 (0)