Human tissues
The experimental ethics were reviewed and approved by the Clinical Research Ethics Committee of Renmin Hospital of Wuhan University(China). All human specimens were used with the informed written consent of all patients and donors (WDRY2020-K230). Six aortic specimens were obtained from patients with type A aortic dissection who underwent aortic replacement surgery between April 2021 and August 2023 and who did not exhibit any phenotypic characteristics of known genetic disorders, such as Marfan syndrome and loeysdietz syndrome. In addition, 6 samples of normal aorta were obtained from brain-dead patients or heart transplant patients who were registered as heart donors. Human aorta samples are mainly used for immunostaining and western-blot.
Animals and cells
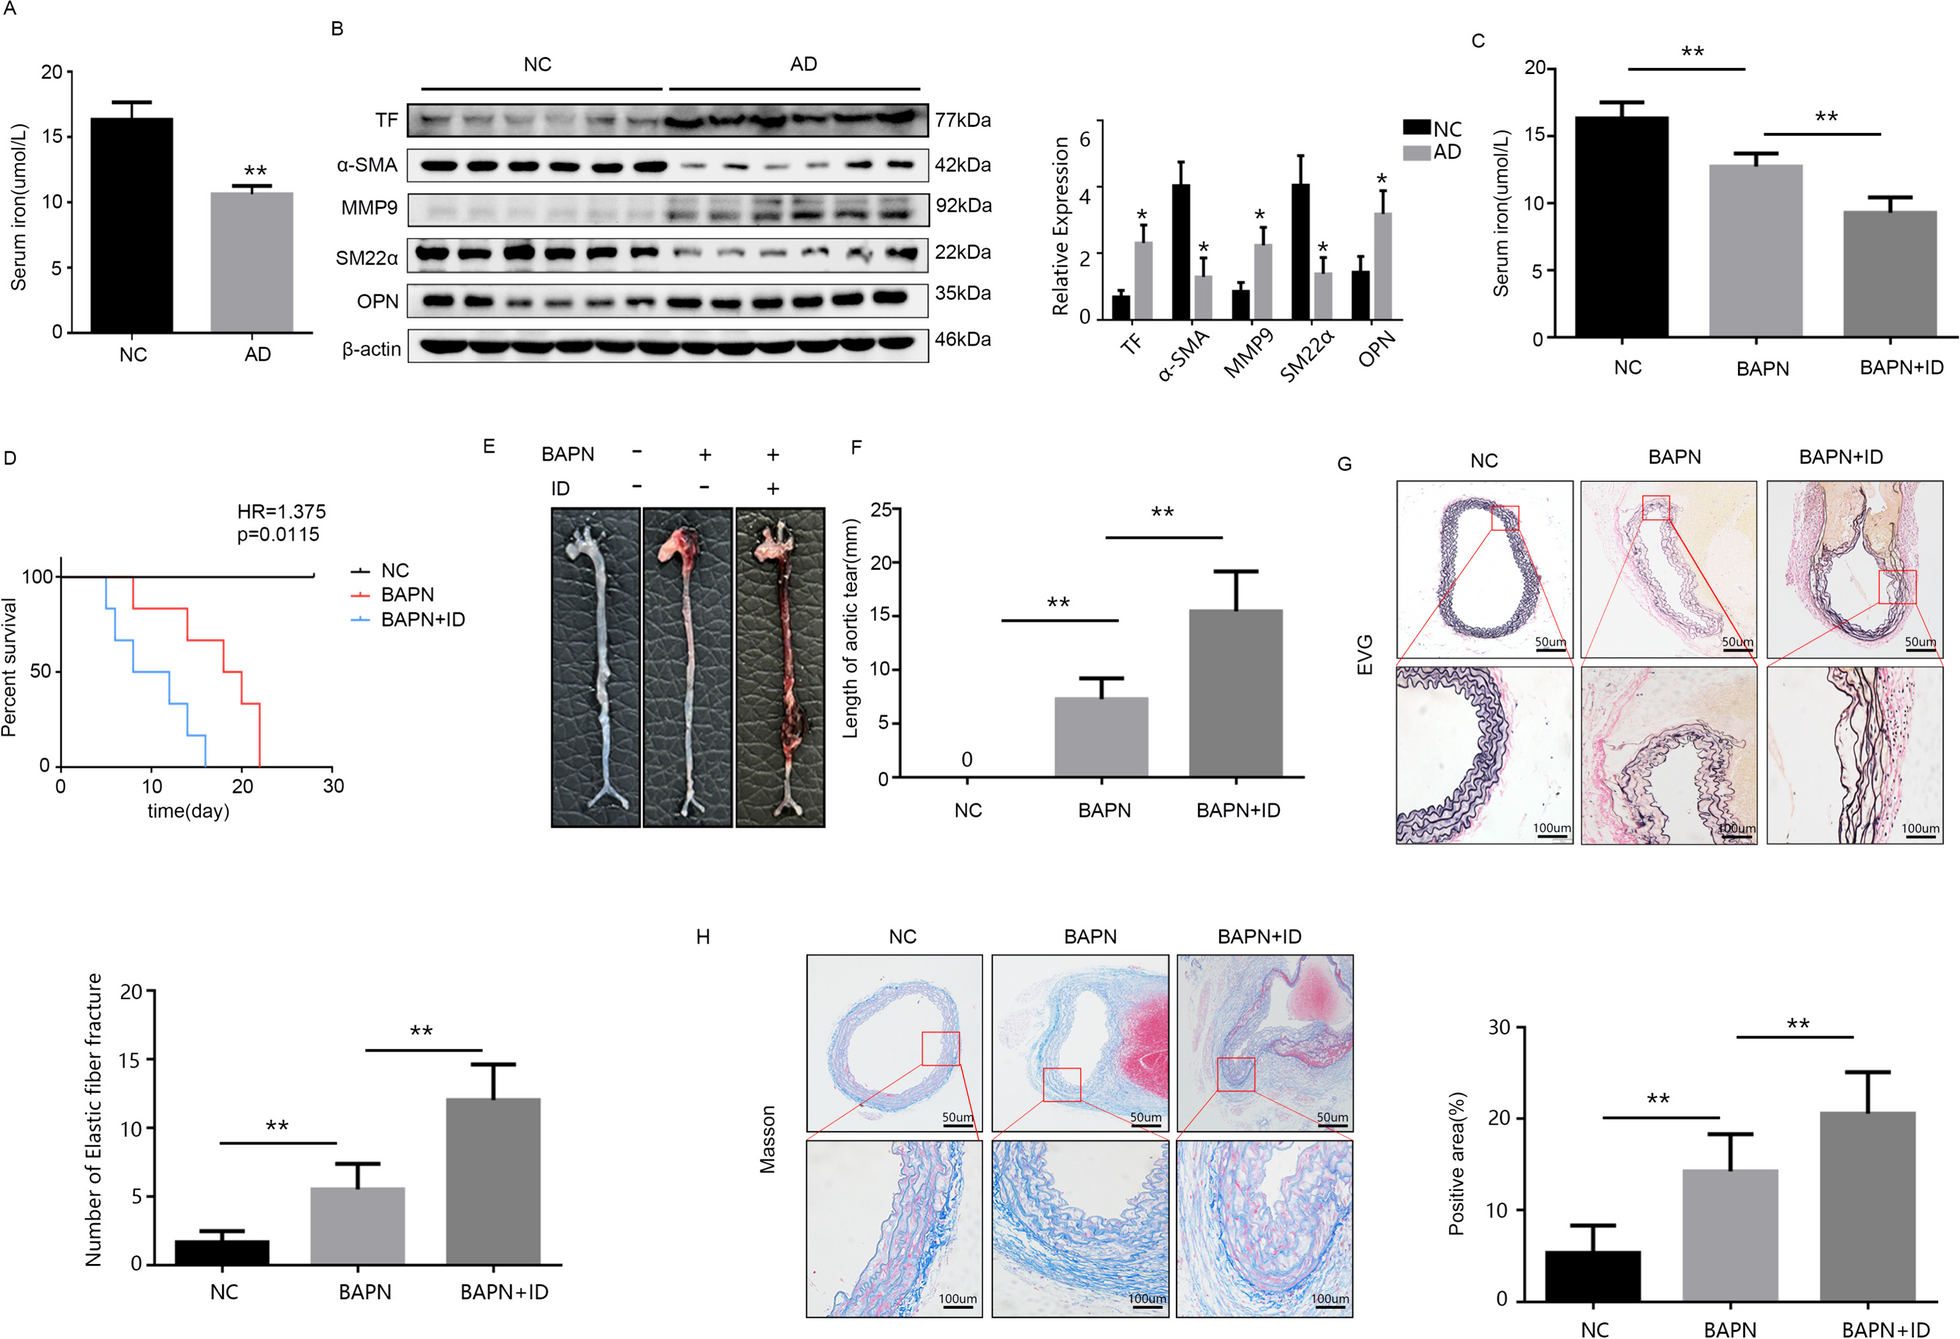
Male C57 mice (average weight: 12 g; age: 3 weeks) were purchased from Mouse Treasure Corporation (China). Mice were randomly assigned to each group (6 mice per group) and mice were fed a special diet containing 0.25% β-Aminopropionitrile (BAPN) (Yuanye company, S44439, China) to construct an AD model (Pan et al. 2022). Feed for 4 weeks to build AD model and when some mice died during the course, the samples were fixed in time. BAPN feed and iron-deficient feed were purchased from Beijing Huafukang Company. All animal experiments were approved by the Ethics Committee of Renmin Hospital of Wuhan University (WDRM20201107).The mouse aorta smooth muscle cell line of MOVAS (Enzyme-link Biotechnology, ML096614, Shanghai) was used in cell experiments (Xiao et al. 2023). The cells were cultured in a 37 degree incubator with 5% CO2. Angiotensin-II (Ang-II) reatment of MOVAS cells can induce their transformation from contractile to synthetic, simulating the process of AD. Deferoxamine (DFO) is an iron chelating agent that reduces the deposition of free iron ions in cells and simulates iron-deficient environments.
Transcriptomic sequencing
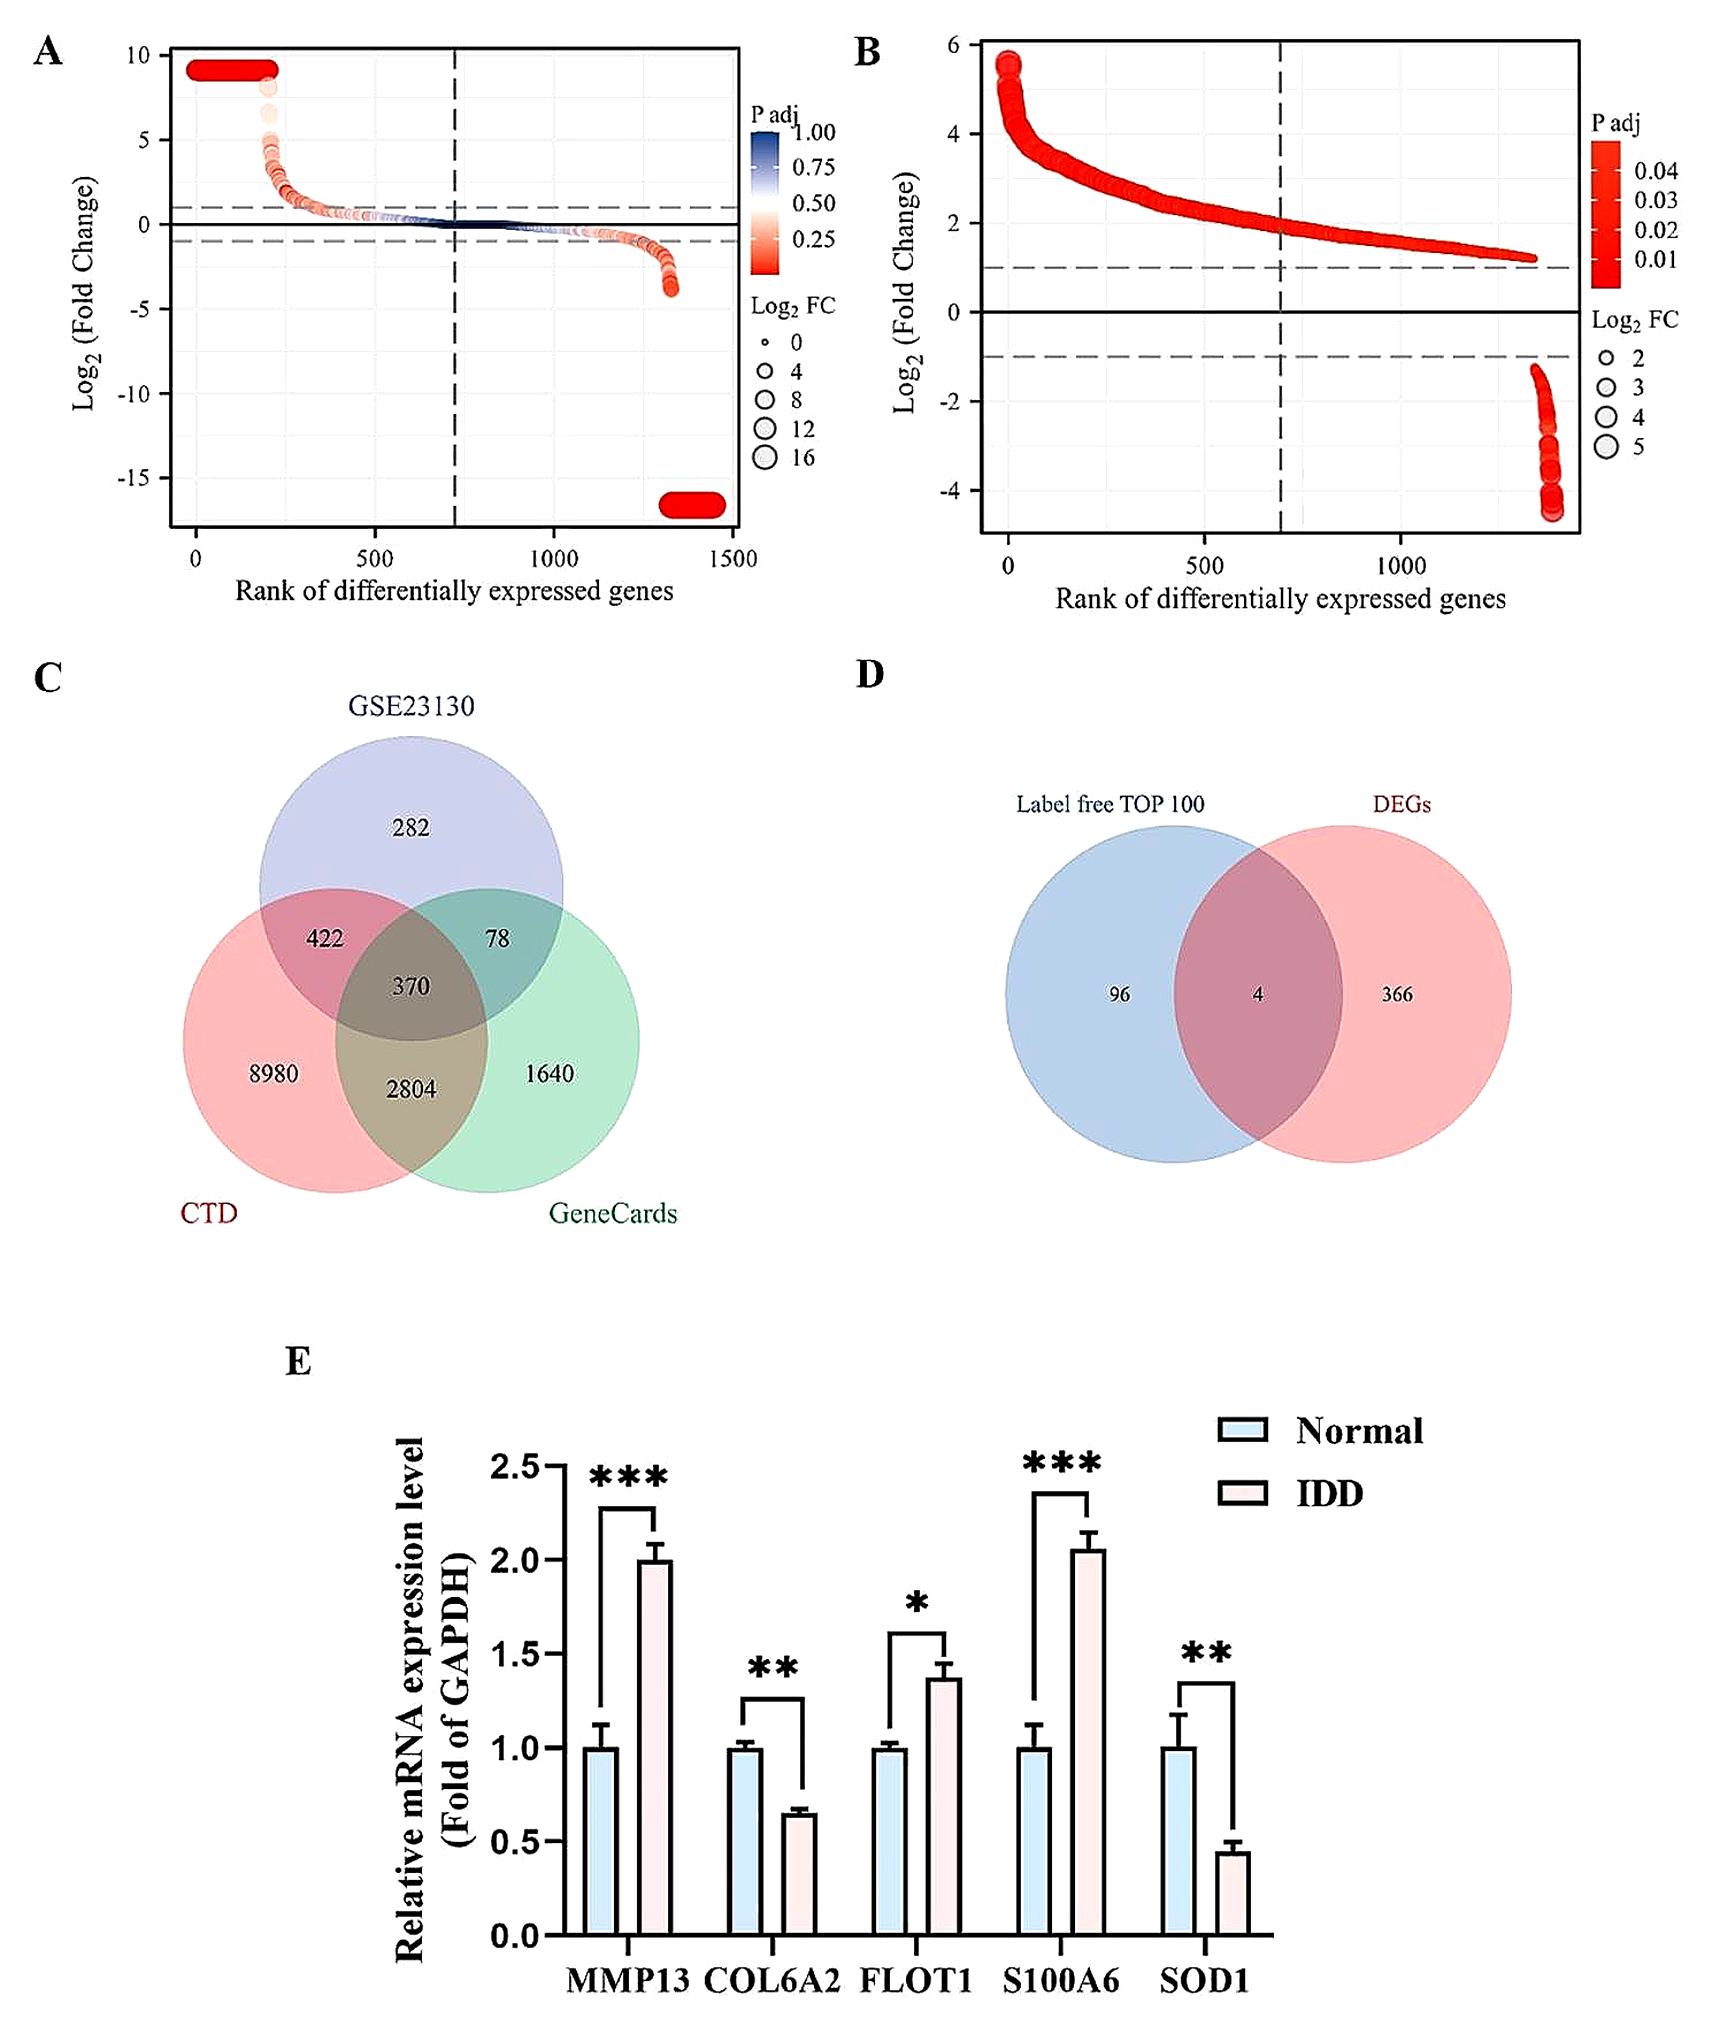
Whole transcriptomic sequencing was performed on freshly obtained human aorta specimens (3 independent samples per group), and the sequencing technology was provided by Sangon Biotech (Shanghai). After analyzing the sequencing results, the treated MOVAS cells were sequenced again in order to exclude the large differences in the human tissue itself (3 independent samples per group). The two sequencing results were basically consistent, which verified the reliability of the experiment.Ten thousand sequences were randomly selected from Clean data and compared with NCBI NT database for blastn comparison. Comparison results with evalue < = 1e−10, similarity > 90% and coverage > 80% were used to calculate their species distribution.
Flow cytometry
To detect the expression changes of ROS, iron and HIF1s (CST,#36,169,USA) in vivo and in vitro experiments, flow cytometry was performed on mouse blood and movas cell lines after modeling.
Peripheral blood was collected from the eye socket and red blood cells were removed with red blood cell lysate to eliminate the influence of blood color on fluorescence intensity.HIF1 antibody and iron ion fluorescent probe (Solarbio,#121,714,China) were used for 37 °C dark staining 30 min.
The evaluation of ROS changes in movas cells involved the use of flow cytometry to detect dihydroethidine (DHE) (Beyotime, #S0063, China) probe for measuring ROS concentrations. The fluorescence intensity (FI) emitted by DHE was quantified in the control group, and initially, DHE (blank) was not added during analysis to ensure undisturbed fluorescence emission.
Immunohistochemistry/immunofluorescence
To assess the expression and subcellular localization of relevant proteins in aortic smooth muscle cells, immunostaining was performed on aortic sections. After the sections were hydrated with xylene and gradient alcohol, they were repaired by microwave heating in sodium citrate buffer (Servicebio,#G1201,Wuhan). The sections were sealed with goat serum and incubated overnight at 4 ℃ for primary antibody. After incubation of the corresponding goat secondary antibody the next day, DAB (Servicebio, #G1212, Wuhan) was used for positive signal color development DAPI (Servicebio, #G1012, Wuhan) was used for immunofluorescence staining). A standing microscope was used to take pictures under different fields of view (Image magnification is 10× and 40×, the confocal shooting multiple is 200×) and the acquired pictures were analyzed by Image J software.
Western blotting (WB)
Tissues and cells were washed with a PBS and lysed in RIPA buffer (Beyotime, #P0013K, China) containing cocktail (Servicebio, #G2006-250UL, China) and phenylmethylsulfonyl fluoride (Servicebio, #G2008-1ML, China) on ice. Tissue fragments and cell debris were extracted by centrifugation(10,000g, 4 °C, 12 min) after ultrasonication, and the protein concentration of the supernatant was determined by a BCA assay (Beyotime, #P0010, China). Equal amounts of proteins (MOVAS, 20 μg; human tissue, 200 μg; and mouse aortic tissue, 120 μg) were resolved by 8%–10% SDS PAGE and transferred onto polyvinylidene difluoride (PVDF) membranes (Merck Millipore, # ISEQ00010, USA). After being blocked with 5% skimmed milk in PBST for 1.5 h, the membranes were incubated overnight with anti-HIF1 antibodies (1: 600,CST,#36,169, USA), anti-VEGF antibodies (1:500, ThermoFisher, MA5-13,182, USA), anti-iNOS antibodies (1: 600,CST,#2982, USA), anti-eNOS antibodies (1: 600,CST,#5880, USA) anti-α-SMA antibodies (1: 800, Servicebio, #GB111364, China), anti-SM-22α antibodies (1: 1000; Beyotime, #AF5318, China), anti-OPN antibodies (1: 1000; Proteintech, #22,952–1-AP, USA), anti-MMP2 antibodies (1: 1000; Servicebio, #GB11130, China), anti-MMP9 antibodies (1: 1000; Beyotime, #AF5234, China), and anti-β-actin (1: 1000; Proteintech, #66,009–1-Ig, USA) primary antibodies at 4 °C. The membranes were washed and incubated with IRDye-800CW-conjugated goat anti-mouse IgG (1: 20 000; Li-Cor, #926–32,210, USA) or goat anti-rabbit IgG (1: 20 000; Li-cor, #925–32,211, USA) and HRP-conjugated goat anti-mouse IgG (1: 20 000; Li-cor, #926–80,010, USA) or goat anti-rabbit IgG (1: 20 000; Li-Cor, #926–80,011, USA) secondary antibodies. The membranes were scanned using an Odyssey (Li-Cor Biosciences, USA) and chemiluminescence apparatus (BIO-RAD, USA), and the grayscale value of each band was qualified using paired software. At least 3 independent experiments were performed.
Masson and Elastic van Gieson
Aortic tissue was fixed, dehydrated and embedded in paraffin, and sectioned as described above. As for Masson staining, sections were stained with hematoxylin (Servicebio, #G1004, Wuhan) solution for 10 min, differentiated with 1% hydrochloric acid ethanol, and then stained with ponceau acid fuchsin solution, phosphomolybdic acid solution and aniline blue solution (Servicebio, #G1032, Wuhan) successively. Subsequently, sections were dehydrated with gradient ethanol, made transparent with xylene, and mounted with neutral resin. Images were captured by an optical microscope. The red part represents elastic fibers and the blue part represents collagen.
As for Elastic van Gieson (EVG) staining, alcohol hematoxylin, ferric chloride, and iodine solution were mixed with EVG dye solution according to a certain proportion. The sections were immersed in the EVG dye solution for 30 min and then rinsed under running water. Iron trichloride differentiation liquid differentiated, to the elastic fibers appeared dark purple against an almost colorless background. Saturated picric acid was mixed with ponceau S (Servicebio, #G2011, Wuhan)stain to form the EVG dye solution. Sections were stained for 1–3 min, then rapidly washed, dehydrated, and mounted.
Statistical analysis
All statistical analyses were performed using GraphPad Prism 6.0 (GraphPad Software, USA), and the results are presented as the mean ± standard deviation (SD). Mouse survival was compared using the logrank test. For ex vivo experiments, the analysis of variance (one-way ANOVA) followed by Dunnett’s test was used to compare differences among multiple groups. Other measurements were performed using unpaired Student’s t-test. P < 0.05 were considered statistically significant.


留言 (0)