
記住我


The CD206−/− deficient (referred to as CD206−/− KO) MB6.129P2-Mrc1tm1Mnz/J mouse was previously described [3, 4], and was studied together with age- and sex-matched WT littermate controls in this work. Female C57BL/6N mice were purchased from Janvier Labs for CFA induction studies. Mice were housed under controlled environmental conditions with a 12:12 h light:dark cycle at the Central Animal Laboratory of the University of Turku.
To induce inflammation, a single 20 µL volume of a mixture containing CFA (F5881, Sigma Aldrich) and 2 µg of ovalbumin (vac-pova, InvivoGen) was injected subcutaneously into the dorsal side of the left hind paws of C57BL/6N mice using Microfine Demi 0.3 mL syringes (BD) and a 30-G needle. The mice were studied on day 5 or day 14 after CFA induction (day 0). Non-inflamed C57BL/6N mice were used as controls.
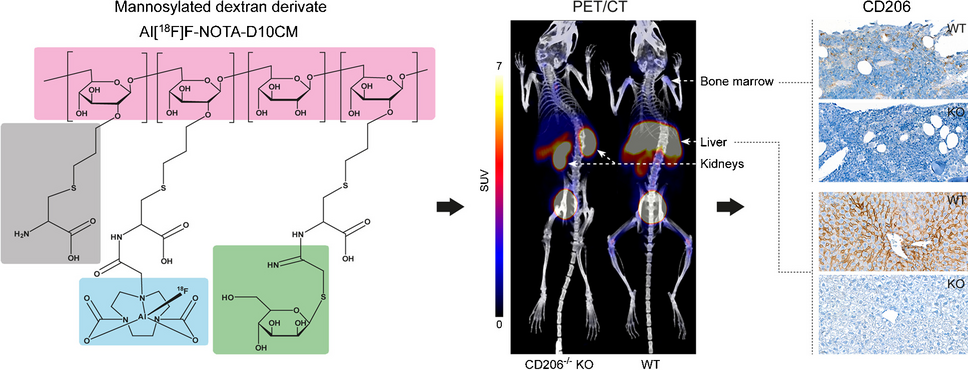
The experimental study design is shown in Fig. 1. A total of 35 mice were divided into five groups: Group 1: CD206−/− KO (n = 4 females + 4 males, weight 25.16 ± 6.03 g, age 10–15 weeks); Group 2: WT (n = 4 females + 3 males, 26.72 ± 3.52 g, 10–23 weeks); Group 3: day 5 after CFA induction (n = 6 females, 20.20 ± 1.69 g, 9 − 10 weeks); Group 4: day 14 after CFA induction (n = 10 females, 20.09 ± 1.22 g, 11 − 12 weeks); and Group 5: healthy controls (n = 4 females, 20.60 ± 0.50 g, 9 weeks). The CFA inductions studies were only performed in WT mice. The mice underwent PET/computed tomography (CT) on consecutive days after i.v. injection of [18F]FDG (4.95 ± 0.51 MBq) or Al[18F]F-NOTA-D10CM (5.66 ± 2.18 MBq [range: 3.41–10.00 MBq], 12.45 ± 4.80 µg [range: 7.50–22.00 µg], 0.57 ± 0.22 nmol [range: 0.34–1.00 nmol]), and i.d. injection of Al[18F]F-NOTA-D10CM into the left hind paw (4.55 ± 1.69 MBq [range: 2.39–9.96 MBq], 10.00 ± 3.73 µg [range: 5.26 − 21.91 µg], 0.45 ± 0.16 nmol [range: 0.24–1.00 nmol]). On the last day of the study, the mice were i.v. injected with Al[18F]F-NOTA-D10CM (7.55 ± 2.84 MBq) and ex vivo analyses were performed 60 min post-injection.
Fig. 1
All animal experiments were approved by the national Project Authorization Board in Finland (license numbers ESAVI/8648/2020 and ESAVI/14685/2020) and were carried out in compliance with EU Directive 2010/EU/63 on the protection of animals used for scientific purposes.
Radiosynthesis of Al[18F]F-NOTA-D10CMA1[18F]F-NOTA-D10CM was prepared according to a previously published method [14]. Briefly, NOTA-D10CM (6.8 nmol in 50 µL water) was radiolabeled with [18F]fluoride (220 µL in saline) by heating at 100°C for 13 min in a mixture of A1C13 in 1 M sodium acetate buffer (pH 4.0, 40 µL), acetonitrile (60 µL), and 150 mM ascorbic acid (40 µL), with 0.1% trifluoroacetic acid (TFA) in water (810 µL) then being added after the reaction mixture was cooled to 40°C. The product was purified with radiodetector-coupled high-performance liquid chromatography (radio-HPLC) using a semipreparative C18 Jupiter Proteo column (250 ×10 mm, 4 µm, 90 Å; Phenomenex) with a gradient of 0.1% TFA in water (solvent A) and 0.1% TFA in acetonitrile (solvent B). The A1[18F]F-NOTA-D10CM was collected in an end product bottle containing 15 mM ascorbic acid in phosphate-buffered saline (PBS).
In vivo PET/CTMice were imaged with PET and CT systems (Molecubes) under isoflurane anesthesia (4 − 5% induction, 1.5 − 2% maintenance). The tail vein was cannulated before imaging. CT was performed for attenuation correction and anatomical reference. A 20 min static PET acquisition was performed 90 min post-injection of [18F]FDG. With Al[18F]F-NOTA-D10CM, a 120 min dynamic PET acquisition was started at the time of injection. PET data obtained in a list-mode were reconstructed into 10 × 60 s, 4 × 300 s, and 9 × 600 s time frames using a three-dimensional ordered subsets expectation maximization algorithm. PET/CT images were analyzed using Carimas 2.10 software (www.turkupetcentre.fi/carimas/). Regions of interest (ROIs) were defined manually on the main organs using CT as the anatomical reference. The inflamed skin area was confirmed by [18F]FDG uptake (Supplementary Fig. 1). At least three consecutive planes at 50 − 60 min after Al[18F]F-NOTA-D10CM injection were used for quantitative analysis. Time-activity curves of standardized uptake value (SUV) as a function of time post-injection were extracted from dynamic PET data.
Ex vivo biodistributionMice were sacrificed by cardiac puncture and cervical dislocation under isoflurane anesthesia at 60 min after the last i.v. Al[18F]F-NOTA-D10CM injection. Tissues of interest were excised and weighed, and their radioactivities were measured with a γ-counter (Triathler 3 ̋, Hidex). The results were decay-corrected to the time of injection, compensated for radioactivity remaining in the tail, and expressed as a percentage of the injected radioactivity dose per gram of tissue (%ID/g).
Ex vivo digital autoradiographyThe left-side inflamed foot pad skin and the left inflamed popliteal lymph node of the mice with CFA-induced inflammation and corresponding tissues from healthy control mice were collected for cryosectioning. The samples were embedded and frozen in Tissue-Tek O.C.T. Compound (Sakura), cut into three serial 20 µm and five 6 µm sections, and collected onto microscopic slides. The slides were briefly air-dried, opposed to phosphor imaging plates (BAS-TR2025, Fuji), and exposed overnight, and the plates were scanned with Fuji Analyzer BAS-5000. Following autoradiography, frozen sections were stained with hematoxylin–eosin (H&E) for histological reference or were used for CD206 detection. ROIs were analyzed on superimposed autoradiography and digitalized H&E images using Carimas software. The results are expressed as photostimulated luminescence per square millimeter (PSL/mm2), decay-corrected for injection time and exposure time, and normalized for the injected radioactivity dose. The target-to-background ratio (TBR) was determined from inflamed and non-inflamed areas defined according to the detection of CD206 (CD206high area/CD206low area). CD206high/CD206low areas were defined on the basis of histology and immunohistochemical and immunofluorescence staining of consecutive sections.
In vivo stability of Al[18F]F-NOTA-D10CMA subset of healthy C57BL/6N mice (n = 6 females, 19.77 ± 0.71 g, 8 − 9 weeks) were i.v. injected with A1[18F]F-NOTA-D10CM (9.76 ± 0.43 MBq [range: 9.07–10.62 MBq], 19.09 ± 7.22 µg [range: 19.95–23.36 µg], 0.87 ± 0.33 nmo1 [range: 0.91–1.06 nmo1]). Blood was withdrawn by cardiac or saphenous vein puncture, and collected into heparinized tubes at 5 min (600.00 ± 200.00 µL, n = 3), 10 min (600.00 ± 200.00 µL, n = 3), 20 min (160.00 ± 17.32 µL, n = 3), 40 min (450.00 ± 259.81 µL, n = 3), and 60 min (533.33 ± 115.47 µL, n = 3) post-injection. Plasma was separated by centrifugation (14,000 × g for 5 min at 4°C), and then plasma proteins were precipitated with 10% sulfosalicylic acid and separated by centrifugation (14,000 × g for 2 min at room temperature). The plasma supernatant was filtered through a 0.45 µm Minispike filter (Waters), and diluted with 0.1% TFA in water, and analyzed with radio-HPLC using a C18 Jupiter Proteo semipreparative column (250 × 10 mm, 5 µm, 90 Å; Phenomenex) and a gradient of 0.1% TFA in water (solvent A) and 0.1% TFA in acetonitrile (solvent B).
In vitro competitive displacement assayCryosections of inflamed popliteal lymph node and foot pad skin (6 µm thickness) from mice with CFA-induced inflammation were defrosted at 4 °C for 40 min. The sections were pre-incubated in 2-[4-(2-hydroxyethyl)piperazin-1-yl]ethanesulfonic acid buffer (HEPES, Sigma Aldrich) (pH 7.4) containing 10 mM Ca2+ for 15 min at room temperature in an incubation chamber. For the total binding study, slides were transferred to another chamber containing Al[18F]F-NOTA-D10CM (23 kBq/mL) in a buffer. For the competitive binding assay, adjacent tissue sections were first incubated with Al[18F]F-NOTA-D10CM (23 kBq/mL) and a 400-fold molar excess of unlabeled NOTA-D10CM in a buffer for 70 min. Then, the slides were rinsed twice with a cold buffer and dipped into cold water. The slides were briefly air-dried, exposed overnight to phosphor imaging plates, scanned, and analyzed as described above. Experiments were performed in triplicate using tissue samples from three mice (n = 3).
Histology, immunohistochemistry, and immunofluorescenceFollowing autoradiography, frozen sections of foot pad skin and popliteal lymph nodes were stained with H&E (20 µm) for histological reference or were used for CD206 detection (6 µm).
For CD206 immunohistochemical staining [14], sections were fixed in 4% paraformaldehyde then submitted to antigen retrieval, washing, and blocking of endogenous peroxidase activity. The sections were then incubated for 60 min at room temperature with polyclonal rabbit anti-mannose receptor (CD206/MRC1) antibody (working dilution 1:10,000; ab64693, Abcam), rinsed, and incubated with the secondary antibody (BrightVision horseradish peroxidase conjugated goat anti-mouse IgG, DPVR110HRP; WellMed) for 30 min at room temperature. The sections were reacted with 3,3-diaminobenzidine (BrightDAB, BSo4-110; WellMed), counterstained with Mayer’s hematoxylin, mounted with Pertex, and dried overnight.
For immunofluorescence staining, sections were first fixed with ice-cold acetone for 3 min, and then incubated for 60 min with Alexa Fluor® 488 monoclonal rat anti-mouse CD206 antibody (BioLegend® 14170, clone C068C2, working dilution 10 µg/mL), Alexa Fluor® 594 monoclonal rat anti-mouse CD31 antibody (BioLegend® 102520, clone MEC13.3, working dilution 10 µg/mL), and Alexa Fluor® 647 monoclonal rat anti-mouse CD11b antibody (BioLegend® 101220, clone M1/70, working dilution 10 µg/mL) in a humidified chamber covered to prevent light exposure. The sections were then rinsed twice with PBS and counter stained with 4′,6-diamidino-2-phenylindole (DAPI, Invitrogen D1306). The slides were then washed twice with PBS and coverslips were mounted with ProLong Gold Antifade (Invitrogen P36930) mounting medium.
Stained sections were scanned with a digital slide scanner (Pannoramic P1000 or Pannoramic 250 Flash, 3DHISTECH Ltd.) and examined using Pannoramic Viewer 1.15 software (3DHISTECH Ltd.). For quantitative analysis of CD206 area-%, sections were classified as CD206high and CD206low areas by fuzzy selection in GIMP (version 2.10.24), based on a specific RGB color threshold of 19 with H&E used as a reference (Supplementary Fig. 2). Quantification of CD206high and CD206low area-% was performed by color deconvolution analysis based on hematoxylin and DAB stains using ImageJ 1.52n software Fiji (Wayne Rasband, https://imagej.net/software/fiji/).
Immunofluorescently stained sections were imaged with the 3i Spinning Disk confocal microscope (Intelligent Imaging Innovations) with a Plan-Apochromat 20 × /0.8 objective. Z stack images were acquired with SlideBook 6 software (Intelligent Imaging Innovations). ImageJ software was used to create maximum intensity projections and perform background subtractions and linear brightness adjustments.
Statistical analysisResults are expressed as mean ± standard deviation (SD). Differences between groups were analyzed with unpaired Student’s t tests or one-way analysis of variance (ANOVA). P-values < 0.05 are considered statistically significant and referred to as *P < 0.05, **P < 0.01, and ***P < 0.001. Associations between two variables were evaluated using Pearson’s correlation coefficient.
留言 (0)