
記住我


The biopsy slides of 116 patients (94 women and 22 men; mean age 59 years) were utilized. Two patients were biopsied twice at different time points before the treatment; therefore, 118 biopsies were used in the study. The biopsy material was split and embedded into two blocks for five biopsies; therefore, more than one slide was available for these biopsies. Overall, a total of 123 pairs of H&E- and Sirius red-stained AIH pre-treatment biopsy slides were included in the study.
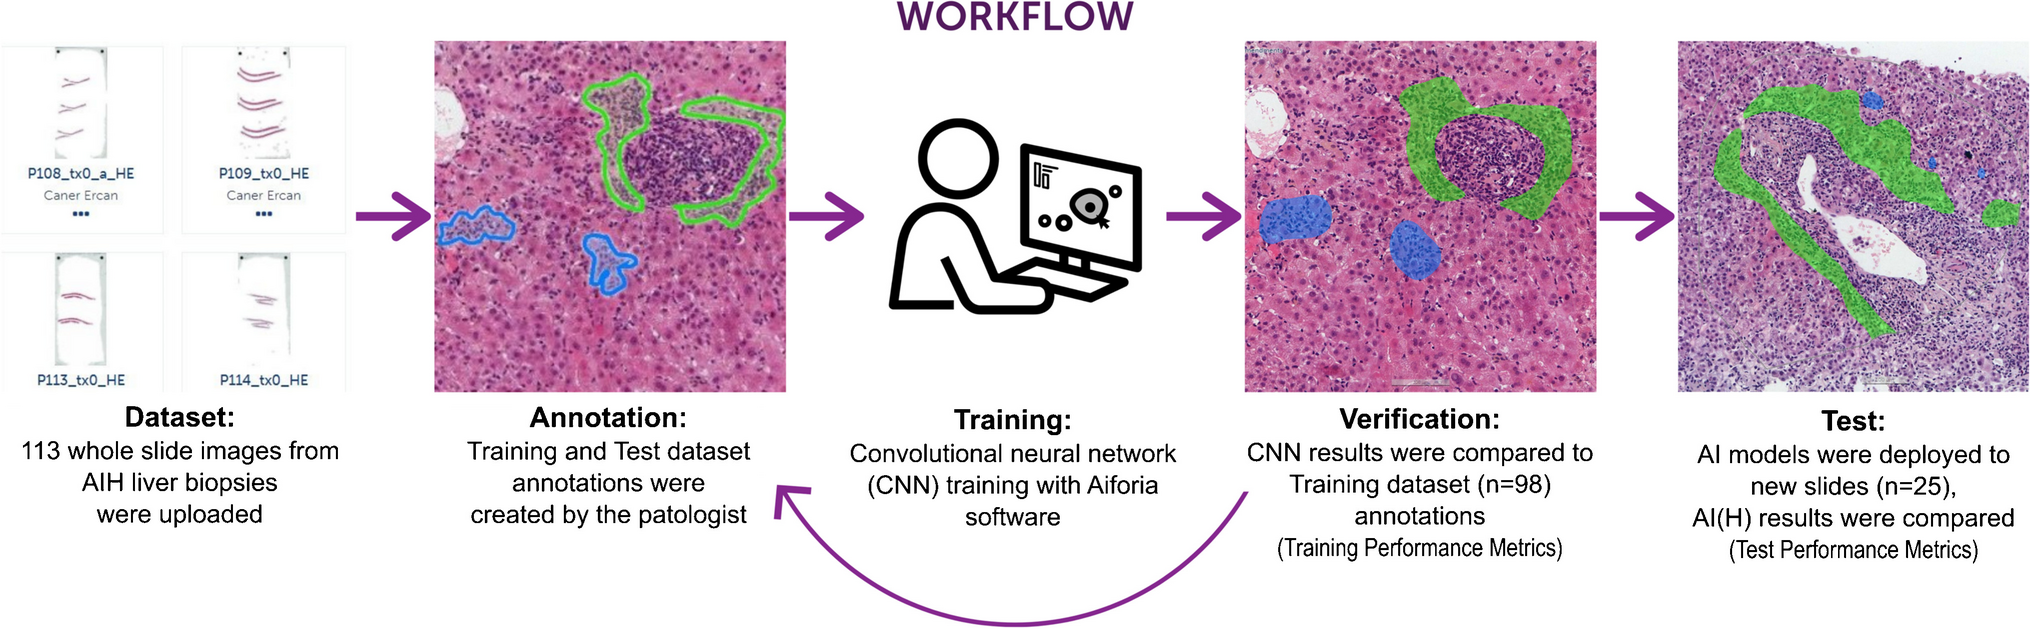
Biopsy slides of patients were randomly assigned to training (n = 99) and test (n = 24) datasets. Baseline characteristics for the patients who provided biopsies were balanced between the training and test data sets (Table 2).
Table 2 Baseline characteristics of the patients who provided biopsiesThe pipeline for identification of AIH histology and model performanceTo achieve the detection of AIH-related changes in liver biopsies, we developed a deep learning pipeline that consists of multiple deep learning models for different structures, features, and staining. A list of the final AI models with their layer structure and classes is presented in Table S1. Image analyses were run on the training and test set slides using the respective AI models. The models gave high test accuracies when evaluated on the separate test dataset (Tables 3 and 4).
Table 3 AI(H) performance on inflammation-focused tasks, H&E slidesTable 4 AI(H) performance on fibrosis-focused tasks, Sirius red slidesWe began with the segmentation of whole liver tissue area against background space. The tissue segmentation (foreground vs background) models showed excellent performance for both H&E- and Sirius red-stained slides, with over 99.4% accuracy. Following this, we set up semantic segmentation AI models for liver microanatomy which segments liver tissue into parenchyma, portal area, and central vein regions (Fig. 2). The pixel-level accuracy of the H&E model was 88.0% (Table 3), while that of Sirius red was 94.0% (Table 4).
Fig. 2
AI(H) predictions on H&E slides. The analysis of images is a multi-step process. A H&E-stained WSIs are used for detections (scale bar is 500 µm). B The AI model begins with segmenting liver tissue into its normal micro-structures, such as portal area, parenchyma, and central vein (scale bar is 500 µm). C The relevant necroinflammation features are detected in hepatitis landscape (scale bar is 250 µm). D Total five classes of immune cells (lymphocytes, plasma cells, macrophages, neutrophils, eosinophils) are detected and classified in all over the liver tissue. (scale bar is 200 µm). AI(H), artificial intelligence for hepatitis; H&E, hematoxylin and eosin; WSI, whole-slide image
We trained necroinflammation models on H&E slides to detect and classify elementary lesions of hepatitis such as interface hepatitis, focal necrosis, focal confluent necrosis, perivenular necrosis, bridging necrosis, and panacinar necrosis classes (Fig. 2). The overall accuracy of the necroinflammation segmentation model was 83.9% (Table 3). However, errors in the predictions mostly stemmed from lesions that were correctly classified but did not perfectly align with the ground truth annotations (Sup. Figure 1A-B). The portal inflammation model first detected the portal regions with inflammation, then consecutively graded them in a three-tier system: mild, moderate, and severe portal inflammation. The model had 79.2% accuracy (Table 3).
The immune cell classification model was designed to detect, classify, and quantify lymphocytes, plasma cells, macrophages, eosinophils, neutrophils, along with acidophil bodies (Fig. 2). To train and test the network, a total of 7868 annotations of immune cells were generated across all the datasets. The model accuracy rate for detection and classification of the immune cells was 72.4% (Table 3, Sup. Table 1). However, errors were observed primarily in densely inflamed regions, where the individual immune cell borders could not be easily differentiated (Sup Fig. 1C). Bile duct injury model detects and classifies bile ducts into “normal” and “damaged” categories. Bile duct injury was described as epithelial infiltration by mononuclear inflammatory cells, epithelial damage, and malformed, tortuous or irregularly shaped bile ducts (Fig. 3A) [8]. The accuracy of the model was 81.7% in the test dataset (Table 3). The result of the model showed that 69.5% (66/95) training set biopsies and 65.2% (15/23) test set biopsies (68.6% overall) had bile duct damage.
Fig. 3
AI(H) predictions on Sirius red slides. A The bile duct damage can be detected even in highly inflamed of portal areas. (red injured bile duct, green normal bile duct) (the scale bars are 100 µm). B The Sirius red slides are analyzed for detecting the fibrosis-related changes. The fibrosis model was trained to segment portal fibrosis, perivenular fibrosis, pericellular fibrosis, bridging fibrosis, nodular fibrosis, and cirrhosis on slide images (top and bottom scale bars are 500 µm and 250 µm, respectively)
Fibrosis-related features were trained and tested on Sirius red-stained slides. The fibrosis model consists of portal fibrosis, perivenular fibrosis, pericellular fibrosis, bridging fibrosis, nodular fibrosis, and cirrhosis classes (Fig. 3B). Portal areas without fibrosis were left in the background. The overall accuracy of the model was 88.0%. While the model’s predictions often showed decent alignment with the ground truth annotations, errors in both the detection and classification of fibrotic lesions were observed in some regions (Sup Fig. 1D).
To get a deeper insight of AIH pathology, several AI models were combined to observe unique features together. For example, the combination of the necro-inflammation and bile duct models is shown in Fig. 2. The visual overlay output can assist pathologist for detection of particular lesions or evaluating the spatial relationship to detect the hotspot regions.
Quantitative analysis of AI(H) predictions: comparison with pathologists’ evaluationWe conducted an additional analysis to further explore the utility of the AI-based image analysis tool. This analysis aimed to investigate the potential correlation between the AI(H) predictions and the pathologists’ assessments in terms of histological grading and staging of AIH biopsies. Quantification data obtained from the computational analysis were exported and compared among different grading feature groups as determined by the pathologists’ evaluations.
For focal necrosis, we compared the maximum count of focal necrosis in 4 µm2 between different focal necrosis scores (0–4 according to the Ishak scoring system). The results from AI(H) demonstrated a clear increase in focal necrosis counts with higher focal necrosis scores (Fig. 4A). Additionally, we observed a concurrent increase in immune cell density in the liver parenchyma for five different cell types along with focal necrosis counts (Fig. 4B).
Fig. 4
Comparison of histological features and AI(H) quantification results. A The maximum count of focal necrosis in 4 μm2 was compared between focal necrosis scores according to the Ishak scoring system. The AI(H) results are in line with the pathologists’ evaluations. B Moreover, the immune cell density in the portal area for the five cell types shows a noticeable increase in parallel with interface hepatitis scores. C Additionally, the immune cell density in the liver parenchyma for five cell types (lymphocyte, plasma cell, macrophage, eosinophil, and neutrophil) shows a clear increase in inflammation with focal necrosis counts. D The moderate-level portal inflammation ratio was compared between portal inflammation scores according to the Ishak scoring system. The AI(H) results indicate an increase in the ratio with higher scores. E The maximum ratio of the length of the portal area to the circumference of the portal area by interface hepatitis was compared across interface hepatitis scores. The AI(H) results exhibit an increase in the ratio with higher scores. F Furthermore, the immune cell density in the portal area for the five cell types displays a distinct increase with increasing portal inflammation scores
In the case of interface hepatitis, we analyzed the maximum ratio of the length of the portal area to the circumference of the portal area for each biopsy, based on interface hepatitis scores. To calculate the circumference of the portal area affected by interface hepatitis, we utilized the portal area predictions from the microanatomy model as the denominator of the calculation. Our findings revealed a consistent increase in the ratio with higher interface hepatitis scores, as demonstrated by the AI(H) results (Fig. 4C). Similarly, the immune cell density in the portal area for the five cell types showed a noticeable increase corresponding to the severity of interface hepatitis (Fig. 4D).
Lastly, we investigated portal inflammation by comparing the moderate level portal inflammation ratio between different portal inflammation scores (0–4 according to the Ishak scoring system). The AI(H) predictions exhibited an incremental pattern with increasing portal inflammation scores (Fig. 4E). Furthermore, the immune cell density in the portal area for the five cell types exhibited a parallel increase in relation to portal inflammation scores (Fig. 4F).
The results of this comparative analysis provide insights into the concordance between AI-based predictions and expert pathologists’ evaluations, thereby highlighting the potential clinical value of AI(H) in enhancing the accuracy and consistency of AIH assessment.
Utilization of AI(H) outputs for AIH histopathology assessmentWe explored the potential of model’s quantification outputs for stratifying liver biopsies according to the latest consensus recommendations for histological criteria of AIH from the International AIH Pathology Group [6]. Among the samples analyzed, the 29/119 (24.4%) exhibited a “Portal hepatitis pattern” (Sup. Figure 2A). All the portal hepatitis samples showed either lobular hepatitis or interface hepatitis, thus 29/29 (100%) were classified in the likely category. On the other hand, 90/119 (76.6%) of biopsies were classified as “Lobular hepatitis pattern” (Sup. Figure 2A). Among these, 74/90 (82.2%) samples demonstrated the presence of at least one of the following: interface hepatitis, portal fibrosis, or lymphoplasmacytic inflammation, classifying them as likely for AIH, while 19/90 (17.8%) biopsies within the lobular hepatitis category were considered possible for AIH.
Subsequently, we compared the predictions of AI(H) against the pathologist’s diagnosis based on the latest consensus recommendations for histological criteria of AIH. The predictions of AI(H) showed 88.2% accuracy in classifying AIH biopsies into “likely” and “possible” categories (Supplementary Fig. 2B). Misclassification within the “likely” category was primarily due to overdiagnosis of interface hepatitis, indicating potential for improvement in feature differentiation (Supplementary Fig. 2C). Conversely, misclassification in these samples was also influenced by factors like discoloration from long archive time and severe parenchymal necrosis, underscoring the importance of sample quality for accurate AI-based diagnosis (Supplementary Fig. 2D). Collectively, these results demonstrate potential use cases of the quantification output of AI(H) in pathologist’s evaluations.
While the AI(H) model has not been trained to identify features suggestive of other liver diseases, nor has it been systematically validated for clinical diagnosis performance, it is suboptimal for this purpose. Nonetheless, our experiment illustrates its versatility in providing quantification data for various applications.
Detection of chronic hepatitis features in non-AIH liver biopsies by AI(H)In light of the similarities in elementary lesions observed in hepatitis biopsies, including focal necrosis and interface hepatitis, we explored the detection performance of AI(H) for chronic hepatitis features in samples diagnosed with other acute and chronic hepatitis conditions. Specifically, we examined liver biopsies diagnosed with drug-induced liver disease with acute lobular hepatitis and HCV- and HBV-chronic hepatitis.
While AI(H) was not initially developed for analyzing non-AIH liver biopsies, our observations reveal its capability to recognize hepatitis elementary lesions, such as focal necrosis, interface hepatitis, and portal fibrosis, alongside immune cells and bile duct damage (Supplementary Fig. 3). Although the model demonstrated decent performance across various tasks, we noted incidental errors, such as false bile duct damage classification in inflamed regions and underestimation of immune cells. Of particular note, while many interface hepatitis regions were detected correctly, some detections were smaller than the lesions themselves. Overall, these findings suggest that with fine-tuning using annotations for each disease, the model holds potential to be utilized in other liver diseases.
留言 (0)